The S&P 500 dropped 0.48% on Monday and closed near 7,620 as the rally in oil prices and higher Treasury yields pressured the market. Brent oil traded near $108 on Tuesday while WTI remained above $103. The elevated oil prices and higher yields could keep inflation high and raise costs for businesses and consumers. Higher bond yields also reduce the appeal of expensive stocks. But strong earnings, healthy employment and gains in energy stocks continue to support the broader outlook. In my view, the index remains bullish in the long term but a break below 7,600 could trigger a deeper correction. The Fed begins its two-day meeting on Tuesday. The rate decision by the Fed may shape the next move in the S&P 500.
Eric Chia, Financial Markets Strategist at Exness, commented:
The S&P 500 is being pulled in two directions. Company earnings remain strong and the US economy continues to show resilience, but oil above $100 and rising bond yields are creating new pressure. Higher energy costs can feed into inflation and squeeze company profits, while higher yields make borrowing more expensive. With the Fed decision approaching, markets are likely to remain particularly sensitive to inflation, oil prices and interest rates.

WTI and Brent Forecast: Oil Pulls Back as Supply Fears Ease
Forecasts · Brent Oil · 2 min readS&P 500 Slides as $100 Oil and Rising Treasury Yields Fuel Inflation Fears
Oil Supply Risks and Rising Treasury Yields Pressure the S&P 500
The S&P 500 fell 0.48% on Monday and closed near 7,620. The index briefly slipped below 7,600 before recovering into the close. The majority of stocks on the S&P 500 closed lower for the day. This suggests that the selling pressure influenced majority of the market. Trading volume was slightly below the recent average which indicates that investors turned cautious but not panicked.
One of the reasons for the decline in S&P 500 from the 7,800 level was the strong oil prices. WTI and Brent oil prices have surged significantly over the past few weeks due to the escalating tensions between US and Iran. The attacks on Saudi energy infrastructure increased supply concerns. The East-West pipeline in Saudi Arabia remained offline, while traffic through the Strait of Hormuz stayed restricted. Brent oil is up by over 25% since its early August low. The higher energy costs can lead to increased transport and production costs. These costs can also curb consumer spending.
The 10-year Treasury yield surged to around 5.03% on Tuesday, which is the highest level since 2007. The surge in oil prices, inflation concerns and the expectation of a rate hike by the Fed drove the latest rise. An increase in bond yields can reduce the appeal of expensive stocks, which creates a headwind for S&P 500.
S&P 500 Price Forecast
Every new S&P 500 analysis as it publishes, today's technical signal and key levels, live price — on one page.
See all S&P 500 forecastsEnergy Stocks and Strong Earnings Support the S&P 500 Outlook
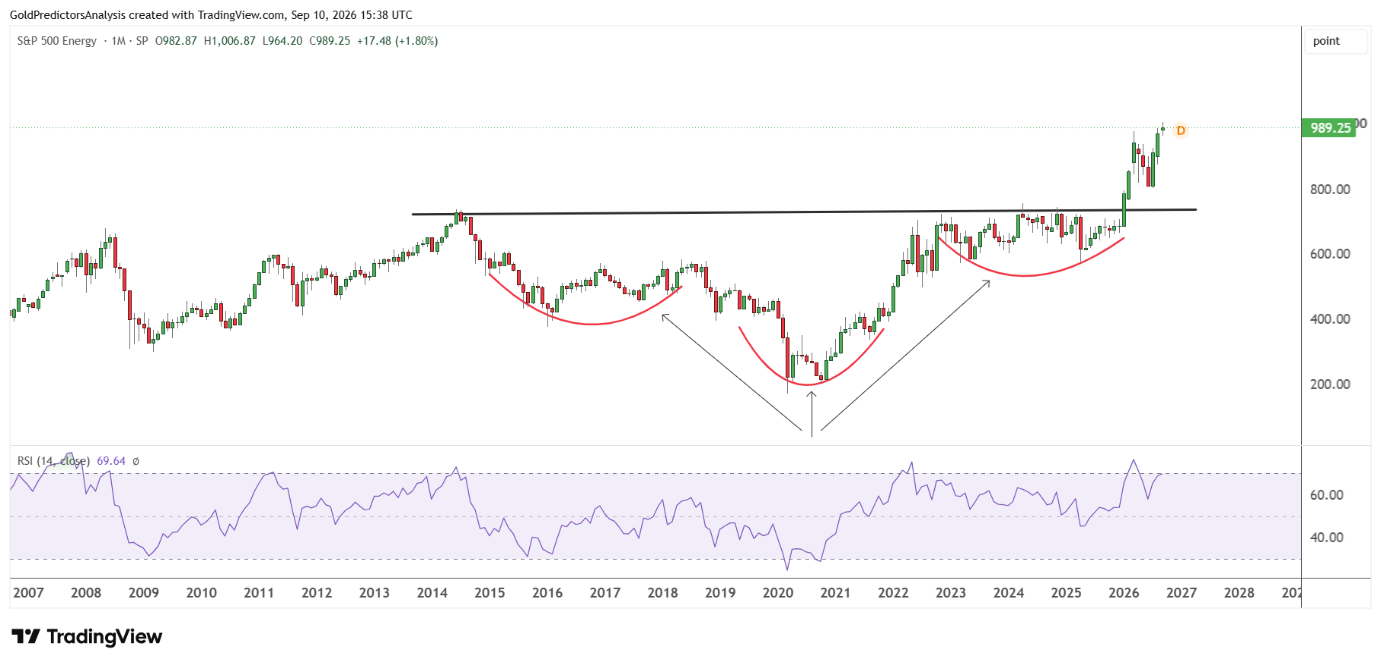
Despite the weakness in the S&P 500, the energy sector for the index continues to strengthen due to strong oil prices. The chart below shows that the S&P 500 energy index has formed an inverted head and shoulders pattern from 2014 to 2025. The index continues to surge after the breakout in 2026. The energy index has gained 6.48% in August and continues to show strength.
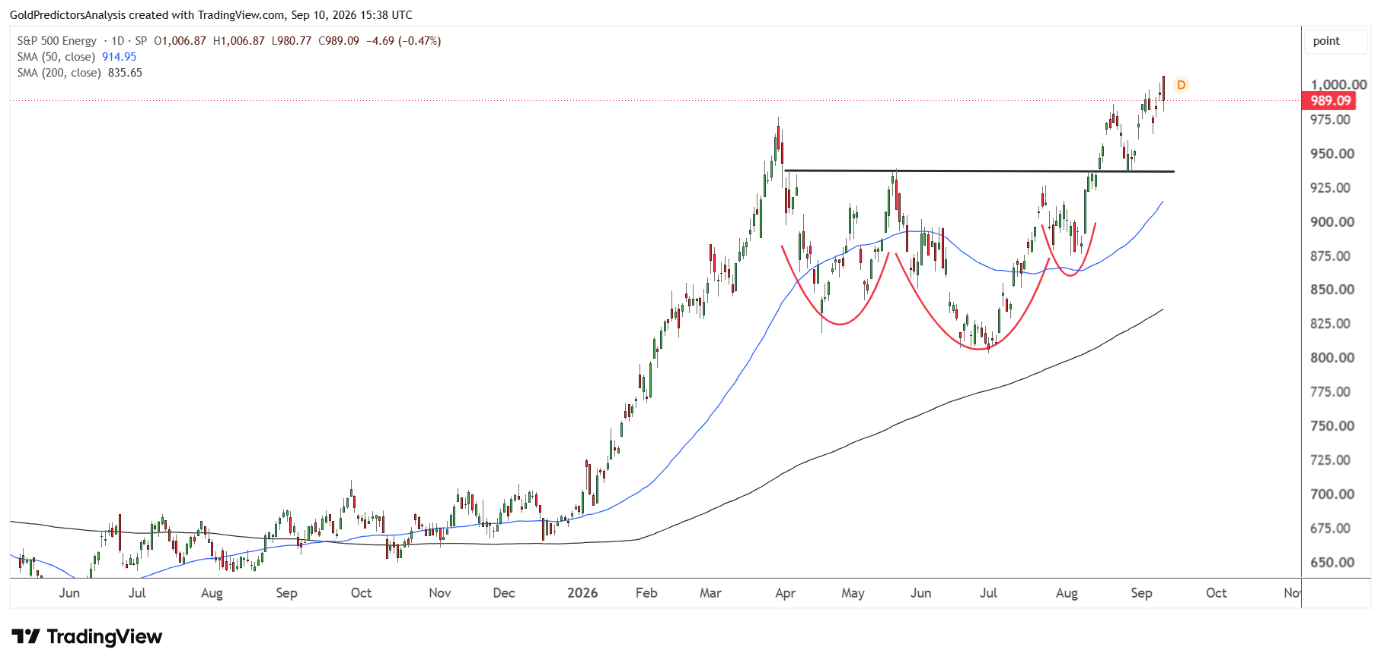
The short-term outlook for the S&P 500 energy index also shows strength by forming the inverted head and shoulders pattern. This suggests that the energy stocks will likely be strong in the short term.
Meta Platforms, Inc. (META) also gained strength after the launch of the new AI assistant. Apple inc. (AAPL) and Alphabet Inc. (GOOGL)) have also strengthened in the short term. The earnings prospects are still favorable in the medium term. Barclays raised the S&P 500 forecast to 7,950 by the end of the year and increased the earnings forecast to $365 per share for 2026. The index may get support from the strong earnings while high oil prices and rising yields may limit the recovery in the near term.
S&P 500 Outlook: Risk-On Signals Face Extreme Valuations
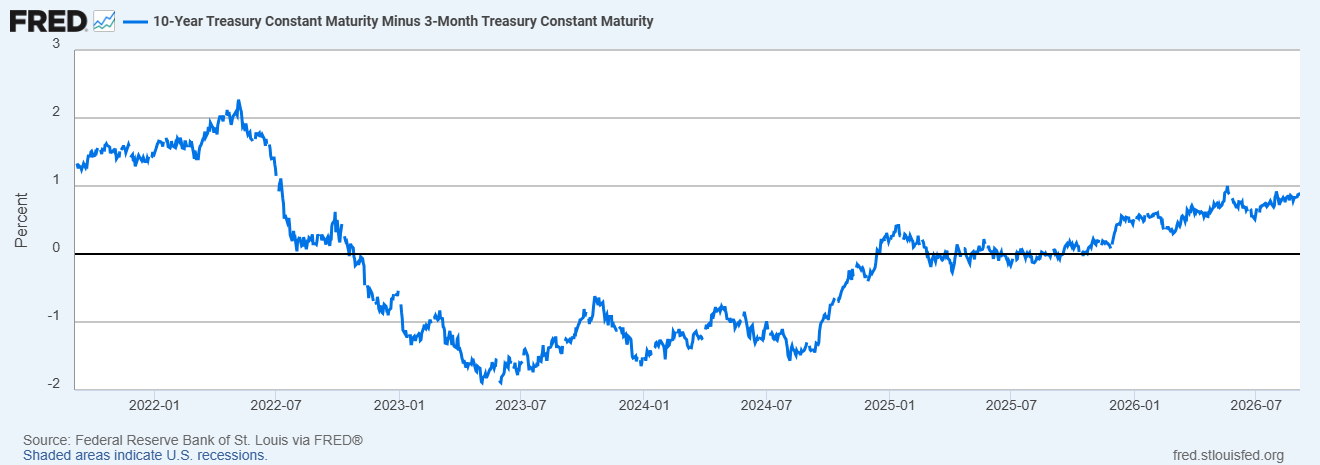
There are several long term indicators that point to a risk-on market. The spread between the 10-year and 3-month Treasury yields remains at 0.86%. It has remained positive for more than 100 days. The S&P 500 also trades above the 12-month weighted moving average.
The Fed has kept the target rate at 3.50%-3.75%. However, markets now see around 93% chance of a 25 basis point hike on Wednesday after the latest inflation reports. But the risk remains high in the short term. The positive yield curve supports the economic outlook, but high long term yields could limit gains in stocks.
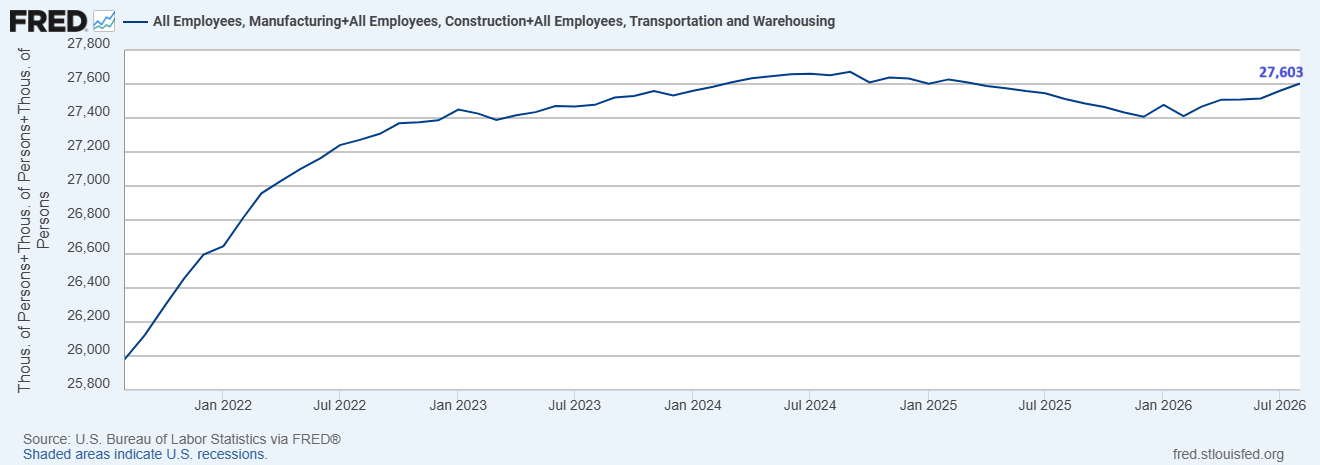
The chart below shows that cyclical employment also remains strong. It is observed that employment in manufacturing, construction, transportation and warehousing reached 27.603 million in August. This was up from a revised 27.560 million in July.
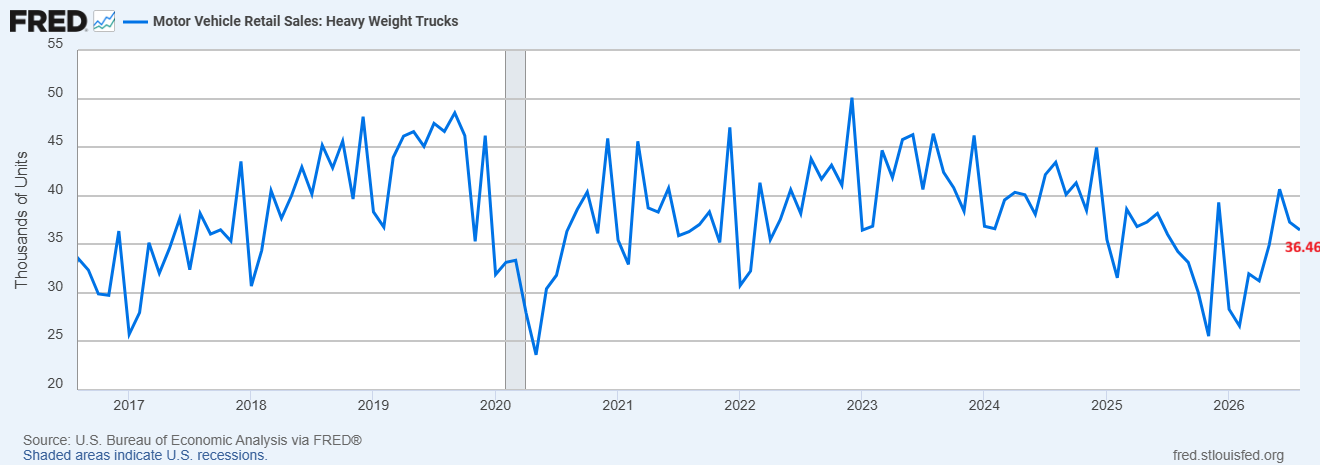
But heavy truck sales present a weaker picture. The chart below shows that there were 36,464 sales in August which is down from a revised 37,277 in July. This decline suggests that transport companies have become less confident about freight demand and business activity. The heavy truck signal will remain risk-off until sales rise by at least 10% from their latest low.
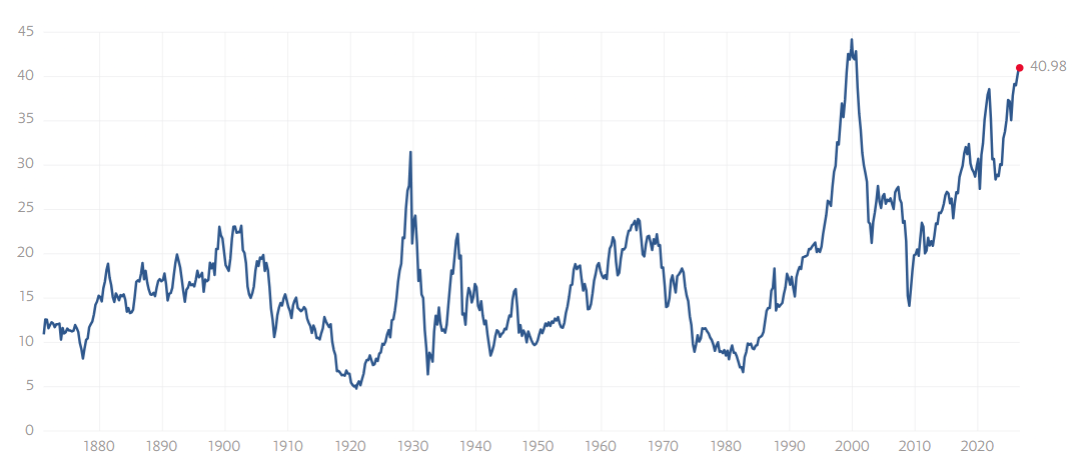
The stock valuations remain the main risk for long term traders. The Dow’s trimmed mean forward PE fell to 20.53 from 21.88, but the composite stock-pricing indicator still stands near the 96th percentile.
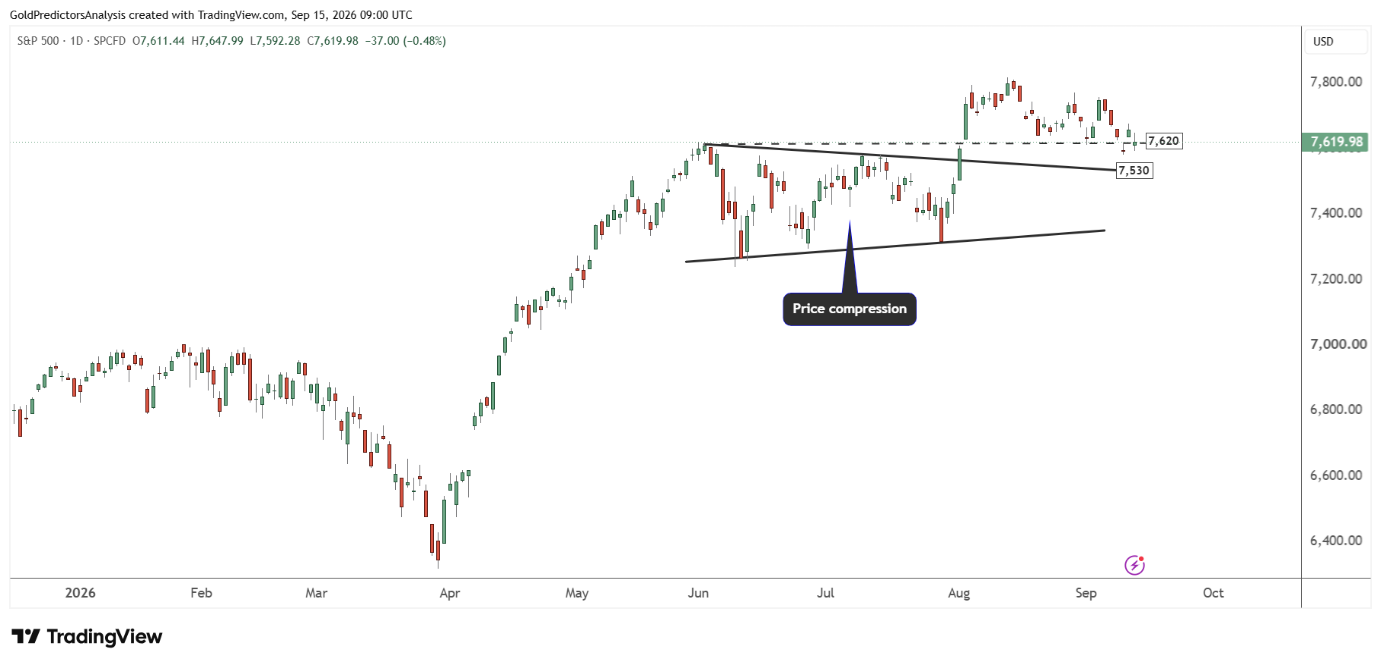
The Shiller CAPE also reached the second-highest in history after the dot-com peak. These measures do not predict the exact timing of correction, but they make stocks more sensitive to oil, inflation and bond yields. In my view, 7,600 is the immediate support level. A break below this level could expose 7,500-7,530. But a break above 7,750-7,800 would ease the pressure and push the index to 7,950 and 8,000 levels.
S&P 500 Technical Analysis: Can 7,600 Support Hold?
The daily chart for the S&P 500 shows constructive price action in 2025 and 2026. The formation of an inverted head and shoulders pattern in Q1 and Q2 2025, followed by the ascending broadening wedge pattern from July 2025, indicates constructive price action in the long term. The price formed V-shaped recovery in March 2026 and broke above the 7,000 area. This breakout has strengthened the bullish price action and indicates the minimum target of around 8,000.
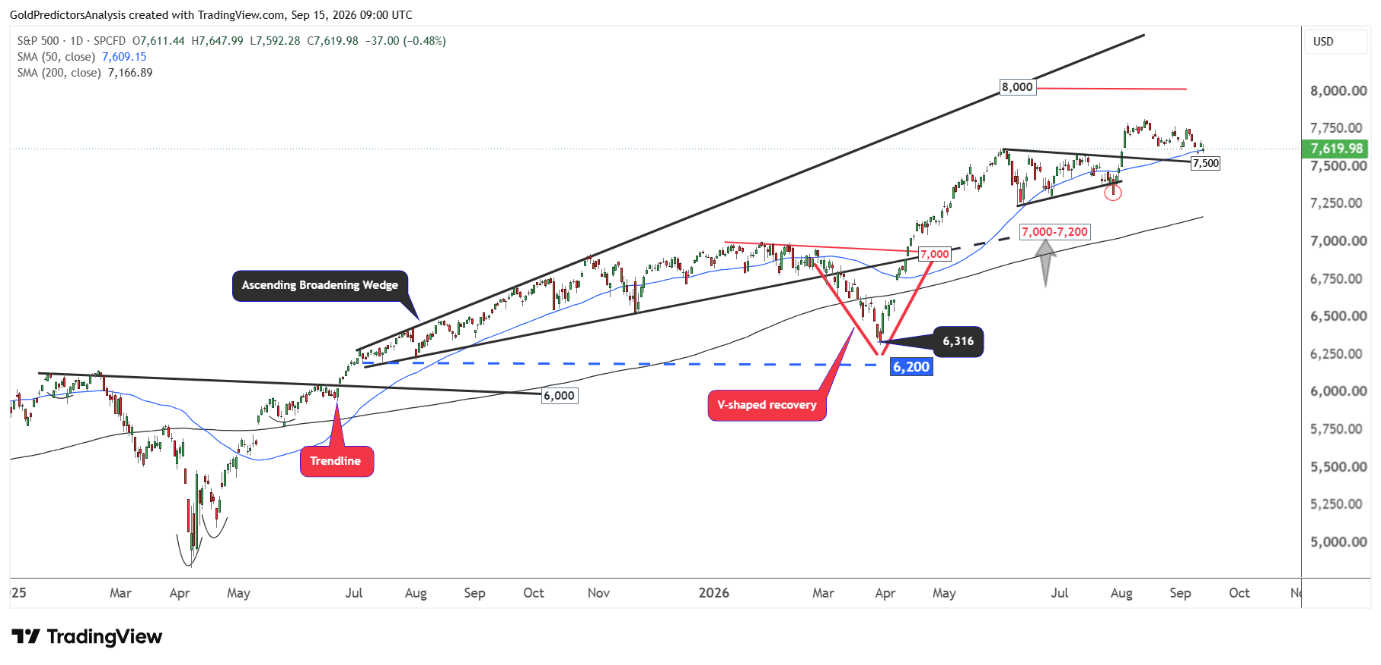
However, the index remains below 7,800 and is testing the 7,600 area. It briefly moved below 7,600 on Monday but recovered before the close. A sustained move below 7,600 could expose the 7,500-7,530 support zone. A break below this zone may open the way for a deeper correction.
The chart below shows that the index is hovering above the $7,530 support area. A correction to this support may create a strong rebound. But a break below $7,530 will push the index toward $7,350.
What to Watch Next for the S&P 500
The S&P 500 remains bullish in the long term, but the risks are rising in the short term. Strong employment, a positive yield curve and healthy earnings continue to support the index. However, oil near $108, a 10-year Treasury yield above 5%, weak heavy truck sales and expensive valuations may limit the gains in S&P 500. In my view, 7,600 remains the immediate pivot. A sustained move below this level could expose 7,530 while a recovery above 7,800 would open the way to 8,000. The Fed’s decision on Wednesday and new developments in the Middle East could drive the next move in the S&P 500.