Spot Silver Gained Friday but Could Not Hold $65.00
Spot Silver settled higher Friday after buyers showed up in the low $63 area and pushed the market back above the 50-day moving average. They ran out at $65.09. The 10-year Treasury yield settled near 5.167% after reaching 5.225% Thursday, the highest since June 2007. The Dollar Index pulled back to 101.03 after hitting 101.39 but held above both its 50-day and 200-day moving averages. Spot Silver got one session of relief after a hard week. The rate trade and the dollar gave ground Friday. They did not reverse.
Spot Silver settled at $64.30, up $0.45 or +0.71%. It traded from $63.361 to $65.09.

Daily Spot Silver (XAGUSD) Technical Analysis
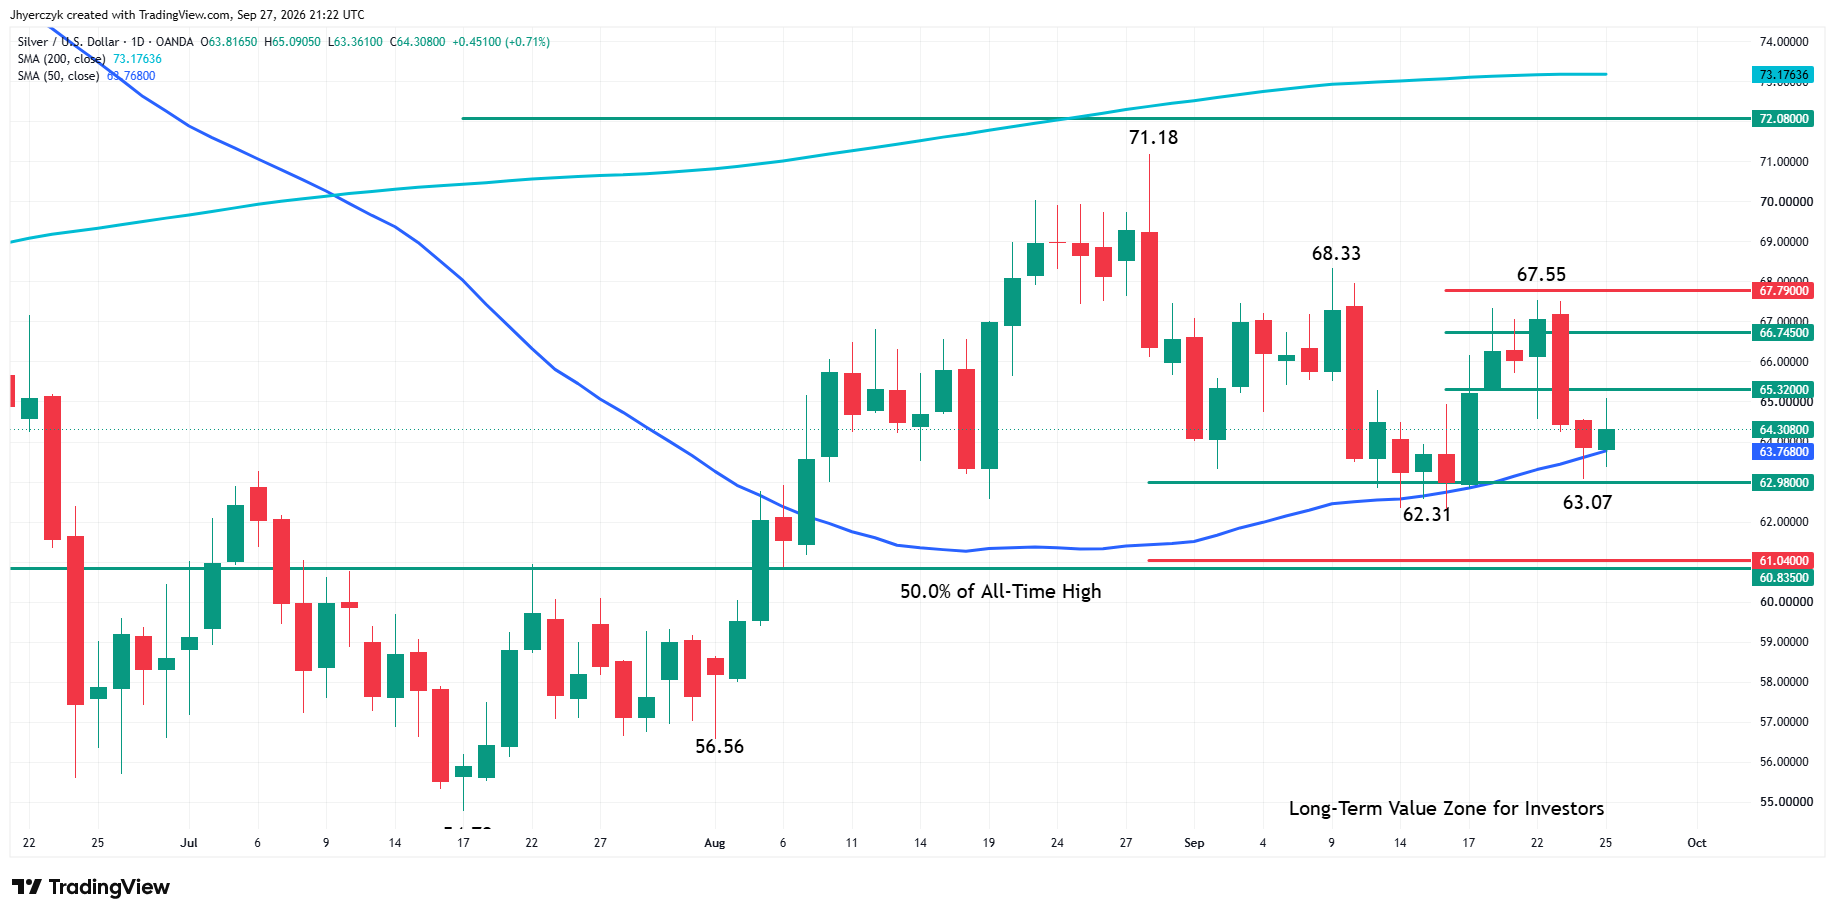
Spot silver closed higher on Friday after crossing to the strong side of the 50-day moving average at $63.77. The price action over the last two weeks indicates that this indicator is controlling the near-term direction of the market.
The daily swing chart indicates the main trend is down. A trade through $67.55 will change the main trend to up. A move through $62.31 will signal a resumption of the downtrend.
The new minor bottom is $63.07. A trade through this level will shift momentum back to the downside and put the $62.31 main bottom in play.
Retracement zone support is $62.98 to $61.04. Pivot price resistance is $65.32, followed by a retracement zone at $66.75 to $67.79.
The 50-day moving average at $63.77 is controlling the near-term direction. The 200-day moving average at $73.18 is controlling the long-term direction, which remains down.
Although the swing indicator trend is bearish, holding above the 50-day moving average creates the possibility of a counter-trend rally. A break back below it will put the focus on $63.07 and $62.31 and strengthen the swing-chart downtrend.
Silver Price Forecast
Every new Silver analysis as it publishes, today's technical signal and key levels, live price — on one page.
See all Silver forecastsThe 10-Year at a 19-Year High Ran the Week
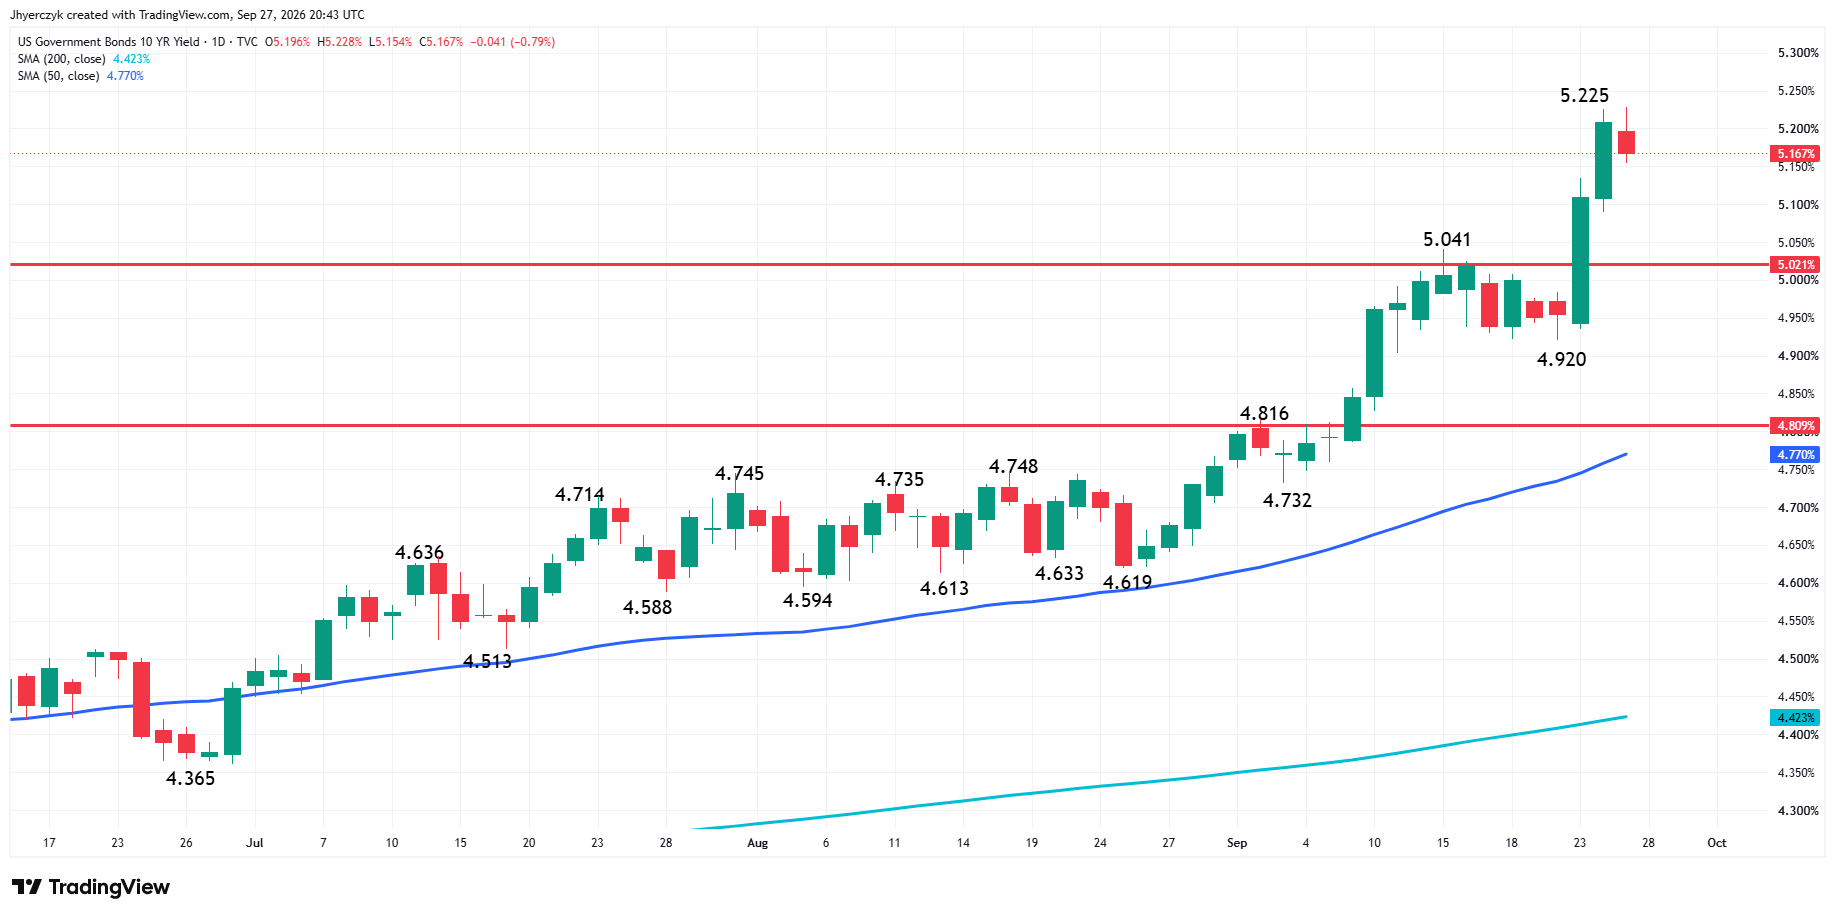
The 10-year Treasury yield reached 5.225% Thursday before settling near 5.167% Friday. The 30-year pushed to levels last seen in 2004. The sell-off was not limited to U.S. Treasuries. Japanese government bonds, U.K. gilts, German bunds, and eurozone debt all moved higher in yield during the week.
Federal Reserve Governor Michael Barr said this week that further policy adjustments could be needed. Stronger economic data, sticky inflation, and elevated energy prices behind the move. CME FedWatch had October rate-hike odds near 64% to 66% and December substantially higher. The Fed raised 25 basis points last week, its first increase in three years. The rate market responded by pricing more, not less.
Spot Silver reached $67.55 earlier in the week before the selling accelerated into the $63 area. The 10-year went from 5.04% to 5.225% over the same stretch. The metal and the yield moved in opposite directions all week. Friday’s small bounce happened when the yield stopped climbing, not when anything changed about the rate outlook.
The Dollar Pulled Back 0.21% and Spot Silver Still Stalled at $65
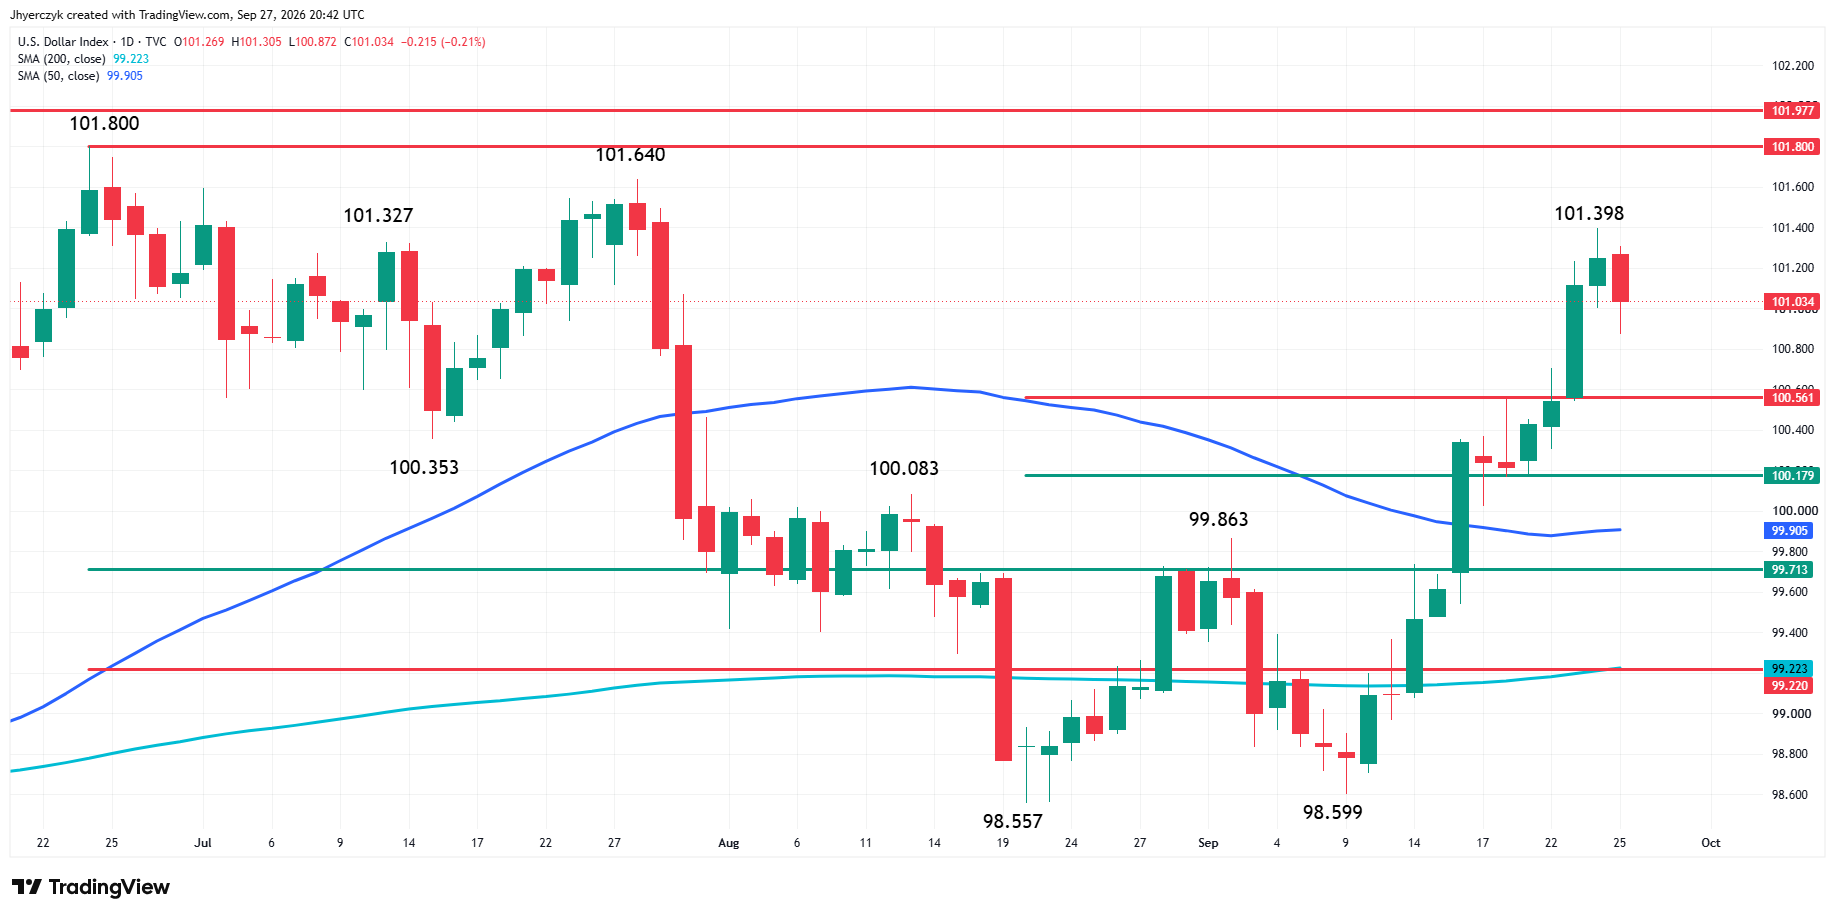
The Dollar Index slipped 0.21% Friday to 101.034 after reaching 101.398. The index is still above its 50-day and 200-day moving averages. The weekly rally in the dollar is intact after one session of selling.
Friday’s pullback helped Spot Silver avoid a lower close. Buyers lifted the metal off the $63.361 low and pushed it back above the 50-day. They ran out before $65.10. Sellers showed up in the same area they showed up all week. The dollar backed off. Spot Silver still could not get through the next level. That tells you the rate trade is doing more work against the metal than the dollar pullback is doing for it.
The Diplomacy Headline Took Some of the War Bid Away
Reports that U.S. and Iranian negotiators were exploring a phased path out of the war softened crude oil Friday. The proposal would include reopening the Strait of Hormuz while Washington lifts its economic blockade. Iran said it would not show flexibility on its nuclear program. The gap between the two sides is still wide.
Crude sold off on the possibility of progress. That took some of the safe-haven demand out of precious metals. Spot Silver had been holding some of that bid while the Strait remained impaired. Friday’s headlines reduced it. The rate pressure was already running against the metal. Losing part of the geopolitical support on the same week made the combination harder to trade from the long side.
Spot Silver is still well below the late-August high at $71.18 and the 200-day at $73.18. Friday’s gain was constructive after the sell-off. It did not put buyers back in control.
What to Watch
The 10-year yield is the first screen heading into next week. It settled near 5.167% Friday after reaching a 19-year high Thursday. A move back toward 5.225% keeps Spot Silver under the same pressure that stopped every rally this week. The Dollar Index held above its moving averages despite Friday’s pullback. Both have to ease together before Spot Silver can turn Friday’s bounce into something more than a one-session hold above the 50-day.
The 50-day at $63.77 held Friday and has been controlling the near-term direction for two weeks. The minor bottom at $63.07 is the first downside trigger. Below it, the $62.31 main bottom and the $62.98 to $61.04 retracement zone are where the trend gets tested. On the upside, $65.32 is the first pivot. Sellers have been sitting there. Buyers need to clear it before $66.75 to $67.79 and the $67.55 main top come into play.
More Information in our Economic Calendar.