Failed Resistance Signals Deeper Correction
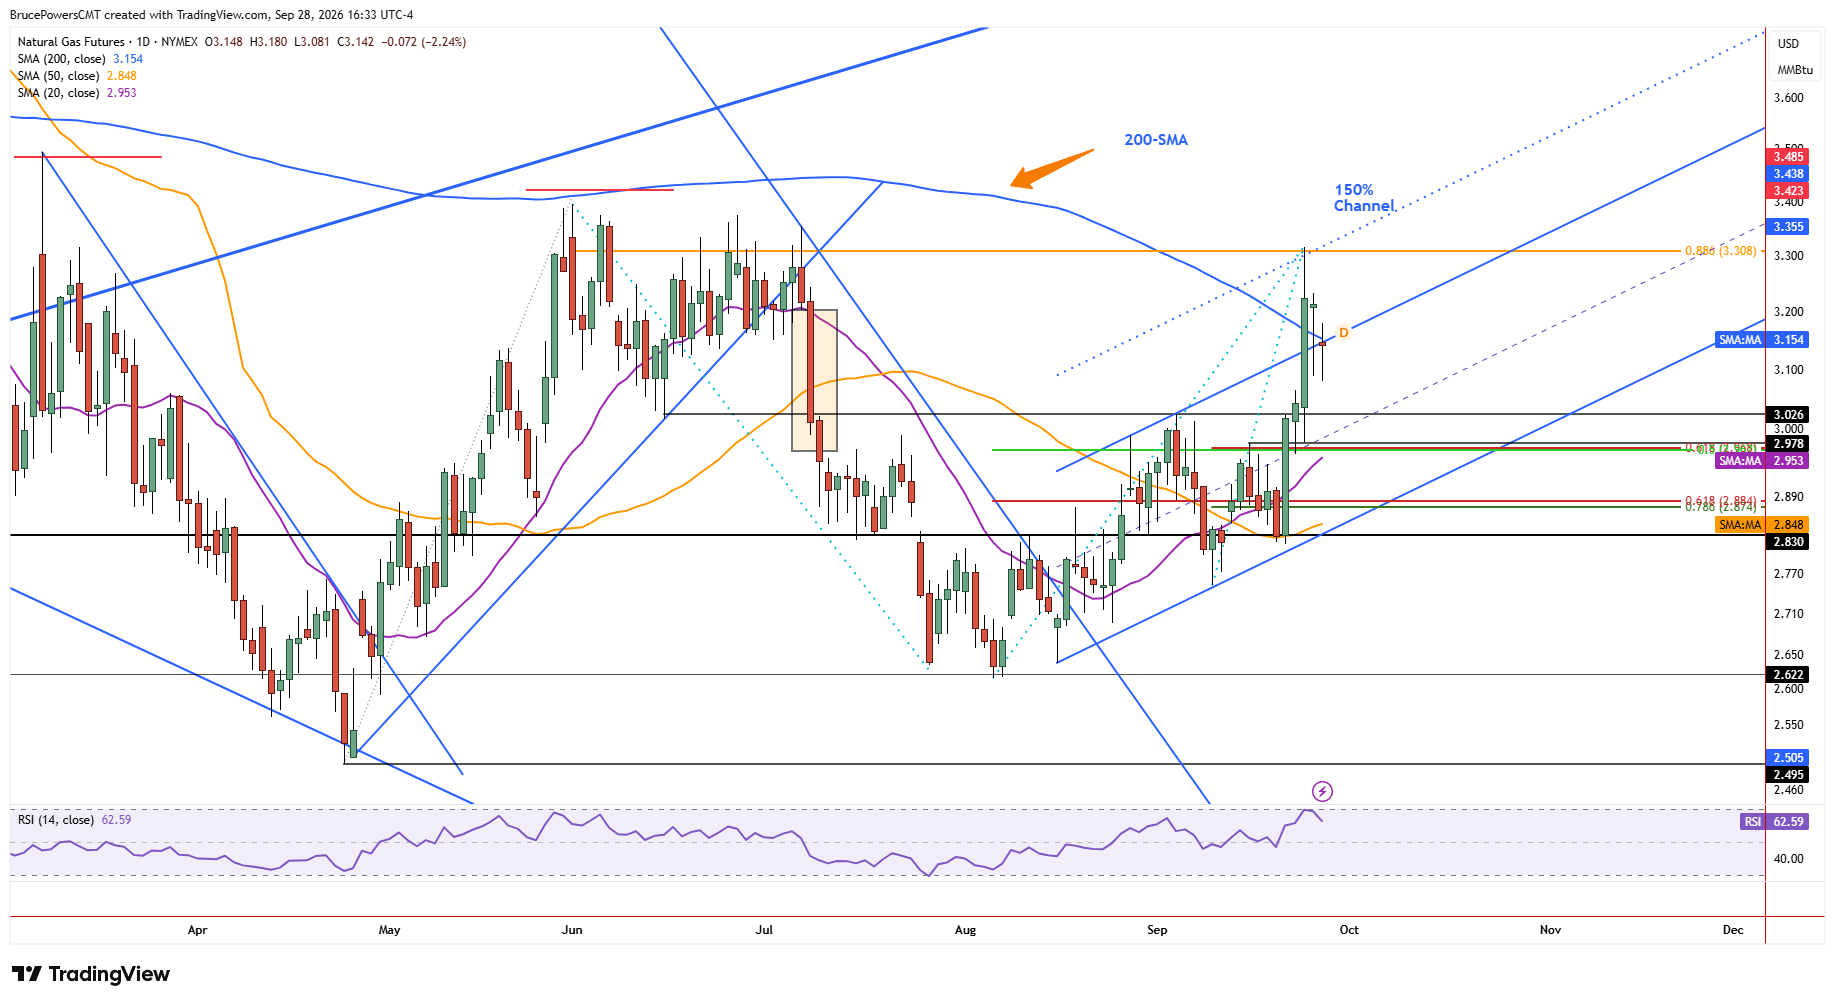
Natural gas pulled back from last week’s peak of $3.32 on Monday, reaching a three-day low of $3.08 and falling back below the 200-day moving average. The decline followed last week’s sharp advance and, with the November contract rollover occurring, suggests that last week’s high may have completed an upside target for now. The failure to sustain support at the convergence of the 200-day moving average and the projected boundary of a rising channel indicates that sellers have regaining near-term control, increasing the potential for a deeper pullback toward lower support levels.

Support Levels Come Into Focus
The first area to watch for signs of support is near the prior swing high at $3.03, followed by $2.98, which was a recent interim swing high. Dynamic support represented by the rising 20-day moving average is near $2.95 as well. It has not yet been confirmed as support since price move away from it during last week’s sharp advance, but if it is reinforced by another technical indicator, the confluence would add to the bullish evidence.
However, the 50-day moving average, near $2.85 and rising, was identified as support during the most recent pullback that generated an interim higher swing low three weeks ago. It therefore remains an important dynamic support level for the intermediate trend and could again attracts buyers if approached.
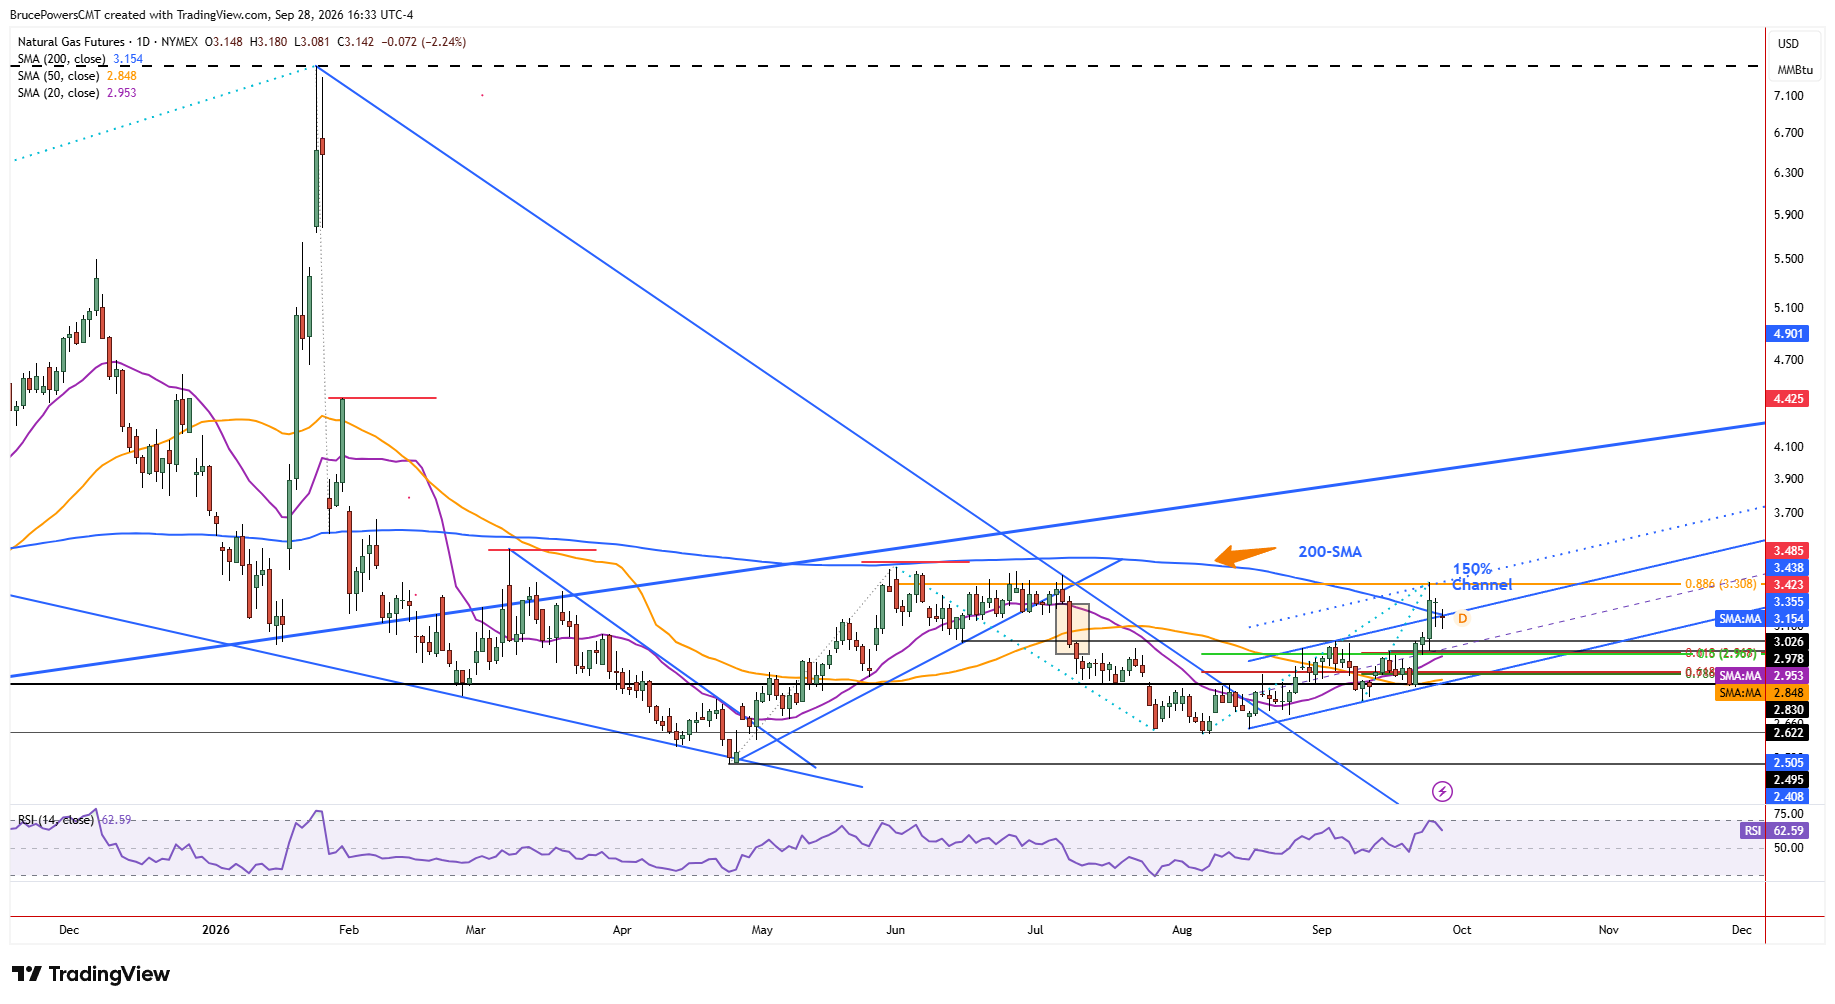
During the recent advance strength was indicated by the reclaim of the 200-day moving average, with two daily closes above it. A deeper correctio could therefore set the stage for another, potentially more successful attempt to sustain a move above the 200-day moving average. Since last week covered a relatively wide range from $2.817 to $3.317, this week’s price action is likely to remain within that range. Such consolidation would leave room for a deeper pullback than has occurred so far while keeping the broader advance intact.
Pullback Could Reset Next Advance
Following a pullback and test of potential support areas, natural gas may develop another advance if support near the 50-day moving average holds. The lower boundary of the rising trend channel can provide additional guidance during the correction. Thus, while sellers have regained near-term control following the failure at the 200-day moving average, the pullback may ultimately provide the next test of support needed to determine whether the broader advance can resume.
Natural Gas Price Forecast
Every new Natural Gas analysis as it publishes, today's technical signal and key levels, live price — on one page.
See all Natural Gas forecastsIf you’d like to know more about how to trade natural gas, please visit our educational area.