


Silver Reaches a Long-Term Value Zone as Sellers Test the 50% Level
Spot Silver (XAGUSD) is sitting near its low of the session shortly before the New York opening Monday. Sellers took it through the 50-day moving average and kept going, knocking out one support level after another before the selling stopped just short of the 50% retracement of the all-time high.
I’m not ready to call a bottom. Sellers have been in charge since the failed rally at the main top, and whether buyers defend the 50% level is the question for the rest of the session and into Tuesday.
At 13:25 GMT, Spot Silver is trading at $61.27, down $3.04 or -4.72%. It traded as low as $60.95.

Daily Spot Silver (XAGUSD) Technical Analysis
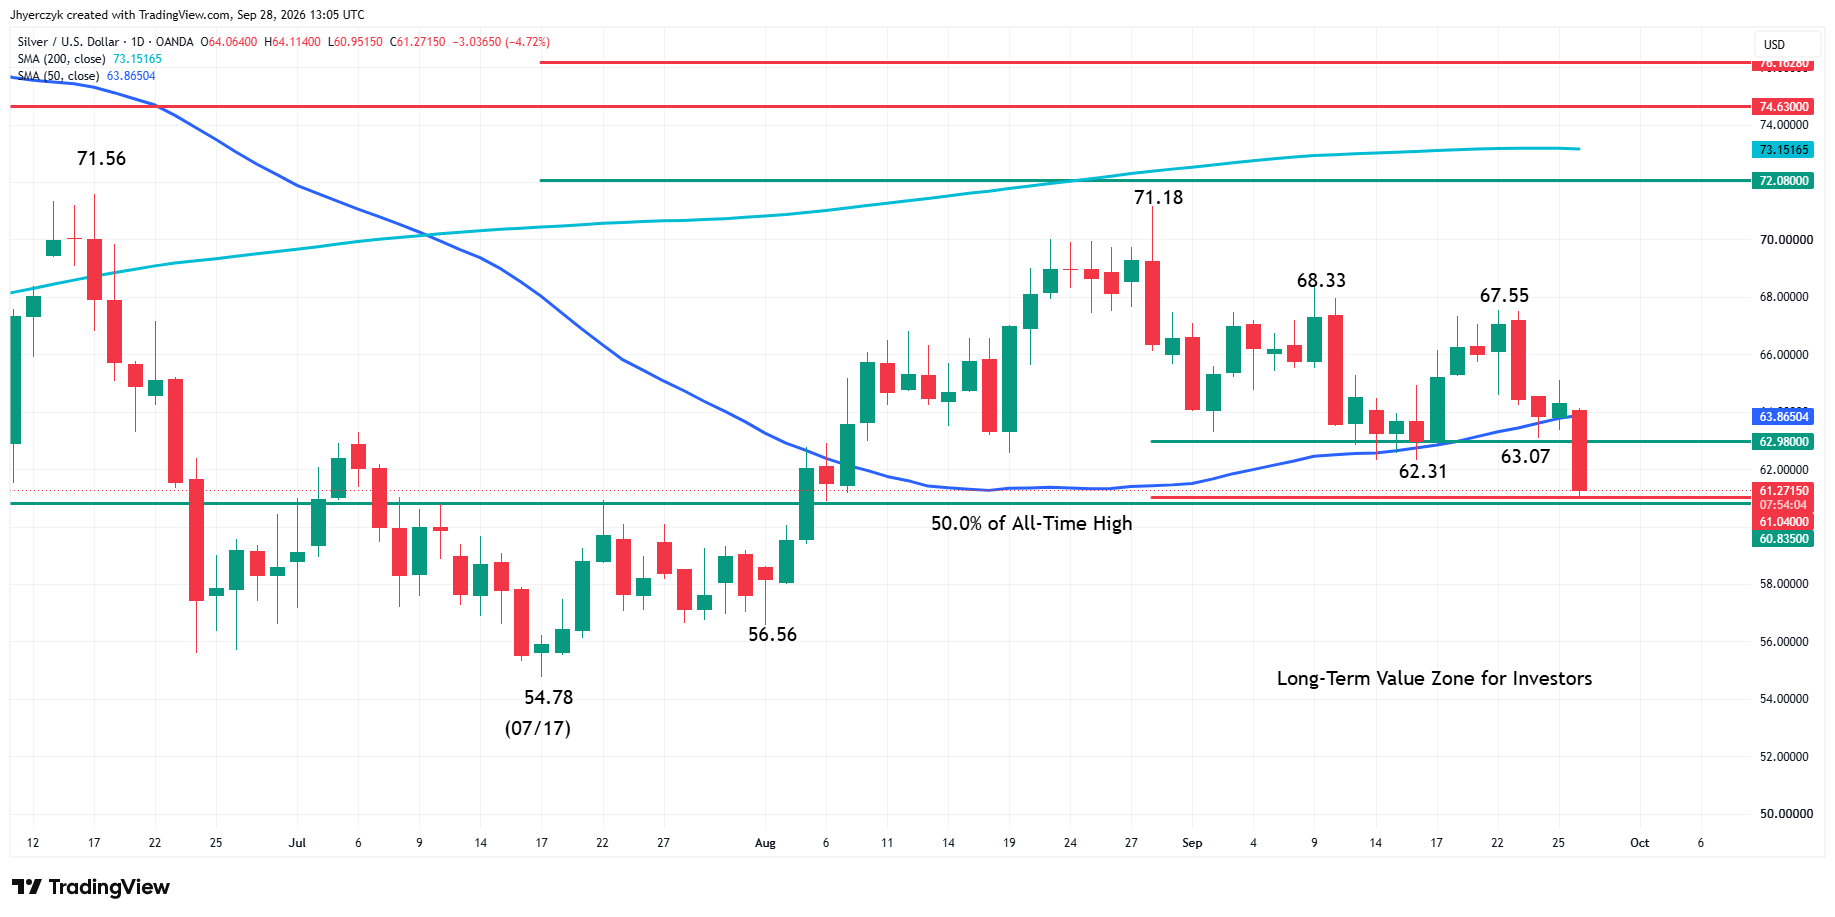
Spot Silver broke sharply lower Monday after failing to hold the 50-day moving average at $63.87. The move also took out the minor bottom at $62.31, signaling a resumption of the downtrend.
The main trend is down according to the daily swing chart. A trade through $67.55 will change the main trend to up. Monday’s low at $60.95 is now the downside trigger. A trade through that price will put the 50% level at $60.84 to the test.
The retracement zone at $62.98 to $61.04 was support. The market is trading below it, turning the zone into resistance. The 50-day moving average at $63.87 is controlling the short-term direction. The 200-day moving average at $73.15 is controlling the long-term direction.
The Buyers Have a Price, but They Still Need to Take the Offers
Silver got within 11 cents of the 50% level of its all-time high Monday. To get there, it gave back more than half of the rally from the July bottom at $54.78 to the $71.56 high. The midpoint of that swing is $63.17, and silver went right through it on the way down. For long-term investors looking for value, this is the first clear price on the chart.
Silver Price Forecast
Every new Silver analysis as it publishes, today's technical signal and key levels, live price — on one page.
See all Silver forecastsThe buying so far has been passive. Silver is holding a narrow range just above the low, and bids resting under $61.00 won’t turn the market by themselves. The sellers have to run out of offers first.
The second rally matters more than the first, because that’s where traders find out whether silver can get back over the broken support levels and stay there. Until it does, the 50% level looks like one more stop on the way down.
Silver Is Paying for Higher Oil Through the Rate Trade
Oil was up Monday after President Trump rejected Iran’s offer to end the conflict and reopen the Strait of Hormuz. For silver, that headline meant firmer inflation expectations and a Fed with more reason to hike.
Traders are pricing a 70.3% chance of an October hike, and crude moving higher adds to it. Gold is under the same pressure. Silver fell harder because it had more to lose on the chart, giving up the 50-day moving average and several support levels in a short stretch.
At these prices the risk-reward is getting better, and it may take fresh selling to push silver much lower. Monday’s trade is about the Fed, though. The value buyers can afford to wait for the data.
Treasury Yields Set the Pace for Silver’s Slide
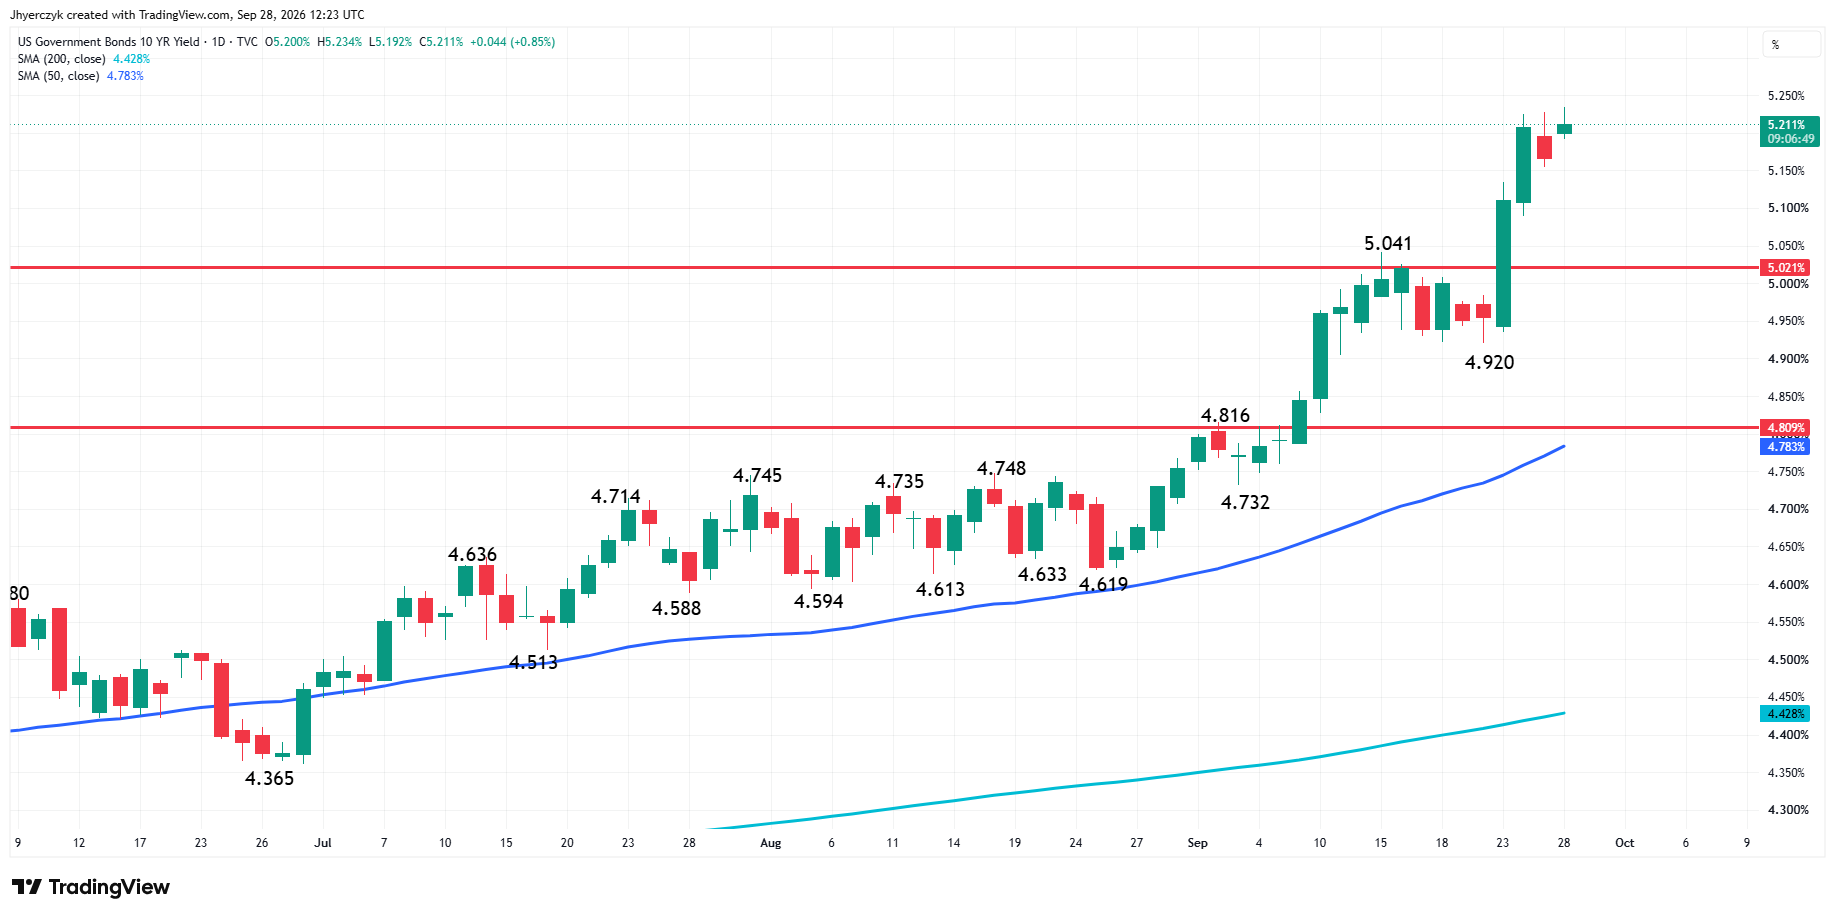
The 10-Year U.S. Treasury yield was back over 5.20% Monday, a week after its highest level since 2007, and silver has been trading lower as yields push up. The 30-year was near 5.53% and the two-year was moving toward 4.92%. None of that curve is moving in silver’s favor. As long as yields keep climbing, silver buyers are fighting the bond market as well as the sellers on the chart.
The Dollar Index is holding above 101 Monday after its best month since June. Silver is trying to find support with both of those working against it at the same time.
A short-covering bounce off the 50% level wouldn’t take much. Anything longer is probably going to need yields backing away from their highs or the dollar losing momentum.
The Data Has to Break the Rate Trade for Silver to Recover
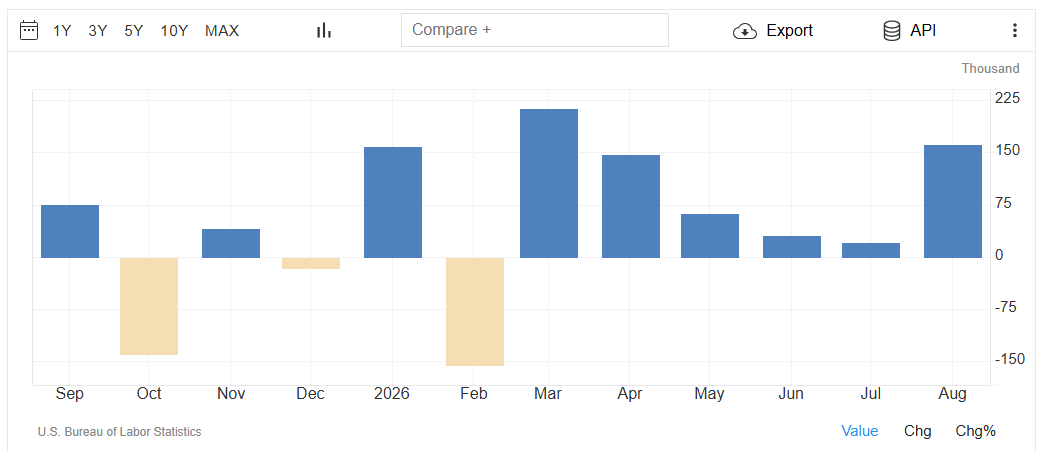
Silver buyers are heading into a week of jobs and inflation data with the 50% level already under pressure. The Job Openings and Labor Turnover Survey (JOLTS) is out Tuesday, ADP employment data and the Personal Consumption Expenditures (PCE) reports come Wednesday, and the payrolls report on Friday is the bigger event. JOLTS and ADP come first and can shift the mood early, but payrolls is where the October odds face their biggest test.
A hot PCE reading or firm payrolls number would add to the October hike odds, and that’s the fastest way for sellers to take out Monday’s low.
What to Watch
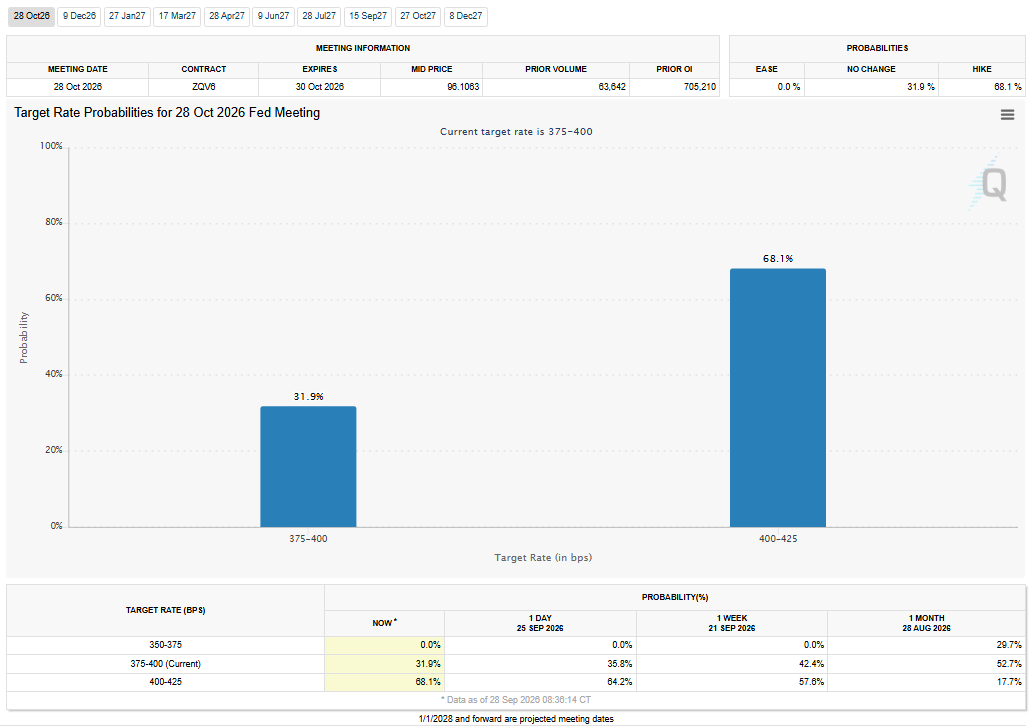
The October hike odds are what silver has to get past this week, and Wednesday’s PCE reports are the first chance to move them. Buyers need soft data that pulls the 10-Year back from last week’s high and cools the dollar. Payrolls on Friday carries more weight, and silver needs to be holding the 50% level when that report hits.
Crude is the other input this week. Any Iran headline that sends oil higher again adds to the rate pressure before the data even hits.
Sellers have control while silver trades below $62.98 and the 50-day moving average at $63.87. The 50% level at $60.84 is the first place where buyers have a reason to show up, but a sustained move below it would weaken the long-term picture and expose lower support.
A close back above $61.04 puts silver back inside the retracement zone. The next test for buyers is the broken minor bottom at $62.31, followed by $62.98. Monday’s low at $60.95 is the first downside trigger.
More Information in our Economic Calendar.



