
Oil, Yields and the Dollar Break Gold Support
Spot Gold (XAUUSD) broke through its 61.8% support level Monday and fell to its lowest price since August 5. Oil moved higher, Treasury yields added to their rally and the dollar held near a two-month high. That’s three separate pressures on gold in the same session.
The Middle East conflict isn’t bringing in buyers looking for protection. With oil lifting inflation fears, traders are focused on what higher energy prices mean for the Federal Reserve, and right now that means more rate hikes.
At 12:15 GMT, Spot Gold is trading at $4,164.27, down $120.71 or -2.82%. It traded as low as $4,140.78.

Daily Spot Gold (XAUUSD) Technical Analysis
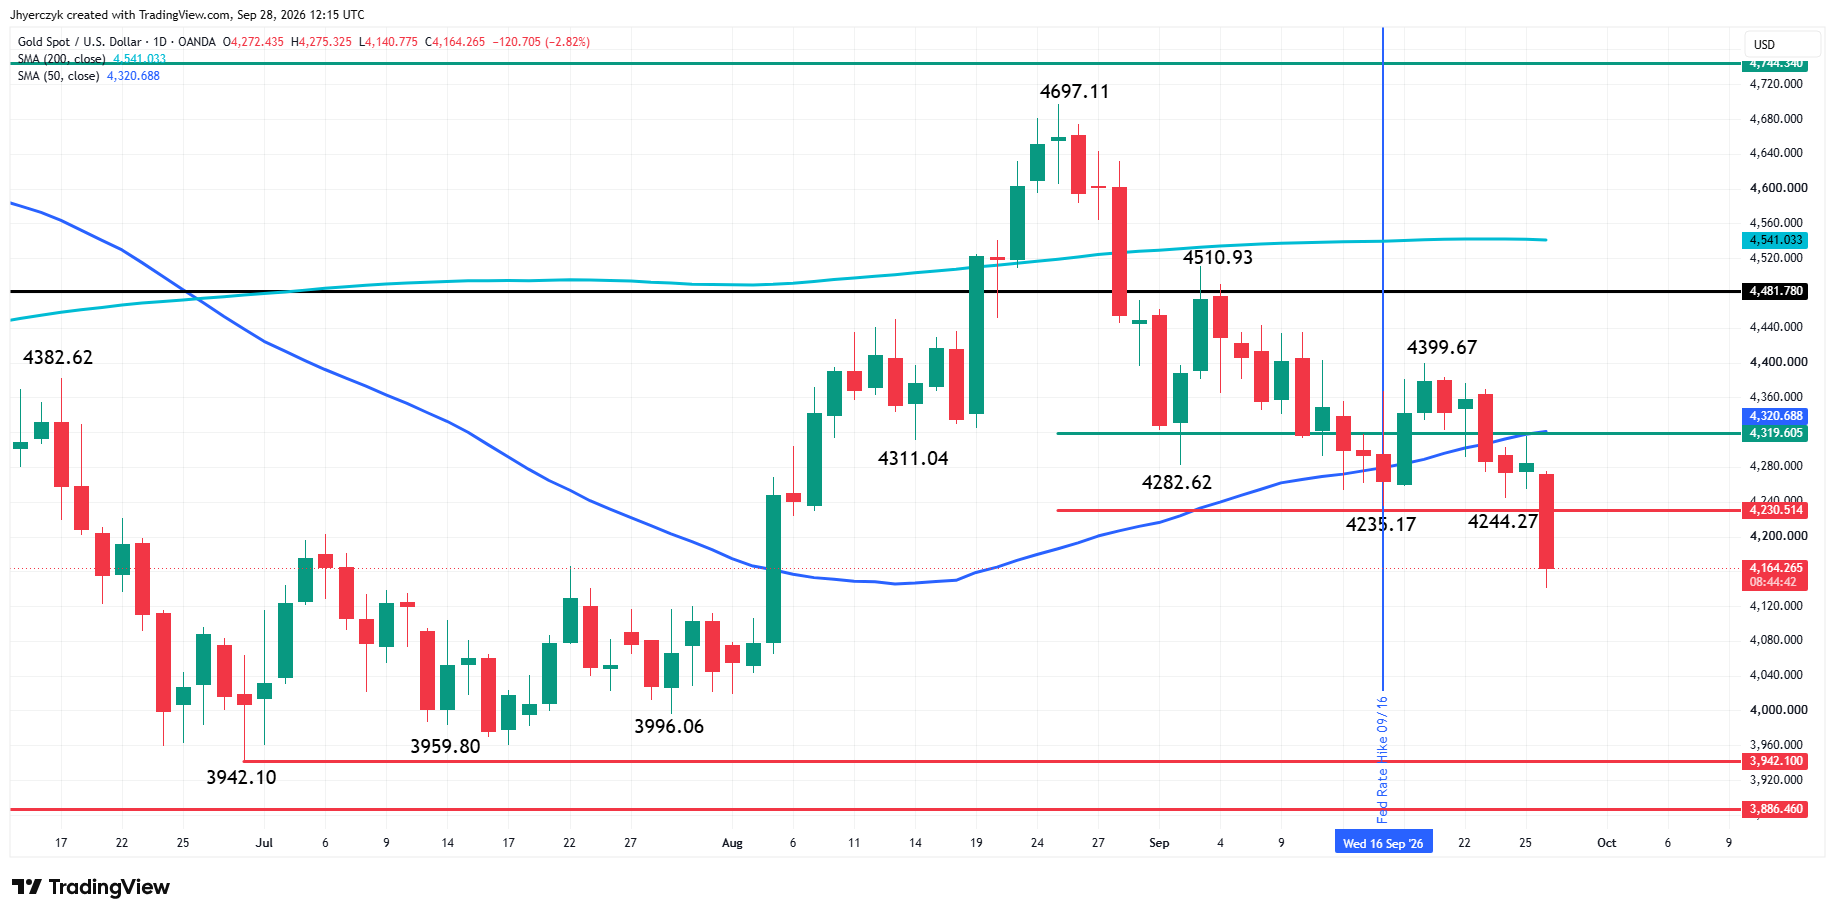
Spot Gold turned sharply lower Monday after breaking through the 61.8% level at $4,230.51. This level had been acting as major support. The break puts sellers in control and turns $4,230.51 into the first resistance level.
The main trend is down according to the daily swing chart. A trade through $4,399.67 will change the main trend to up. A move through Monday’s low at $4,140.78 will signal a resumption of the downtrend.
The next major downside target is the August swing bottom at $3,996.06, followed by the main bottom at $3,942.10.
The 50-day moving average at $4,320.69 is controlling the short-term direction. The 200-day moving average at $4,541.03 is controlling the longer-term direction. Gold is trading below both indicators.
My bias is to the downside. A recovery above $4,230.51 would be the first sign that buyers are fighting back, but they need to reclaim the 50-day moving average at $4,320.69 to weaken the bearish momentum.
Gold Price Forecast
Every new Gold analysis as it publishes, today's technical signal and key levels, live price — on one page.
See all Gold forecastsHigher Oil Prices Are Working Against Gold
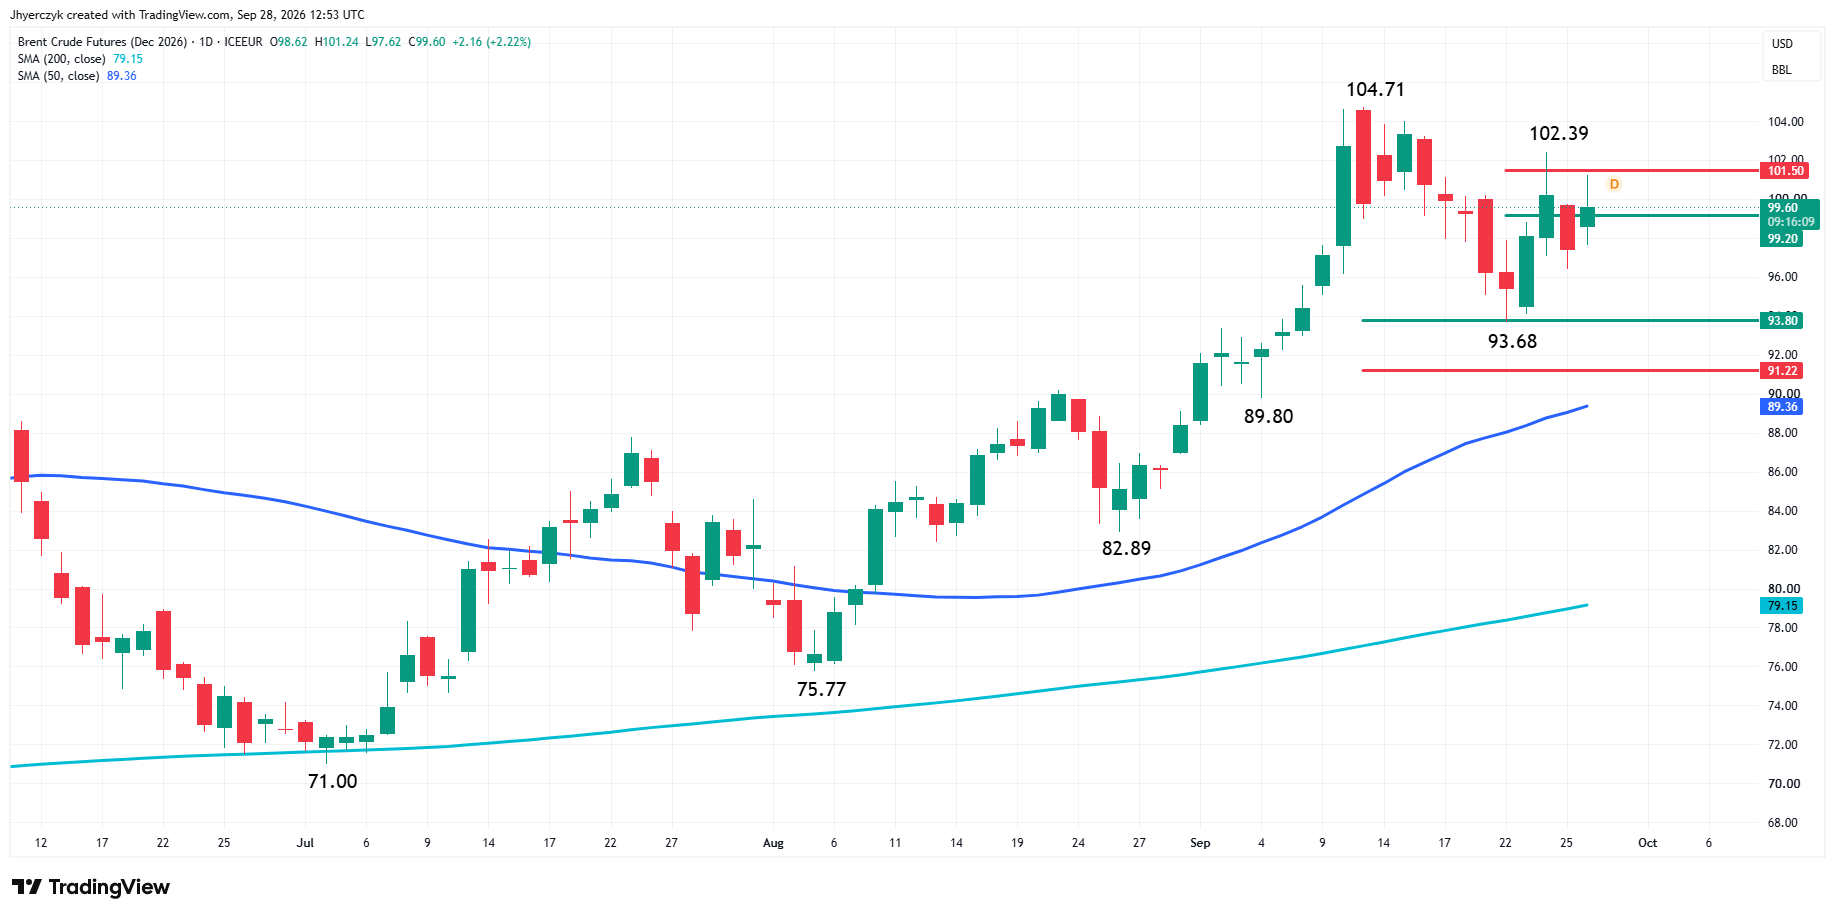
Brent crude oil bounced back Monday after President Trump turned down Iran’s proposal to end the conflict and reopen the Strait of Hormuz. Supply risk is back in energy prices, inflation is back at the center of the trade, and gold is lower on the same headline.
The market is reading the Iran story as an inflation trade, and gold isn’t getting a flight-to-safety bid out of it. Crude up and gold down on the same Monday morning tells you which story the metal is trading. As long as crude is climbing on Hormuz risk, the war headlines are working against gold.
Higher oil adds to a rate outlook that was already leaning toward more tightening. The Fed raised rates earlier this month and signaled more increases are likely, and traders now see a 70.3% chance of another hike in October. Those odds are what gold is trading against right now.
Rising Yields at Home and Abroad Are Pressuring Gold
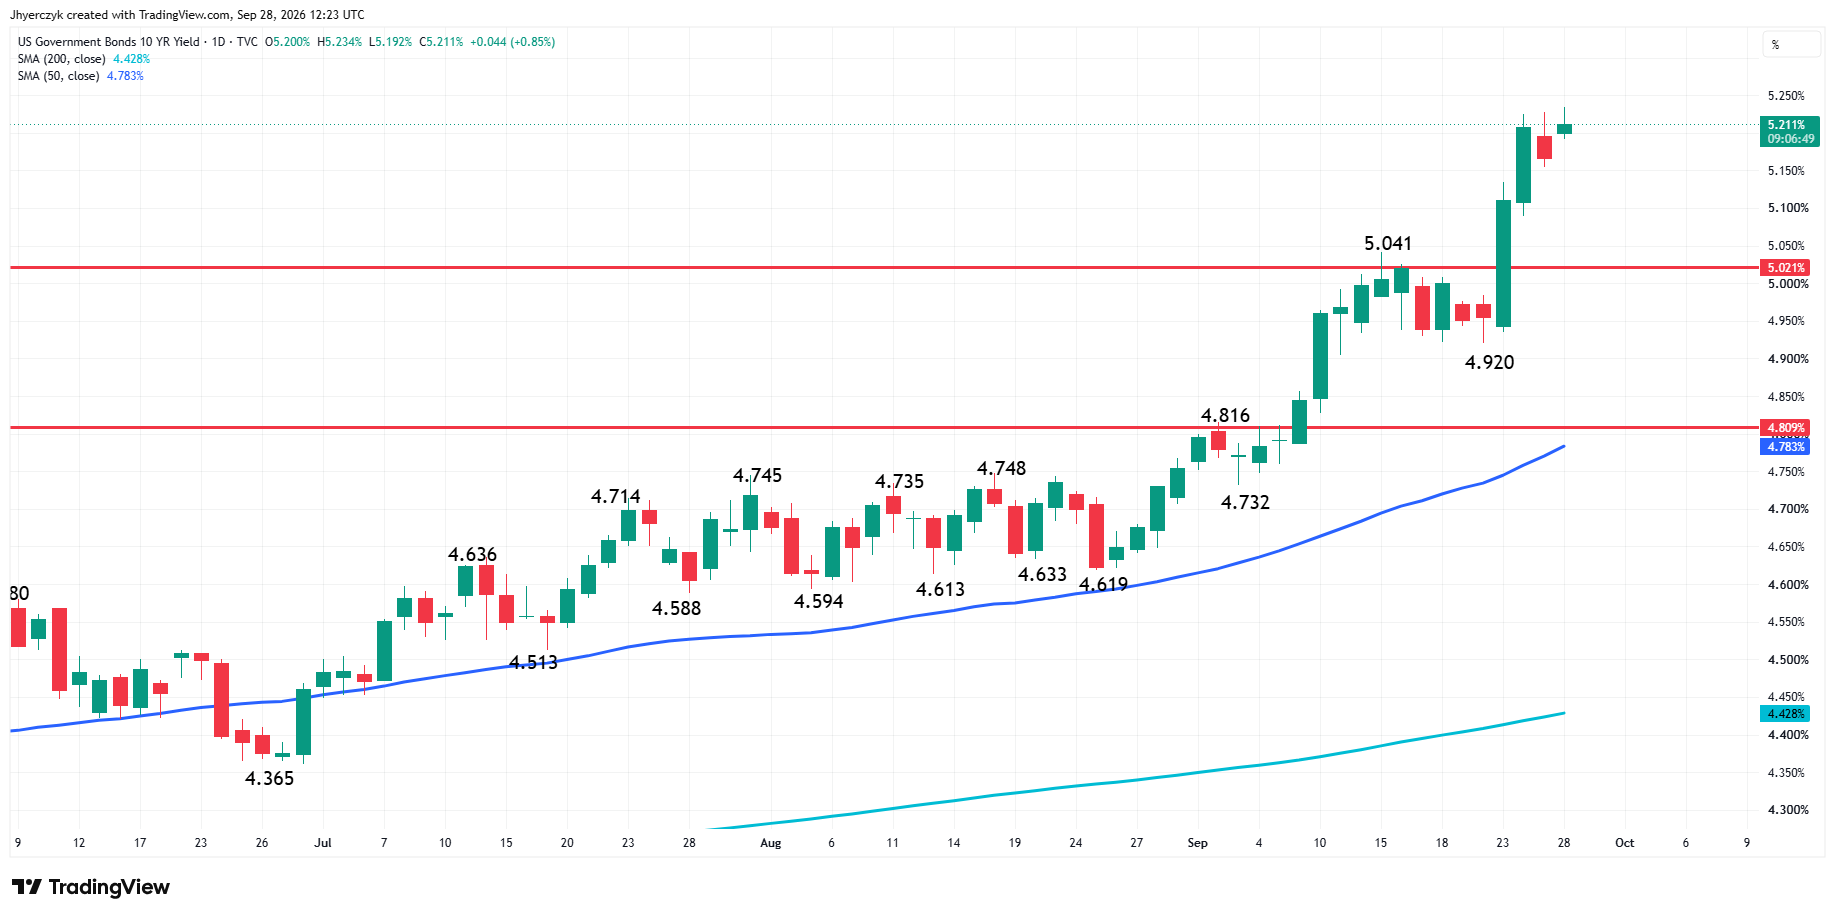
The 10-Year U.S. Treasury yield rose above 5.20% Monday after reaching its highest level since 2007 last week. The 30-year was near 5.53% and the two-year was moving toward 4.92%. With the whole curve moving higher, the bond market isn’t showing any sign it expects inflation pressure to fade quickly.
Other bond markets sold off too. U.K. gilt yields moved higher, German Bund yields stayed elevated and Japanese government bond yields rose as well. Investors want more to hold long-term government debt in all three markets, which is the same message Treasuries are sending.
Gold buyers are up against a global rate trade. That’s a much harder fight than a move in U.S. yields alone.
The Dollar Rally Has Not Run Out of Reasons
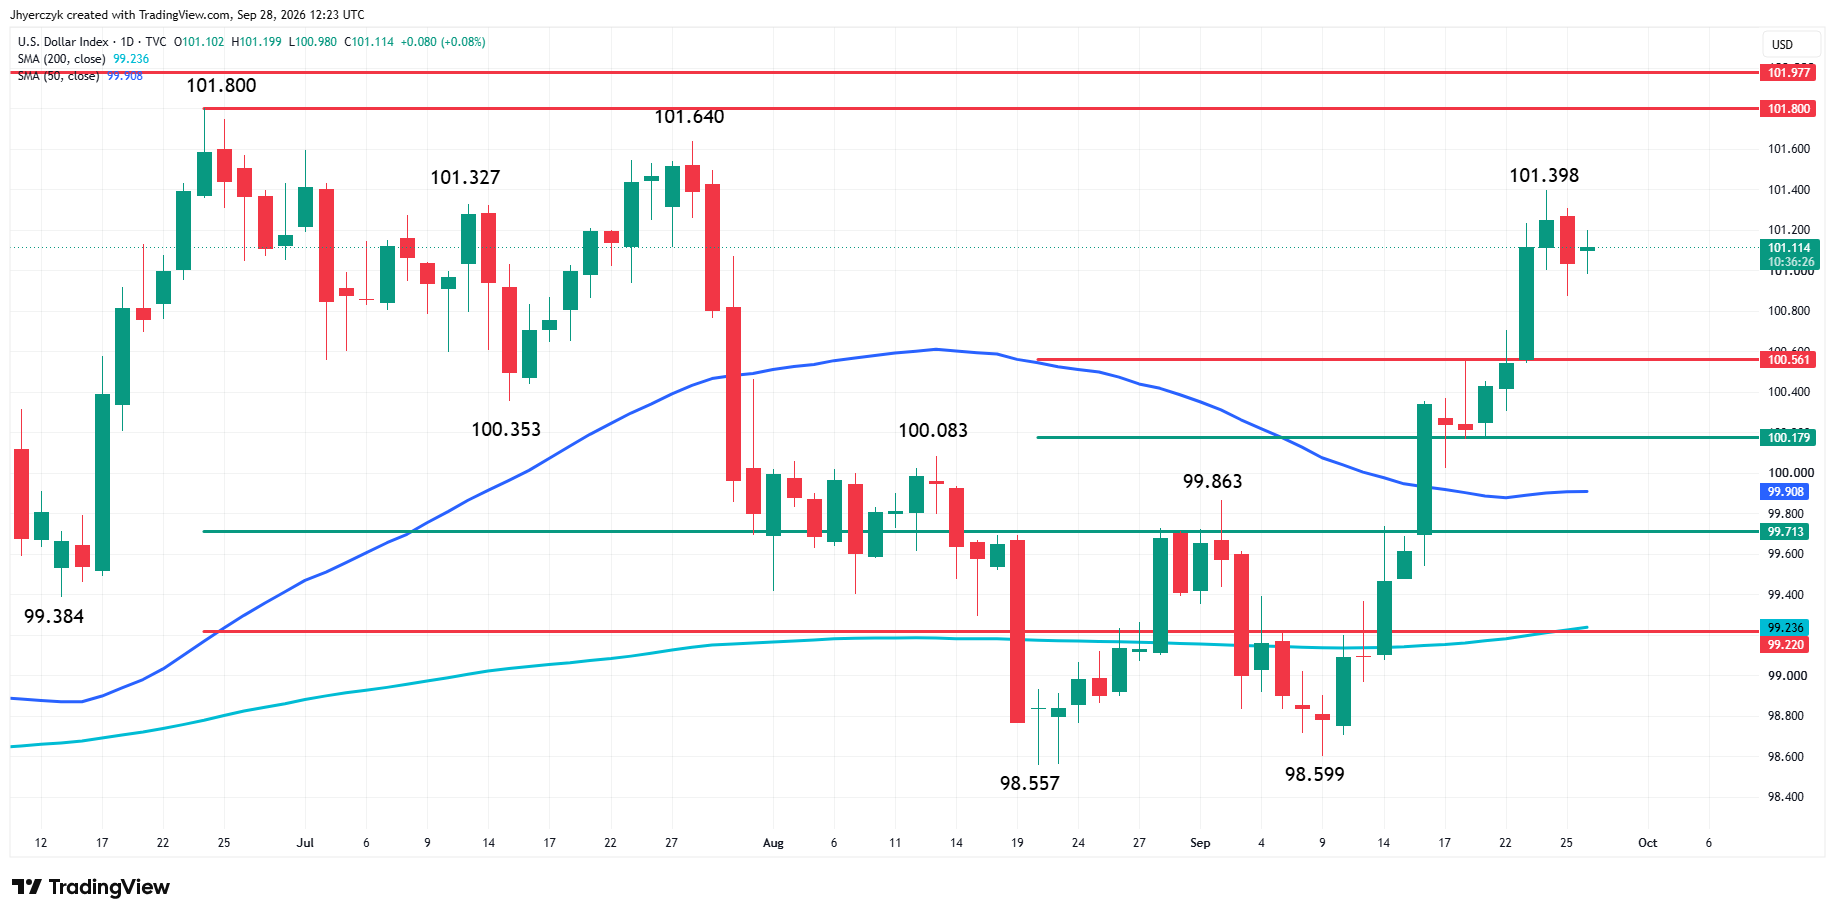
The Dollar Index held above 101 Monday after its strongest monthly gain since June. Traders see the U.S. economy, oil prices and the Fed all moving in the same direction, and they’re buying the dollar on it. That’s a lot of momentum behind it heading into a heavy data week.
The euro is near a two-month low and sterling is close to its recent three-month low. That leaves gold without help from the other side of the currency market.
The September run could leave the dollar trade crowded. A soft PCE report or weaker payrolls number could set off profit-taking. Traders aren’t doing that Monday. They’re still buying the dollar on higher yields and a stronger case for another Fed hike.
The Dollar Index is on the strong side of its recent breakout as long as it holds over 100.56. The September top at 101.40 is the next upside level, followed by 101.80 and 101.98. Those levels matter as much to gold traders this week as anything on the gold chart. I don’t see gold stabilizing if the dollar starts taking out those highs.
PCE and Payrolls Are the Next Test
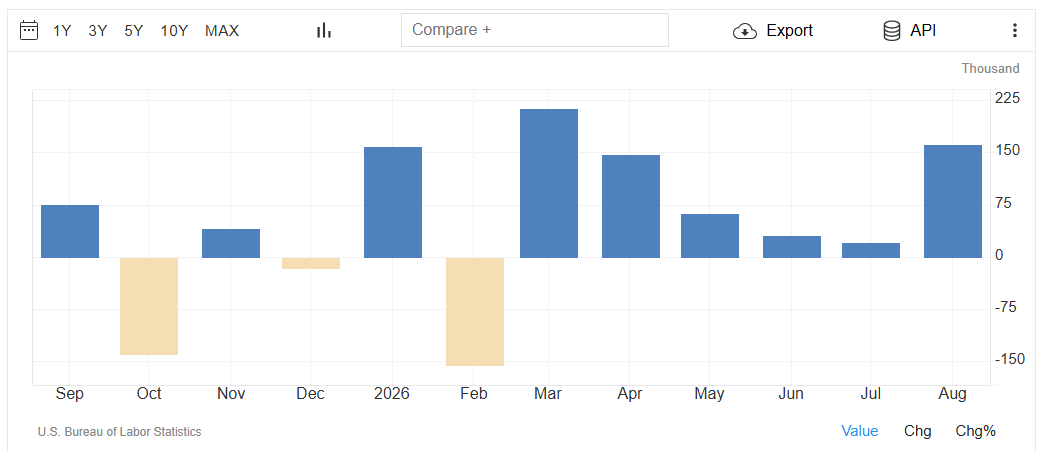
Gold sellers get four more chances this week to push the rate trade. The Job Openings and Labor Turnover Survey (JOLTS) is out Tuesday, ADP employment data and the Personal Consumption Expenditures (PCE) reports come Wednesday, and Friday’s nonfarm payrolls report closes the week. JOLTS and ADP will get a reaction, but the bigger tests come later in the week.
PCE and payrolls carry the most weight because they can move the October hike odds. A hot PCE number or firm payrolls report pushes those odds higher and gives sellers another reason to press gold.
Softer reports could bring profit-taking in Treasury yields and the dollar. Buyers would still have to show up first, and it will take more than one weak report to repair the technical damage from Monday’s break.
What to Watch
Gold needs oil, yields or the dollar to turn before it can build a meaningful recovery, and Brent is the first one to watch. With the Iran proposal rejected, there’s no deal to take the supply risk back out of crude, and higher oil keeps pressure on the October hike odds.
Wednesday’s PCE reports and Friday’s payrolls are the best chance for relief. Gold needs one of them to come in soft enough to pull yields off their highs and cool the dollar.
The Dollar Index is the third piece. It’s holding above its breakout level, and a push toward the September top would put more weight on gold heading into the reports.
Sellers have control while gold trades under the broken 61.8% level. Monday’s low at $4,140.78 is the next trigger, and the August swing bottom at $3,996.06 sits below that. The tone of the market will be determined by trader reaction to $4,230.51.
If you’d like to know more about how to trade gold, please visit our educational area.