
SP500 Moves Lower As Treasury Yields Test New Highs
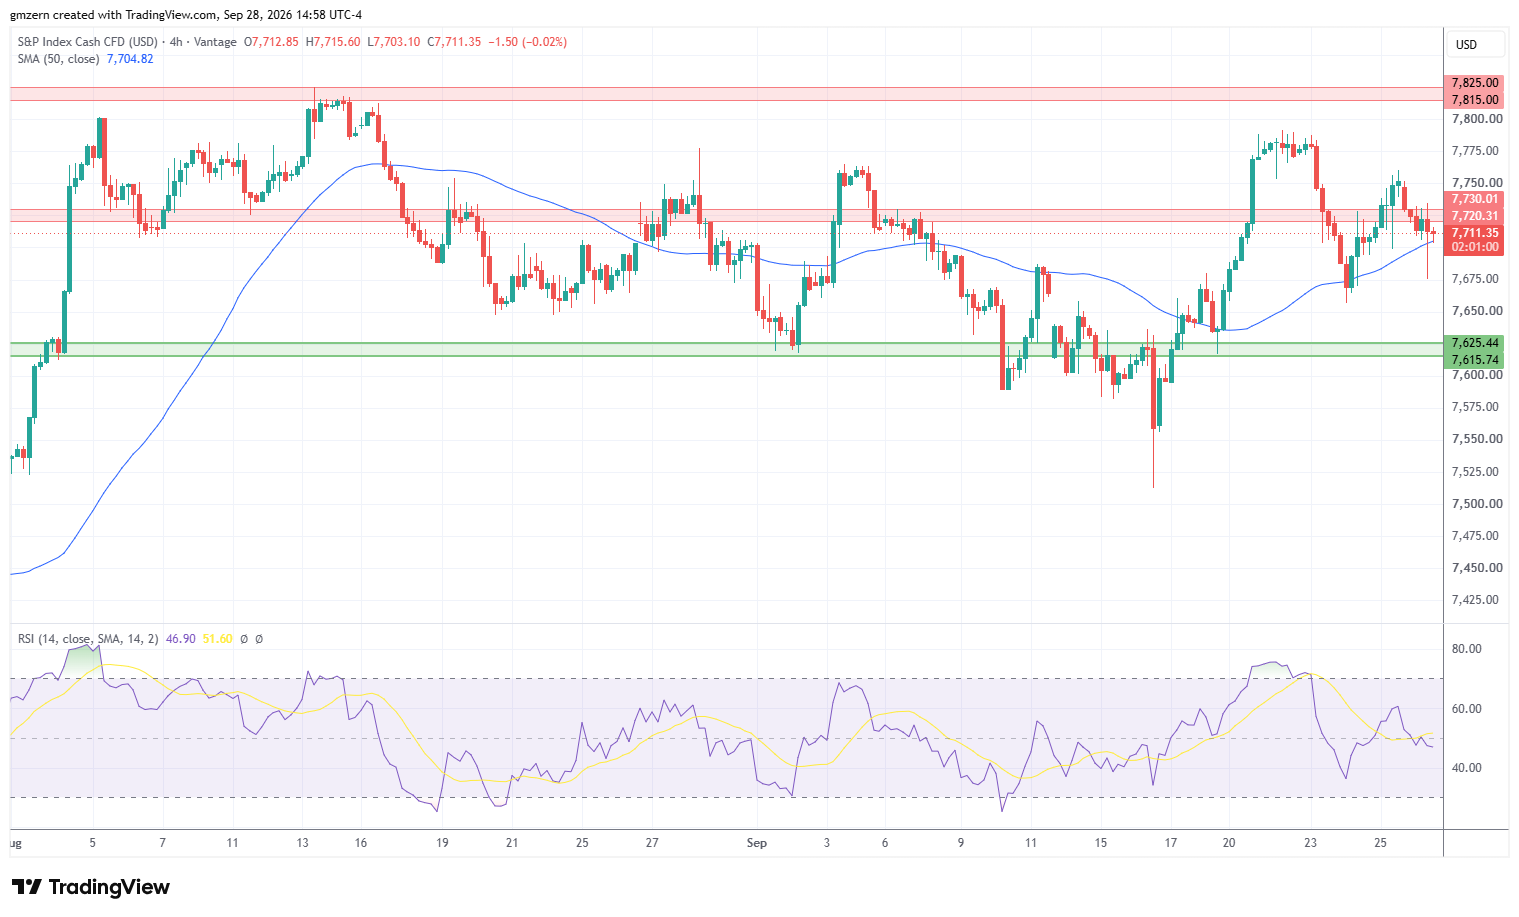
SP500 is losing ground as traders focus on the strong sell-off in bond markets, which is driven by inflation worries.
The yield of 2-year Treasuries climbed towards the 4.93% level, while the yield of 10-year Treasuries settled near 5.25%. The yield of 30-year Treasuries tested the 5.58% level, the highest level since 2002.
Traders also focused on developments in the oil markets. Oil prices pulled back from session highs as traders reacted to reports indicating that Trump was ready to ease Iran sanctions if the country demonstrated progress on nuclear issues. Oil traders also focused on the restart of Saudi Arabia’s East-West pipeline, which is used to bypass the Strait of Hormuz.
Traders also had a chance to take a look at the Dallas Fed Manufacturing Index report. The report showed that Dallas Fed Manufacturing Index decreased from 11.6 in August to 9.8 in September, compared to analyst forecast of 1. I’d note that the report did not have a material impact on market dynamics.
Healthcare and consumer defensive stocks were among the biggest gainers in the SP500 index today as demand for safe-haven assets increased. Basic materials stocks found themselves under strong pressure amid strong sell-off in precious metals markets.
Currently, SP500 is trying to settle below the 50 MA at 7704. In case SP500 settles below the 50 MA, it will head towards the nearest support, which is located in the 7615 – 7625 range. On the upside, a move above the resistance at 7720 – 7730 will push SP500 towards the 7780 level.

NASDAQ Pulls Back As 30-Year Yield Tests 5.58%
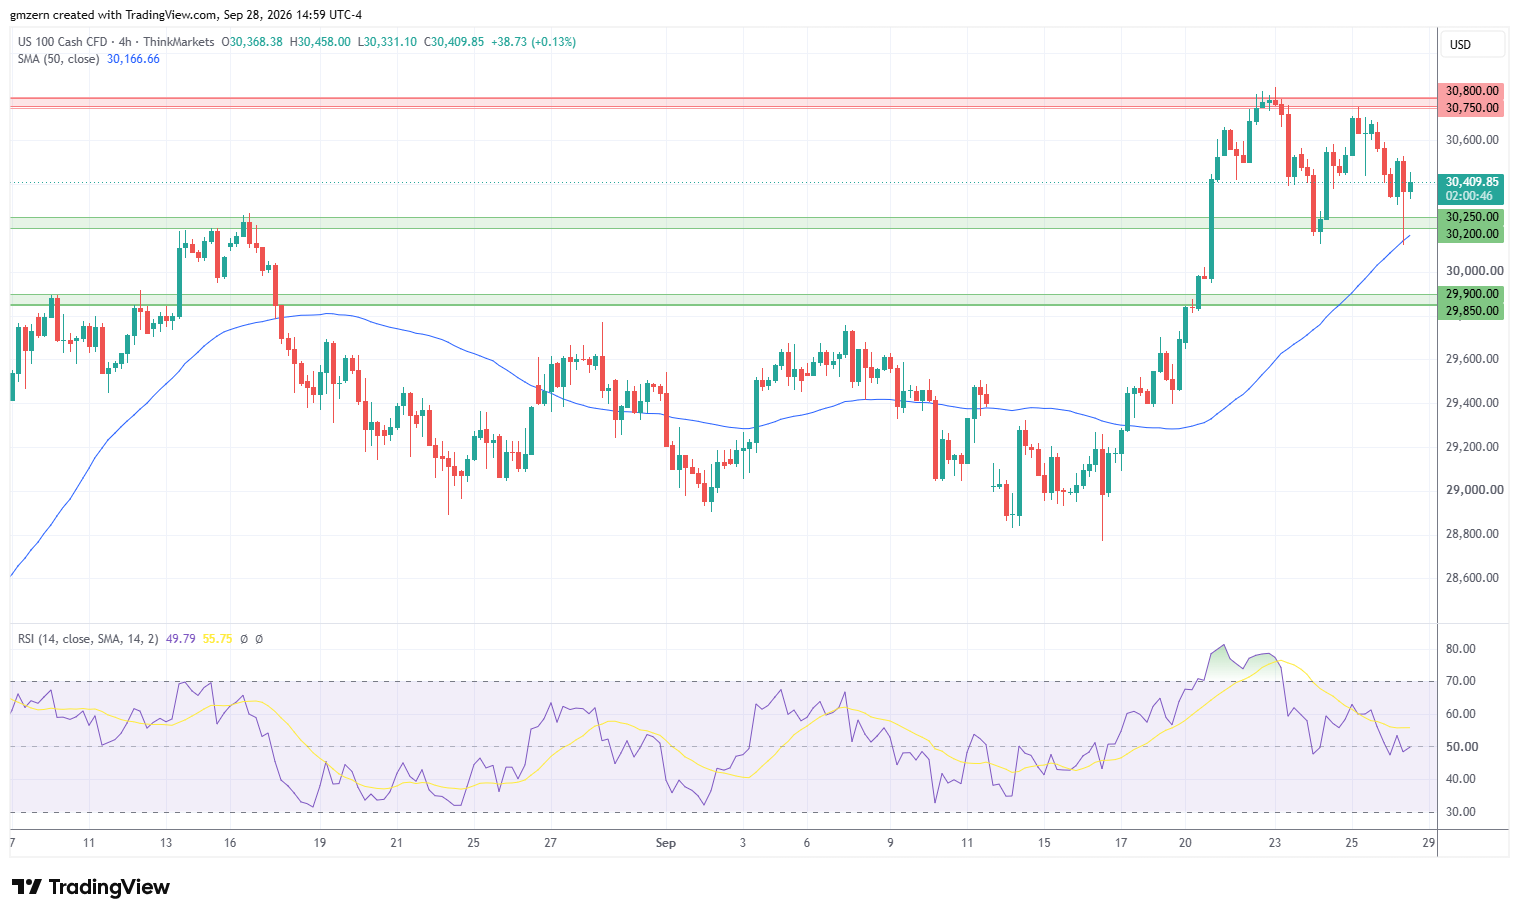
NASDAQ moved lower as traders worried about rising yields. FedWatch Tool indicates that the probability of a rate hike at the meeting in October has increased to 70.3%. Rising interest rates may hurt investors’ appetite for risk, which will be bearish for NASDAQ. Intel, which is down by -6%, is among the worst performers in the NASDAQ index today.
The nearest support level for NASDAQ is located in the 30,200 – 30,250 range. In case NASDAQ declines below the 30,200 level, it will head towards the next support at 29,850 – 29,900. RSI is in the moderate territory, so there is plenty of room to gain momentum in case the right catalysts emerge.
Dow Jones Price Forecast
Every new Dow Jones analysis as it publishes, today's technical signal and key levels, live price — on one page.
See all Dow Jones forecastsDow Jones Moves Lower As Boeing Dives 6.2%
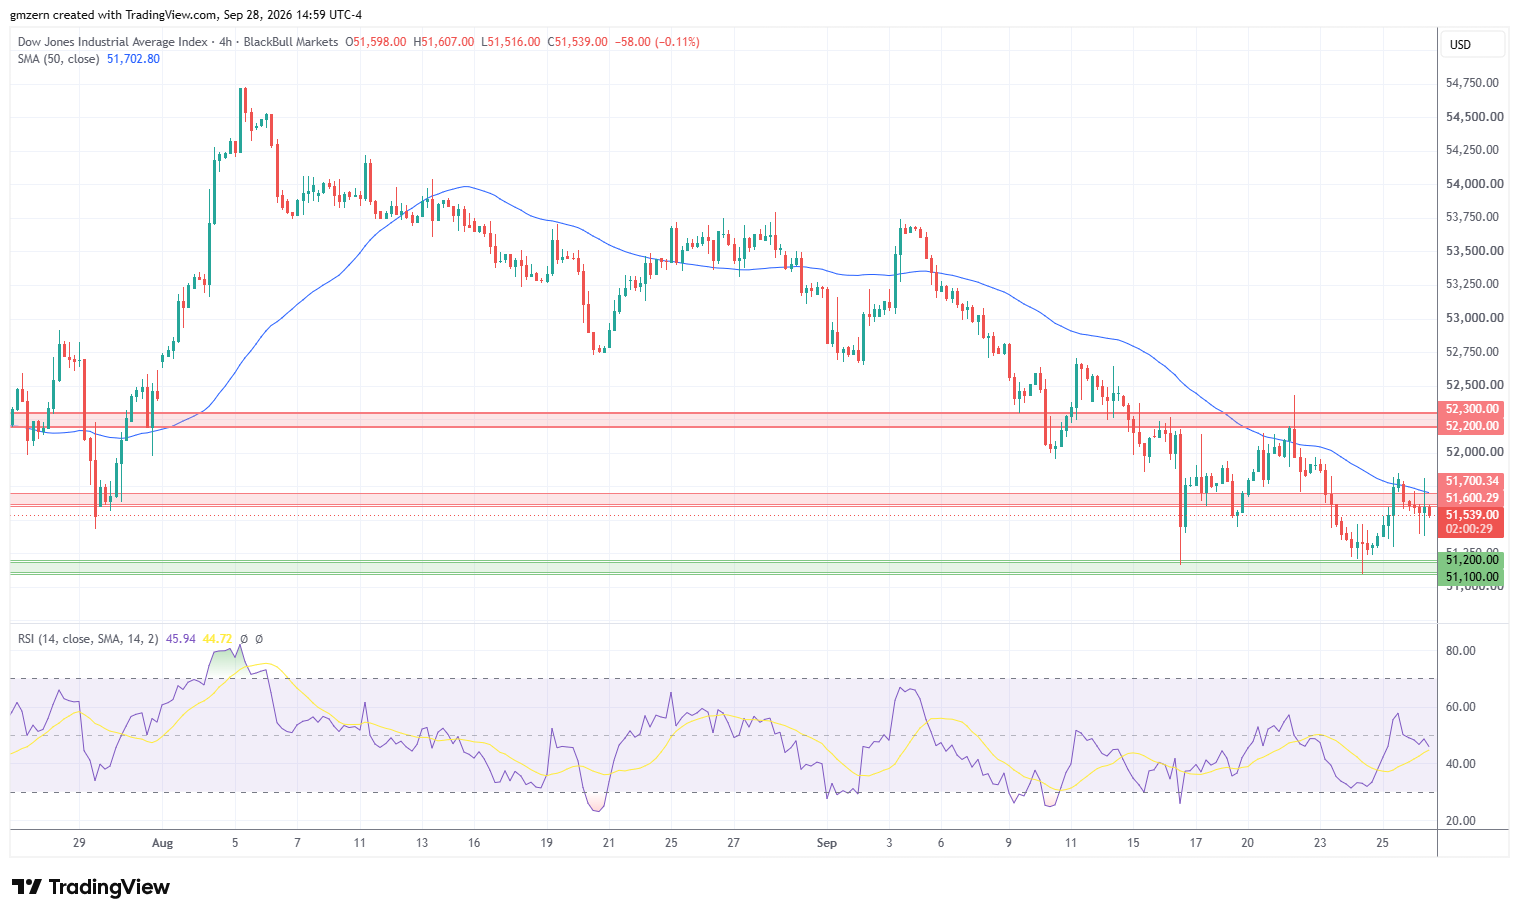
Dow Jones declined amid broad pullback in the equity markets. Boeing, which was down by -6.2%, was the worst performer in the Dow Jones index today. The stock suffered a sell-off amid reports about 737 MAX software issue.
From the technical point of view, Dow Jones has recently made an attempt to settle above the resistance level at 51,600 – 51,700 but lost momentum and pulled back. If Dow Jones settles below the 51,400 level, it will head towards the nearest support, which is located in the 51,100 – 51,200 range.
On the upside, a successful test of the resistance at 51,600 – 51,700 will open the way to the test of the next resistance level at 52,200 – 52,300.
For a look at all of today’s economic events, check out our economic calendar.