



Pipeline Premium Fades as Weather and Expiration Hit November Natural Gas
November natural gas futures gapped lower at the open Monday and are sharply down mid-session, testing the retracement zone of last week’s pipeline rally. Thursday’s high came on a force majeure. Columbia Gas Transmission declared it over a mechanical issue in West Virginia, with 1.8 Bcf per day of transportation capacity at risk.
That premium didn’t make it through the weekend. The company found the leak and expected repairs to be done by Monday. October natural gas futures expire Monday. Longs are using the roll to take money off the table.
At 17:10 GMT, November natural gas futures are trading at $3.107, down $0.118 or -3.66%. The contract traded from $3.097 to $3.167.

Milder Forecasts Left November Natural Gas Without Weather Demand
Updated 6-to-10 and 8-to-14 day forecasts turned milder across the Midwest and East Coast. Early October heating demand came out of the outlook with them. Late-season cooling demand in the South Central and Southeast has been fading. The latest model runs cut it further.
Production Near Record Keeps Sellers Comfortable
Lower-48 dry gas production was 110.6 Bcf per day Friday, according to BNEF. A 0.5% dip from a year earlier barely registers with output sitting that close to record territory.
Baker Hughes reported Friday that the active U.S. natural gas rig count rose by one to 135, a new three-year high. More rigs on top of near-record output is not what the bulls needed to see heading into a soft demand stretch.
The Energy Information Administration expects dry gas production to average a record 111.2 Bcf per day this year.
Natural Gas Price Forecast
Every new Natural Gas analysis as it publishes, today's technical signal and key levels, live price — on one page.
See all Natural Gas forecastsLNG Isn’t Adding Demand When the Market Needs It
Estimated LNG net flows to U.S. export terminals were 18.5 Bcf per day, down 1.6% from the prior week. Feedgas isn’t accelerating, and buyers needed it to with the weather models turning against them.
Lower-48 demand was 69.0 Bcf per day, down 7.9% from a year ago. Demand down that much from last year, with LNG flows flat to lower, leaves buyers very little to work with.
A Light Storage Build Doesn’t Change the Supply Cushion
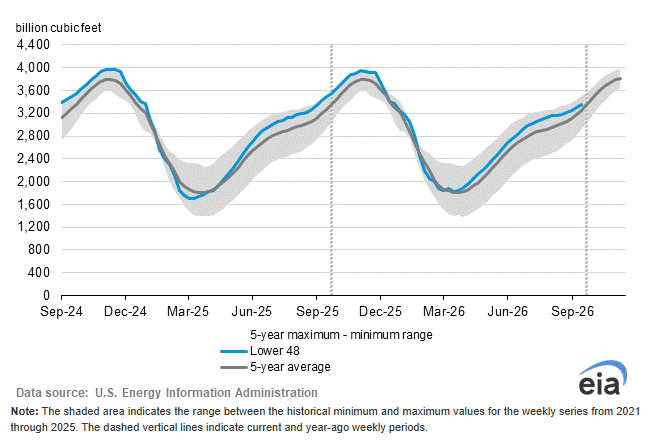
The last EIA report showed a 53 Bcf injection for the week ended September 18, taking working gas in storage to 3,351 Bcf. Inventories were 2.9% above the five-year seasonal average.
Thursday’s report is expected to show a 55 to 65 Bcf build for the week ended September 25. That’s below the late-September five-year average of roughly 75 to 80 Bcf.
The EIA expects end-of-October inventories near 3,985 Bcf, 5% above the five-year average.
Daily November Natural Gas Technical Analysis
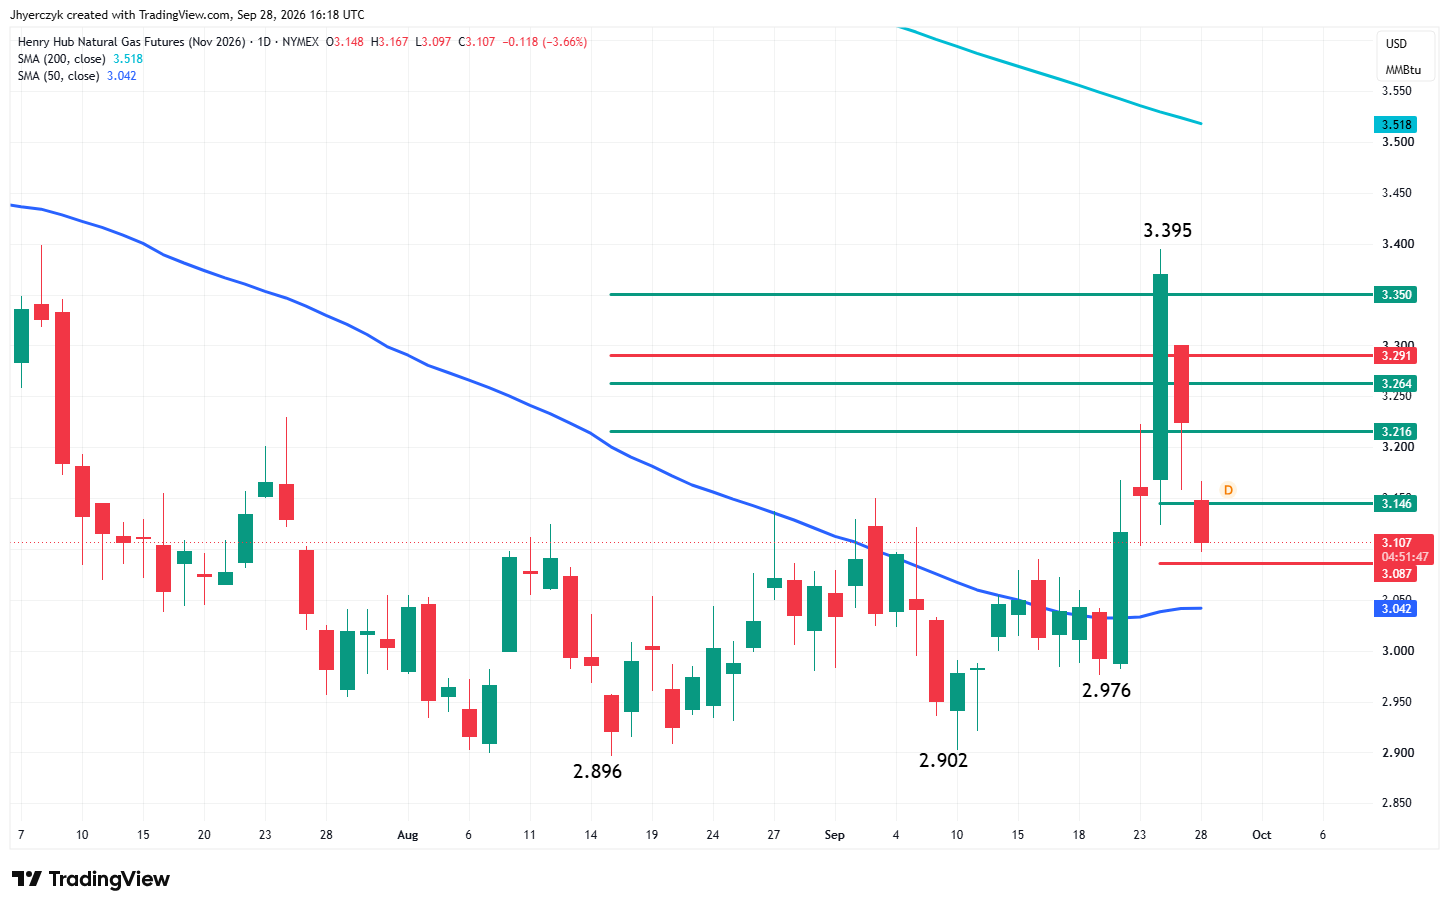
November natural gas futures are trading sharply lower mid-session Monday after gapping lower at the open at $3.148. The main trend is up according to the daily swing chart. A trade through $3.395 will signal a resumption of the uptrend. Taking out $2.976 will change the main trend to down.
The short-term range is $2.896 to $3.395. This marks the range from August 17 to September 24. Natural gas is currently testing its 50% to 61.8% retracement zone at $3.146 to $3.087.
Although the main trend is up, traders face a wall of potential retracement zone levels at $3.216, $3.264, $3.291 and $3.350 before they can even attempt to trigger a breakout over $3.395. But if successful, then the 200-day moving average at $3.518 will come into play.
What to Watch
The repair is the first thing to confirm. Any sign the work ran long keeps the force majeure at the top of the screen.
Thursday’s EIA storage report is the next scheduled event. Going into the release, the weather models are likely to matter more than the number. Buyers also need to take back $3.216 to show Thursday’s breakout was more than a short-covering event.
The main trend is up, but sellers own the near-term trade while November natural gas stays under the 50% level at $3.146. Monday’s low held a penny above the 61.8% level at $3.087. That’s the line buyers have to defend. A break there puts the 50-day moving average at $3.042 in front of the market, with the $2.976 main bottom behind it. Getting back over $3.146 is the first sign buyers are back. The stack of retracement levels starting at $3.216 is waiting above it.
More Information in our Economic Calendar.



