
Oil and Treasury Yields Hit Tech, but Nvidia Bucked the Selling
Stocks are lower shortly after the New York opening Monday with oil and Treasury yields climbing together, and the chip stocks that carried last week’s rally are taking the worst of it. Nvidia is the one big name going the other way after a sharp increase to its buyback.
I don’t see this as investors running from risk. It’s a rate and inflation trade, and the market is taking it out on the stocks that ran the hardest last week.
At 14:11 GMT, the Nasdaq Composite is trading at 26,912.91, down 155.81 points or -0.58%. The iShares Semiconductor ETF (SOXX) is down 2.38% at $559.05. Nvidia is up $5.91, or +2.63%, at $230.98.

Daily Nasdaq Composite Technical Analysis
The Nasdaq Composite is edging lower early Monday after falling below retracement zone resistance at 26,997.47 to 27,066.22. The main trend is up according to the daily swing chart. A trade through 27,288.79 will signal a resumption of the uptrend. The main trend will change to down under 25,802.96.
The minor trend is also up. A trade through 26,876.27 makes 27,122.76 a new minor top. The minor trend will change to down under 26,706.14.
The nearest retracement zone support is 26,545.88 to 26,370.55. This is followed by the 50-day moving average at 26,196.69, which is key support and a trend indicator.
Daily Nvidia Technical Analysis
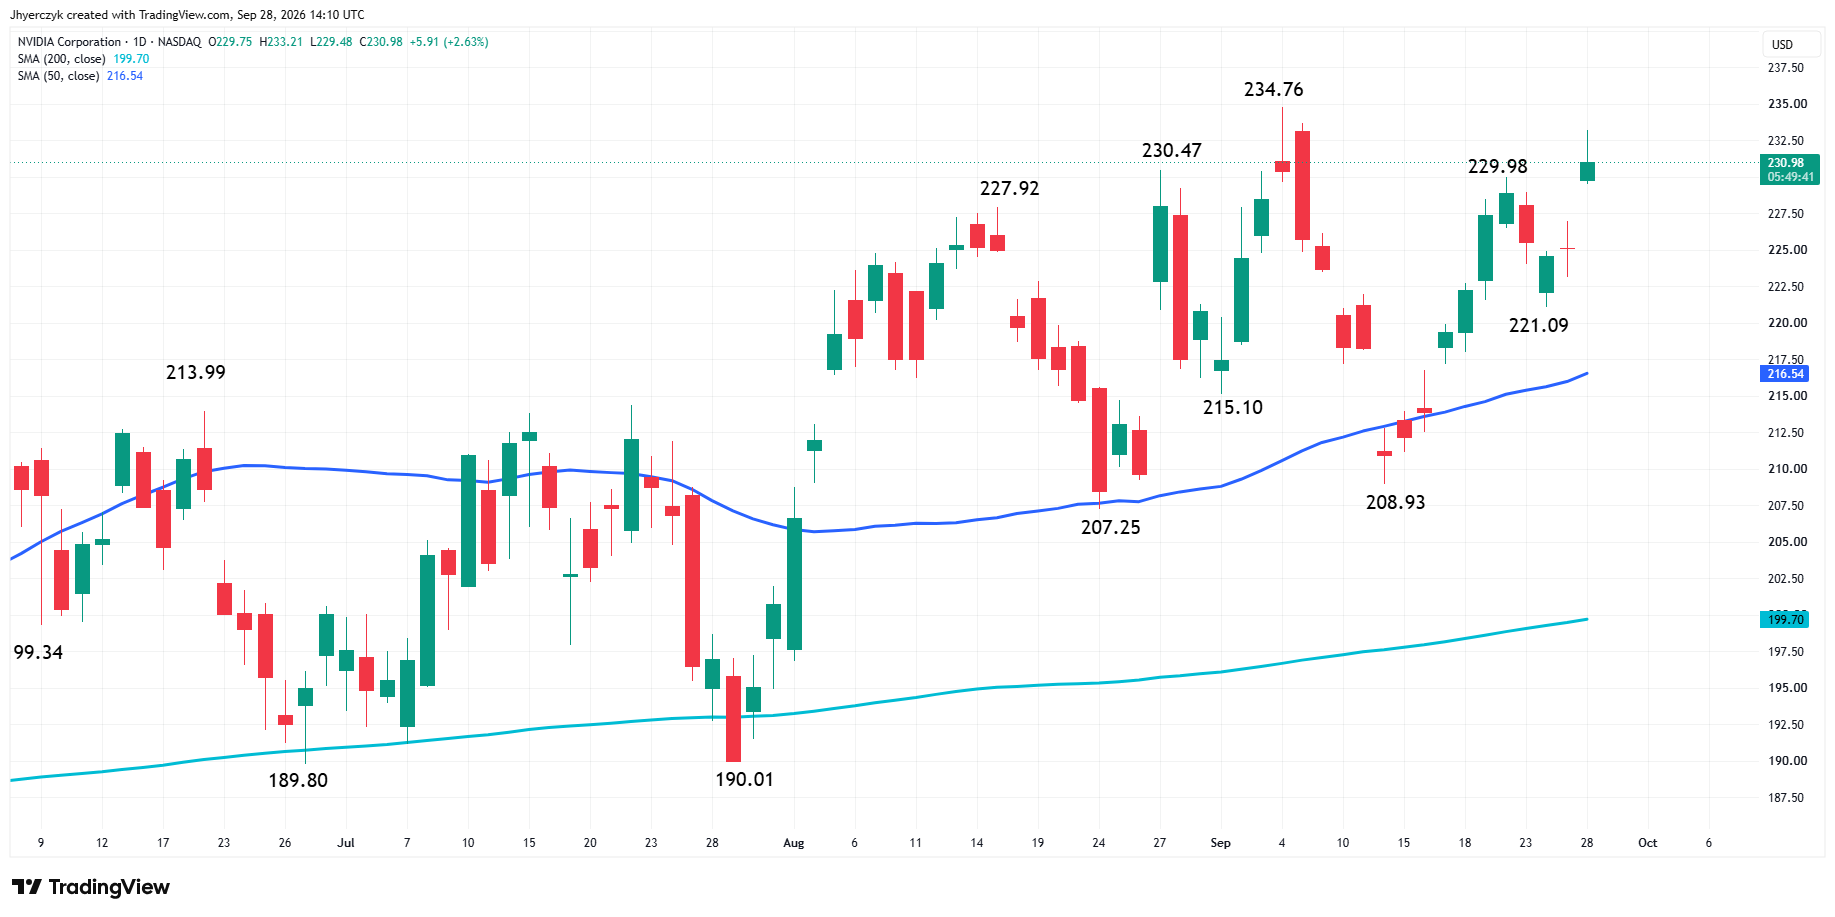
Nvidia is trading higher Monday after the buyback announcement pushed the stock back above $230.00. The trade through the last swing top at $229.98 puts the next swing top at $234.76 in play.
The main trend is up according to the daily swing chart. A trade through $234.76 will signal a resumption of the uptrend. The main trend will change to down if the swing bottom at $221.09 fails.
The 50-day moving average at $216.54 is providing short-term support. The 200-day moving average at $199.70 is providing long-term support and trend direction. Nvidia remains above both indicators.
Daily SOXX Technical Analysis
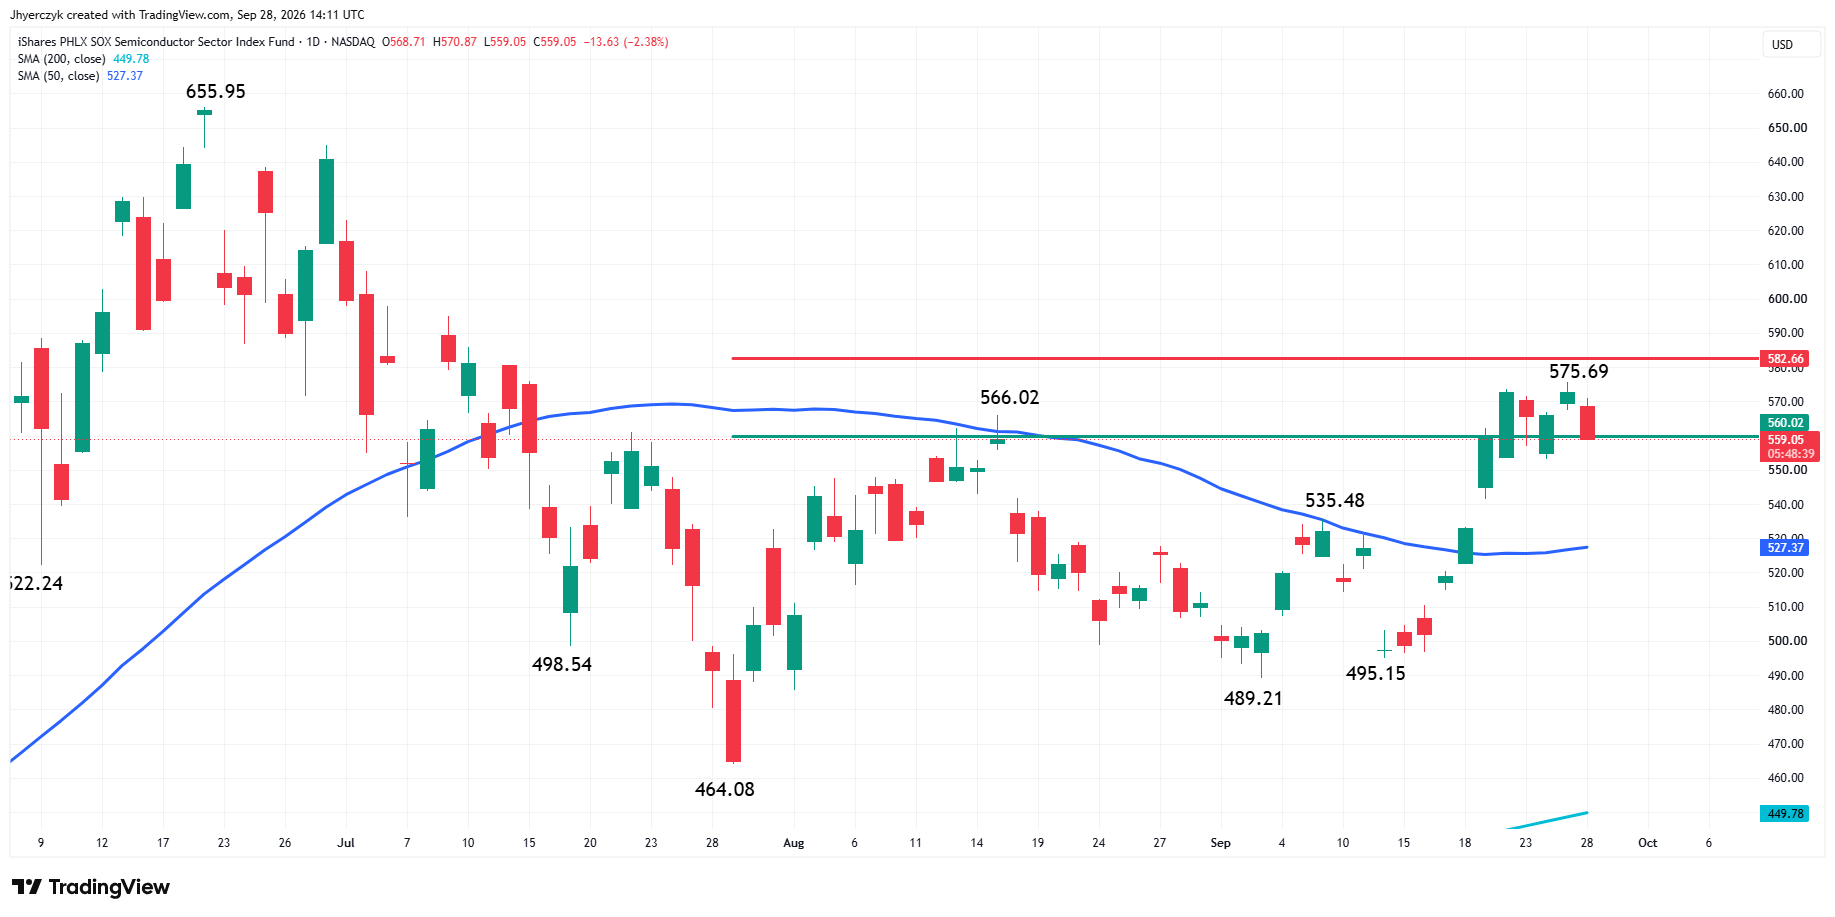
SOXX turned lower Monday after failing to hold above $560.02. The ETF reached $575.69 last week but could not extend the rally.
The 50-day moving average at $527.37 is providing short-term support and trend direction. SOXX remains above the moving average, but the break back under $560.02 gives sellers the early advantage.
The first resistance is $560.02, followed by $575.69. The 61.8% retracement level at $582.66 is the key upside level. A sustained move over $582.66 could bring in new buyers.
The 200-day moving average at $449.78 is pointing higher and providing long-term support and trend direction.
Nvidia Is Standing Alone in a Weak Chip Group
Nvidia added $150 billion to its share-repurchase authorization, bringing the total to $235 billion, and buyers went after the stock while the rest of the chip group was getting sold. It’s the exception in the AI trade Monday morning.
AMD and Micron are both lower with the semiconductors. Meta, Microsoft and Amazon are giving ground too, so the selling has moved past the chipmakers and into the rest of the names that led last week.
Nvidia’s gain isn’t close to enough to keep the Nasdaq Composite or SOXX out of the red. The question for the rest of the session is whether buyers work their way back into AMD and Micron or keep their money parked in Nvidia.
Oil and Yields Are Testing Last Week’s AI Rally
Brent crude is back above $106 after President Trump rejected Iran’s ceasefire conditions, and stocks are trading the move as an inflation problem. With the U.S.-Iran peace proposal stalled, the Hormuz story is landing in the rate market, and the tech stocks are feeling it.
The 10-Year U.S. Treasury yield is over 5.20% and the 30-year is above 5.50%. Last week the 10-Year printed its highest level since 2007, and the 30-year got to a level it hadn’t seen since 2004. Those aren’t small moves, and the stock market has to show it can take them without giving back more of the rally.
The indexes held up last week while rates climbed because buyers kept coming into the AI leaders. Monday is the first real test of that, and the early read isn’t good. Oil is up, yields are up and most of the group is down. The buyback is helping Nvidia, but the rate backdrop is the same for everyone else.
Tech Needs Softer Inflation Data to Get Relief
Wednesday’s Personal Consumption Expenditures (PCE) reports are the first chance this week for the bond sell-off to cool, and tech buyers need it to. Thursday’s manufacturing data and Friday’s employment report come after that.
Strong manufacturing and jobs numbers won’t get much of a welcome from tech buyers this week. What traders want to know is whether growth and higher oil keep inflation too hot for the Fed to stop tightening.
Until the data gives them a reason to think otherwise, buyers are dealing with higher financing costs and a dollar that remains firm. A softer PCE report or a weaker payrolls number is what pulls yields back and gives tech room to recover.
What to Watch
The rate trade has the upper hand going into Wednesday, and Monday’s oil move didn’t make it any easier for buyers. PCE is the first major report that can change that. Friday’s employment report is the second.
The other issue is breadth. Nvidia can’t carry the Nasdaq Composite by itself, and the index needs the rest of the chip group to find buyers before anyone can say the selling is over. AMD and Micron are the two to watch.
The Nasdaq Composite is trading under the 26,997.47 to 27,066.22 retracement zone after last week’s run to 27,288.79. Sellers have the early edge while it stays below that zone, and the 26,545.88 to 26,370.55 support zone is the next area buyers have to hold. If that zone gives way, the 50-day moving average at 26,196.69 is the level that matters. The tone of the market will be determined by trader reaction to the retracement zone.
Nvidia has the momentum. The buyback took it through the last swing top, and $234.76 is the next target as long as the $221.09 swing bottom holds.
SOXX is the chart to watch for the rest of the group. It needs to get back over $560.02 to take the early advantage away from sellers. Under that price, the 50-day moving average at $527.37 is the next pullback target, and a sustained move over the 61.8% level at $582.66 is what brings in new buyers.
More Information in our Economic Calendar.