Oil Retreat Lifts Stocks Off Their Lows, but Treasury Yields Still Control the Tape
Stocks bounced off their lows by early afternoon Monday. The trigger was a report that President Trump was open to easing sanctions on Iran in exchange for concrete nuclear progress. Crude came off its session high on the headline. Buyers used the dip in oil to cover some of the rate-and-inflation selling from the morning.
I wouldn’t call it a turnaround. Treasury yields are sitting near their highs and all three major averages are in the red. The Nasdaq Composite Index low stopped just short of the level that turns its minor trend down. Traders are still looking at the same thing they were at the open: oil, inflation and a Federal Reserve leaning toward more rate hikes.
At 17:40 GMT, the S&P 500 Index is trading at 7,700.68, down 42.73 points or -0.55%. The Nasdaq Composite Index is at 26,904.69, down 164.02 points or -0.61%. The Dow Jones Industrial Average is down about 188 points, or -0.4%.
Daily Nasdaq Composite Index Technical Analysis
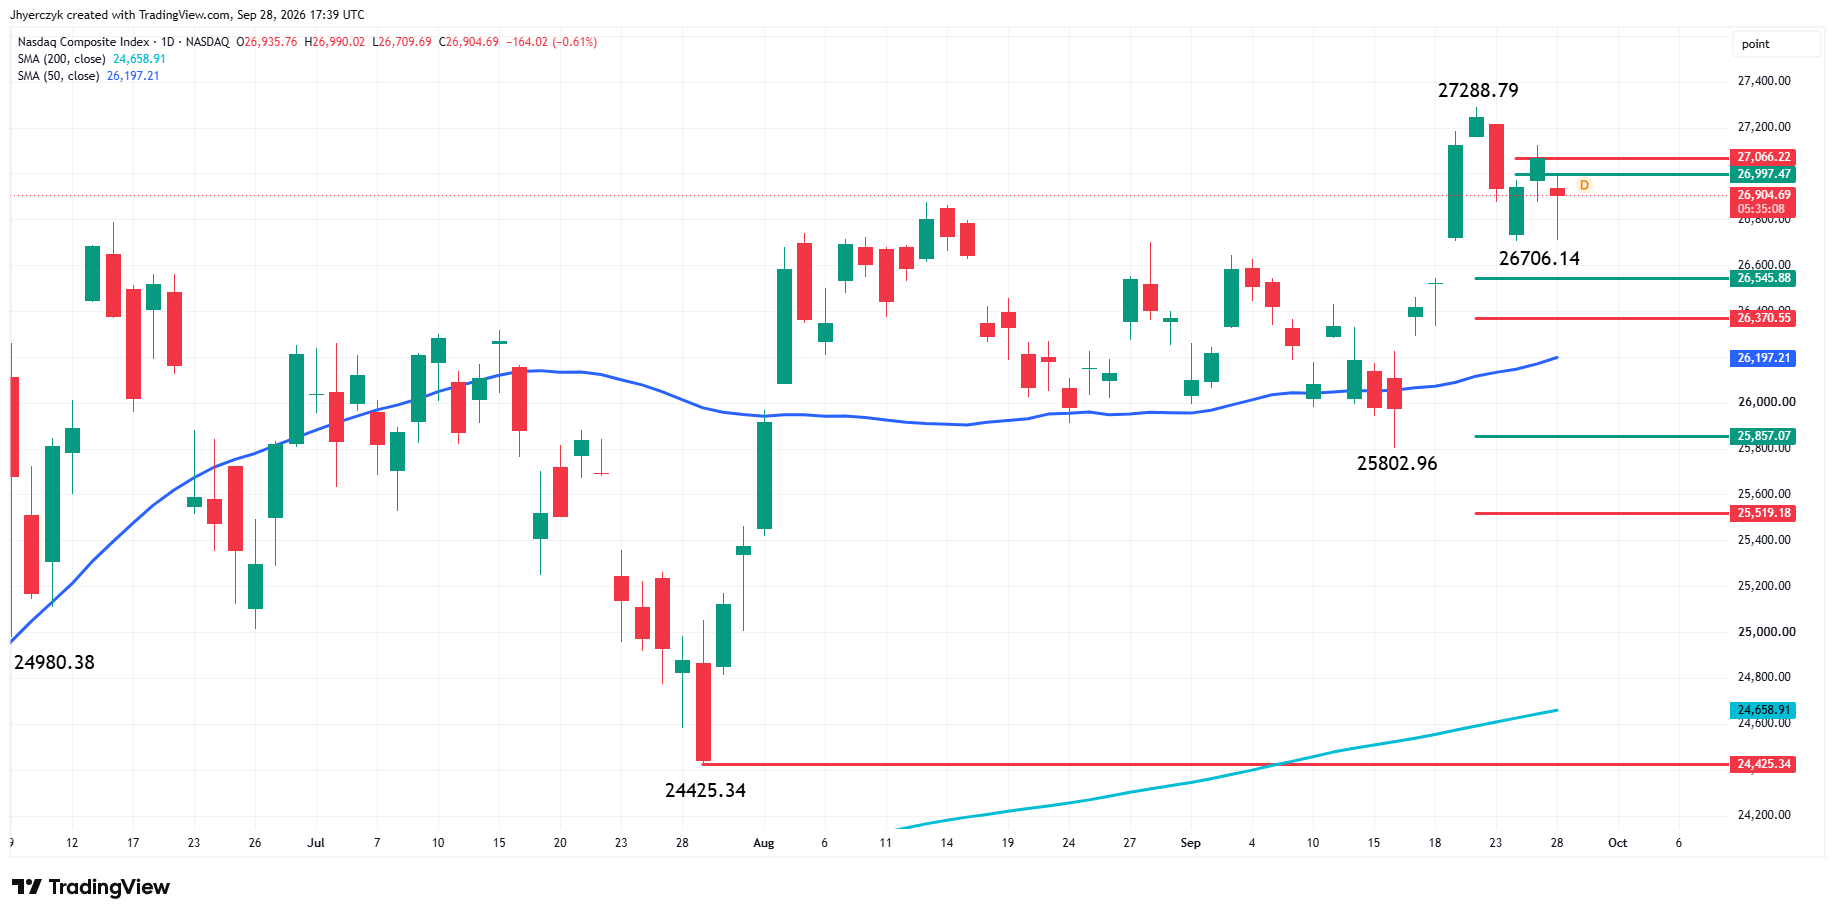
The Nasdaq Composite Index turned higher from its low Monday, however, it remains below the 26,997.47 to 27,066.22 retracement zone. The index traded as low as 26,709.69 before recovering to 26,904.69.
The main trend is up according to the daily swing chart. A trade through 27,288.79 will signal a resumption of the uptrend. The main trend will change to down under 25,802.96.
The minor trend is also up. A trade through 26,706.14 will change the minor trend to down.
The nearest support zone is 26,545.88 to 26,370.55. The 50-day moving average at 26,197.21 is the next major support and trend indicator underneath.
Brent Oil Price Forecast
Every new Brent Oil analysis as it publishes, today's technical signal and key levels, live price — on one page.
See all Brent Oil forecastsDaily S&P 500 Index Technical Analysis
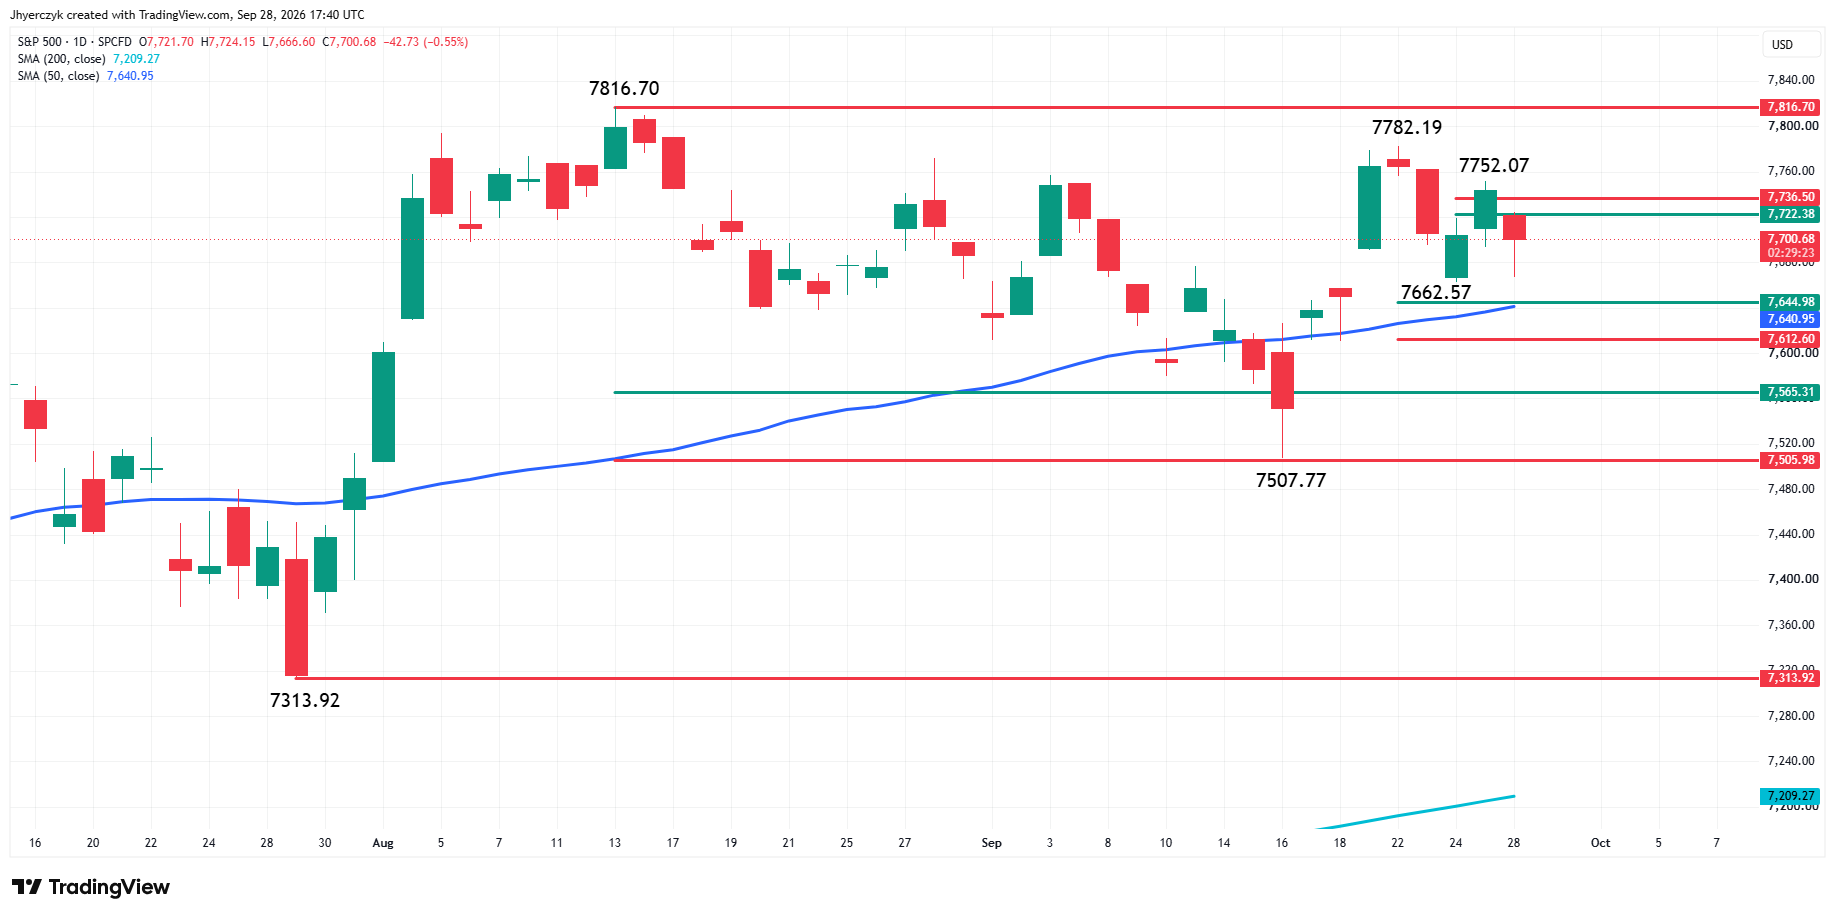
The S&P 500 Index also came off its low after testing 7,666.60. Buyers pushed the index back to 7,700.68, however, it remains below the 7,722.38 to 7,736.50 resistance area.
The first support is the recent bottom at 7,662.57, followed by nearby support at 7,644.98 and the 50-day moving average at 7,640.95.
The first upside test is the 7,722.38 to 7,736.50 zone. The larger upside target remains the contract high at 7,816.70.
Sanctions Talk Knocked Crude Off Its High Only Briefly
Oil drove the stock market again Monday. Crude jumped in the morning after Trump rejected Iran’s earlier peace proposal. Traders took that as a fresh threat to Hormuz traffic and Middle East supply. Inflation went right back into the rate trade, and stocks sold off with it.
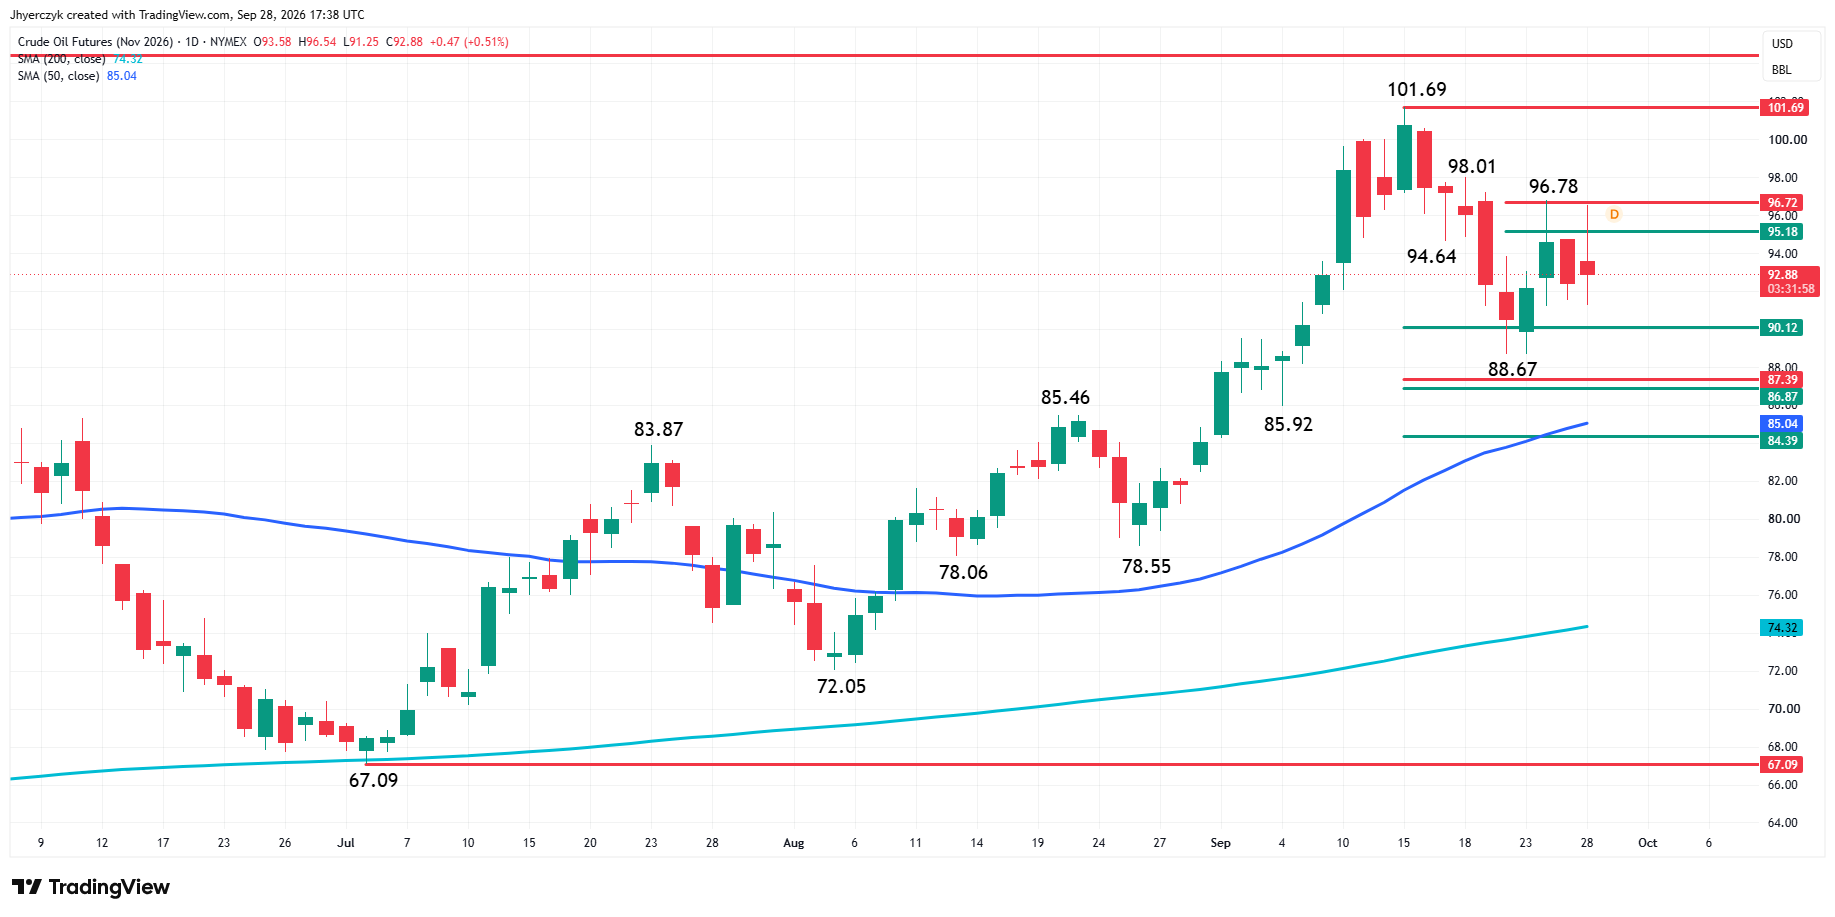
November WTI crude oil futures got as high as $96.54 before the sanctions report hit. They dropped to $92.88. December Brent crude oil futures topped out at $101.24 and fell back to $97.85. WTI gave back more than $3.60 from the top. That was a fast move out of the oil premium.
The report didn’t say Iran had agreed to end uranium enrichment. It said Trump was open to sanctions relief if Tehran made concrete progress on its nuclear program. That’s a negotiating position. Nobody signed anything. It was still enough to pull the major averages up from their lows.
Crude didn’t stay down long. Saudi Arabia reportedly resumed exports through its East-West Pipeline, and oil recovered from the first pullback anyway. Stocks didn’t get an all-clear out of it. There’s less fear priced in than there was this morning. One more Iran or Saudi supply headline puts it right back.
Bond Traders Didn’t Buy the Oil Pullback
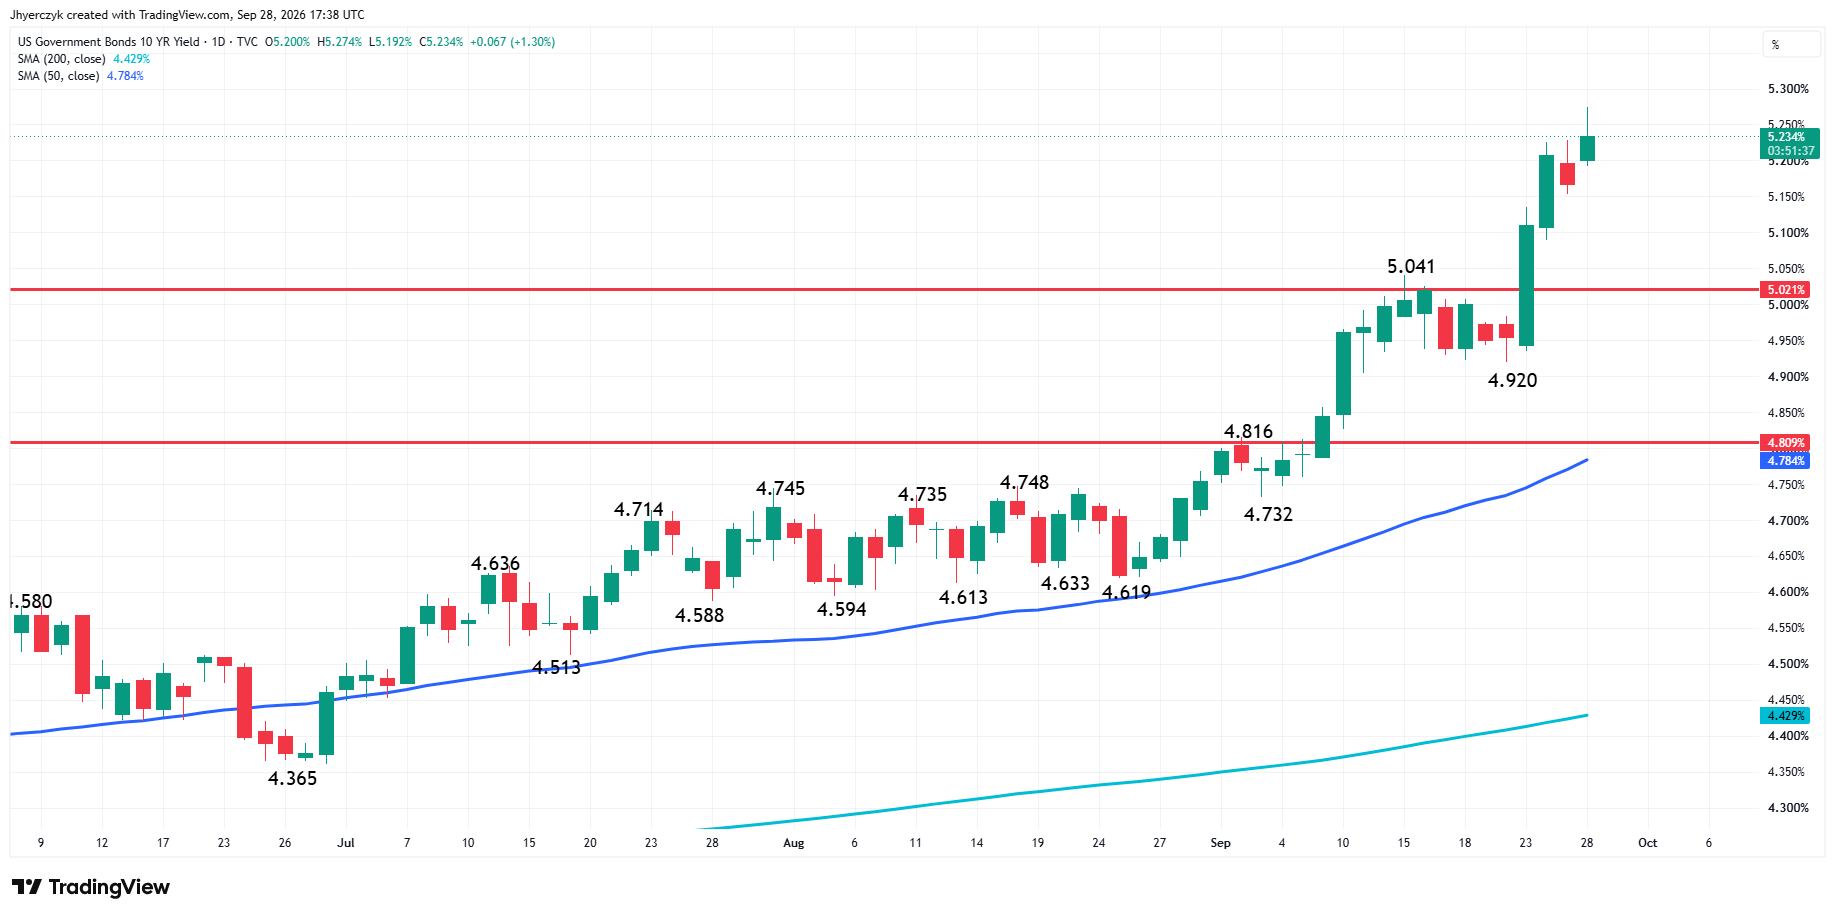
The 10-Year U.S. Treasury yield is trading at 5.234%, just under its 5.274% session high. Crude came off its peak. Bond traders didn’t care. The 10-Year is still well above the 5.021% breakout level and the 50-day moving average at 4.784%. The 30-year is holding above 5.50%.
This is the part stock buyers couldn’t fix Monday afternoon. The rate market is pricing the risk that energy prices, firm economic data and persistent inflation keep the Fed tightening. A few dollars off crude didn’t change that.
Federal Reserve Governor Lisa Cook gave the bond market more to work with. Cook said artificial intelligence may eventually help inflation, but not soon enough to offset current price pressure from the AI buildout, higher oil prices and Middle East supply disruptions. She supported the September rate hike. She also left the door open to more adjustments as inflation and labor data come in.
Wednesday’s Personal Consumption Expenditures (PCE) report and Friday’s Non-Farm Payrolls report sit at the center of the week. Tech buyers need soft numbers from both.
Nvidia’s Buyback Isn’t Pulling the Chip Stocks Along
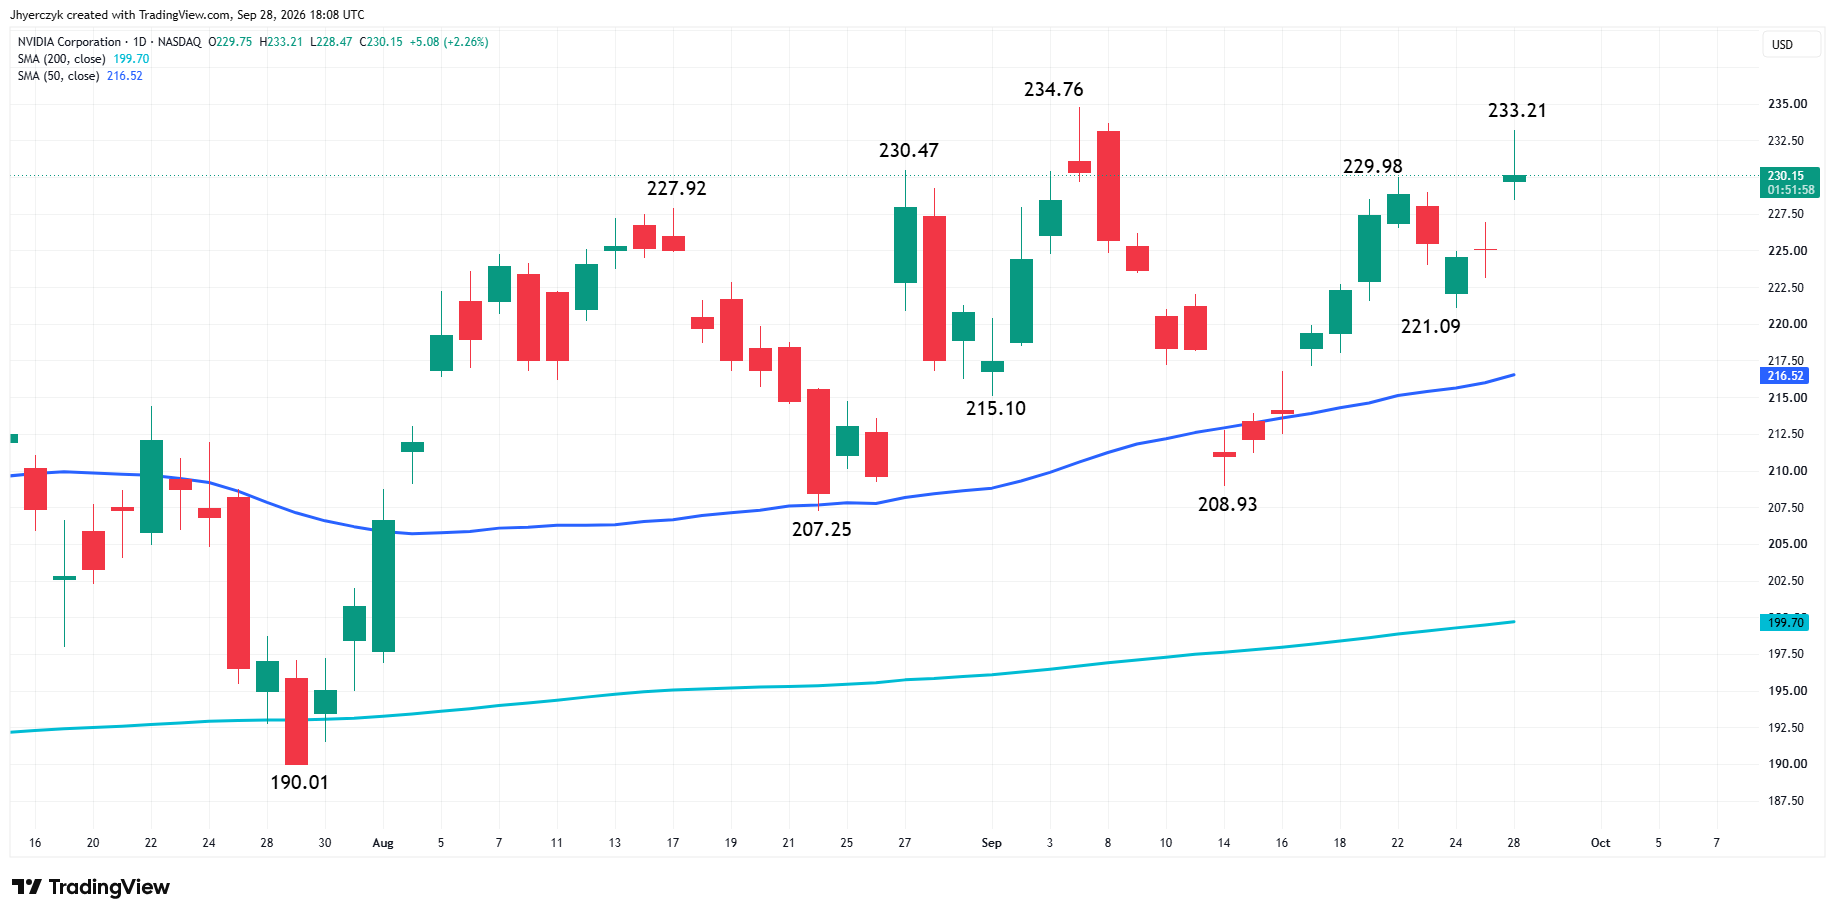
Nvidia is one of the few big technology names holding its ground this afternoon. The company raised its share-repurchase authorization by $150 billion, taking the total program to $235 billion. Buyers have a specific reason to own it on a day like this. It’s where the money is sitting in the chip group today.
Nobody followed it. AMD and Micron are down sharply. Meta, Microsoft and Amazon are lower too. The weakness started out broader than one stock or one sector this morning. The afternoon bounce hasn’t changed that.
Nvidia is keeping the Nasdaq Composite Index from looking worse. That’s a narrow way to hold up an index. The rest of the semiconductor names need buyers before anyone can call Monday’s recovery more than a reaction to lower oil prices.
What to Watch
Stocks are trading the Iran headlines. The morning showed how quickly oil can put inflation back in front of stock traders. A denial from either side, renewed Houthi attacks or another disruption to Saudi supply would put the oil premium right back into the market.
The 10-Year is the other screen. It’s holding near its high even after crude gave back a big piece of its early jump. The bond market isn’t ready to let go of the inflation and Fed-hike trade. PCE and payrolls are what could pull yields back this week.
Monday’s low in the Nasdaq Composite Index held just above the 26,706.14 trigger, leaving the short-term trend intact but under pressure. Buyers have to get back into the 26,997.47 to 27,066.22 retracement zone and through it to show there’s more behind this bounce than an oil pullback. A break of the minor trend trigger opens the door to the 26,545.88 to 26,370.55 support zone.
Until yields start backing down, the S&P 500 Index rebound is a relief bounce. A sustained move through the 7,722.38 to 7,736.50 zone would put the September high at 7,752.07 back in play, with the contract high overhead. The recent bottom at 7,662.57 has to hold first. A failure there and at the 50-day moving average at 7,640.95 would put 7,612.60 and 7,565.31 back into play.
More Information in our Economic Calendar.