Bullish Reversal Establishes a Stronger Foundation
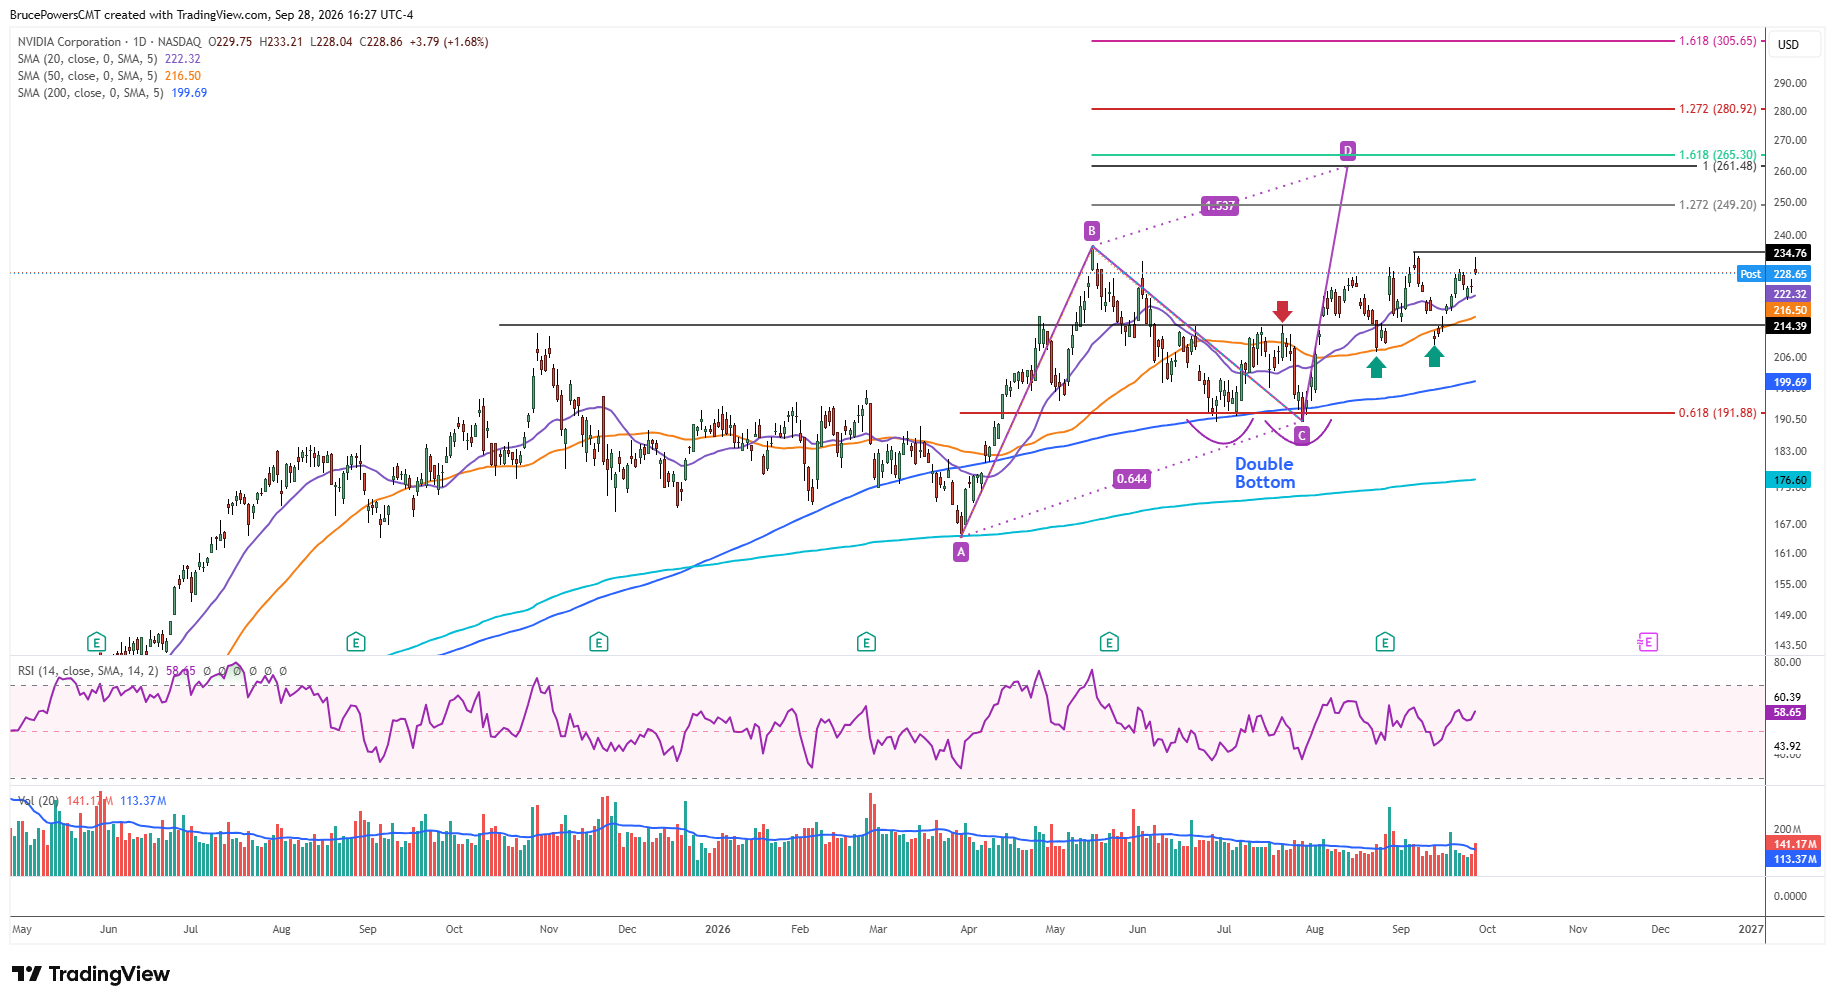
It is important to recognize the larger price pattern developing in the stock of Nvidia Corporation (NVDA), as it shows underlying strength and improving demand. A bullish reversal of a double bottom pattern triggered in early August following the recognition of a key support area. The lows of the double bottom confirmed support near the confluence of the 61.8% Fibonacci retracement of the prior advance and most importantly, the 200-day moving average.

Higher Lows Reinforce Improving Demand
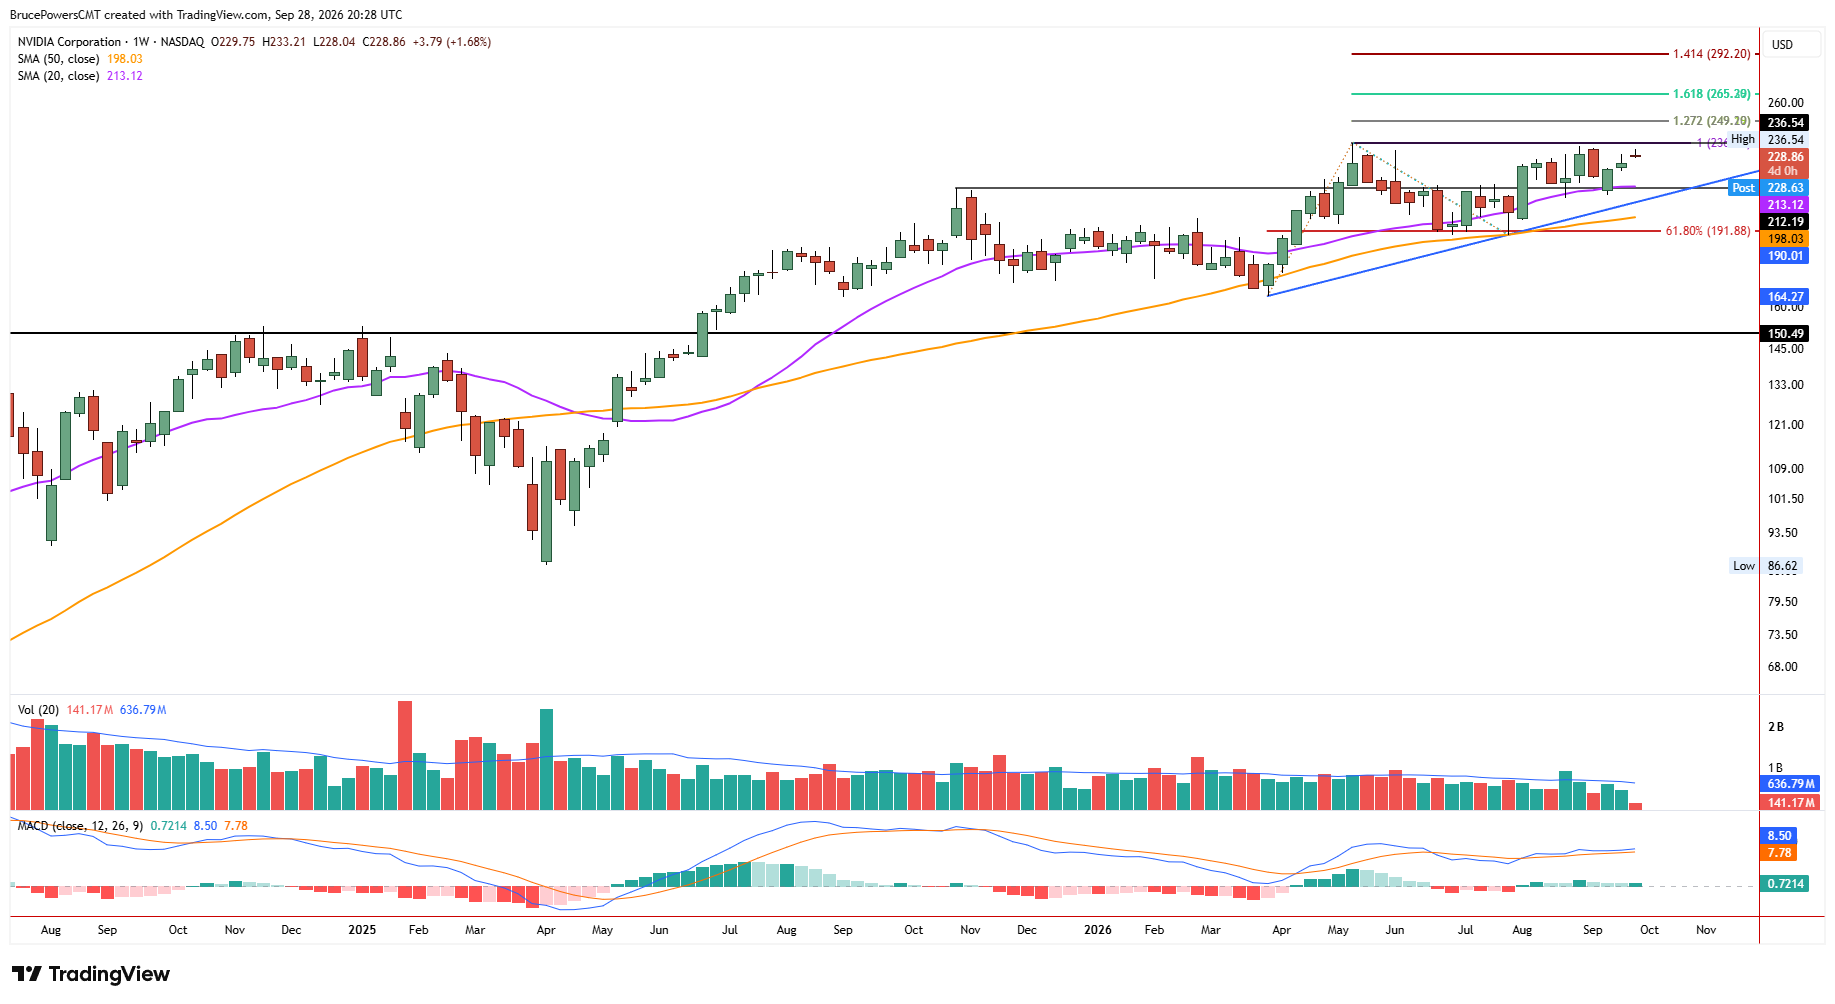
Subsequently, two higher swing lows and higher swing highs were established as the stock consolidated largely above prior resistance levels. The two lows show support being found near the 50-day and not too far below the neckline of the double bottom pattern at $214.39, which previously was a key resistance zone. In addition, on the weekly chart, support was indicated near the 20-week moving average. Strength was further indicated last week, with the successful test of support at the 20-day moving average, resulting in a higher swing low. It was further confirmed on Monday, when a new short-term trend high of $233.21 was established.
Support Test Puts Momentum to Work
Since this is the first time since the double bottom breakout that a pullback found support at the 20-day moving average and turned higher, it shows a small improvement in underlying demand. Therefore, if NVDA can stay above its 50-day moving average, a move toward higher prices are eventually suggested. The stock needs to get out of consolidation, which should see an improvement in momentum.
Breakout Level Opens Path Toward Higher Targets
A decisive rally above the September peak of $234.76 will signal a continuation of the developing advance. The first target would be the May peak of $236.54 (B) but given the price pattern that high has a good chance of being exceeded. Several potential new high targets for NVDA are shown on the charts, with a potential confluence zone around the 100% projection for a rising ABCD pattern at $261.84and the 161.8% Fibonacci extension of the recent downswing at $265.30.
If you’d like to know more about technical analysis and how traders use it, please visit our educational area.