
USOIL, UKOil & Natural Gas Outlook: Iran Standoff Keeps Supply Risk High as Gulf Exports Recover
Current oil conditions show an ample supply despite risk premiums for uncertain supply caused by the Iran/US situation. The Middle East is supplying a good deal of crude again and is actually starting to alleviate some of the supply pressure.
Major Middle East crude exports rose to 12.8 million bpd in September from 11.7 million bpd in August, according to Kpler. This is the first time crude exports have risen since the conflict began in February. A combination of ship-to-ship transits and other creative transport means have allowed both Saudi Arabia and the UAE to re-open crude exports.
The extra-cost and inefficient means to move crude have offset the price bears for WTI and Brent. Maintaining the crude flows through the Strait of Hormuz is of foremost concern for both Saudi and the UAE.
Diplomacy remains the main motor of change in the short term. Officials from both the U.S. and Iran have met with mediators to find a solution to the ongoing crisis. It is expected that the U.S. will present an amended version of the framework proposed by Iran to the mediation. Iranian officials have said they do not expect an agreement will be reached, and conditions in the Strait of Hormuz will not allow for a resolution any time soon.
Natural gas will most likely remain in a supply deficit condition. Qatar has extended force majeure for LNG shipments to Italy and to Pakistan and Bangladesh. LNG shipments from Qatar have dropped by 96% since the crisis started a year ago. Only 18 shipments have been made this year as compared to 509 in the same period in 2021.
A few LNG ships owned by Qatar have recently been observed to be transiting the Strait. European countries are relying more on U.S. LNG. As the situation stands, the U.S. is expected to play a more dominant role in meeting Europe’s LNG demands.
Continued biases: USOIL and UKOIL bullish. Natural Gas bullish with U.S-Iran diplomacy and the situation with the Strait of Hormuz the main drivers.

Natural Gas Technical Analysis: NG Holds $3.10 Support as $3.20 Becomes the Next Upside Test
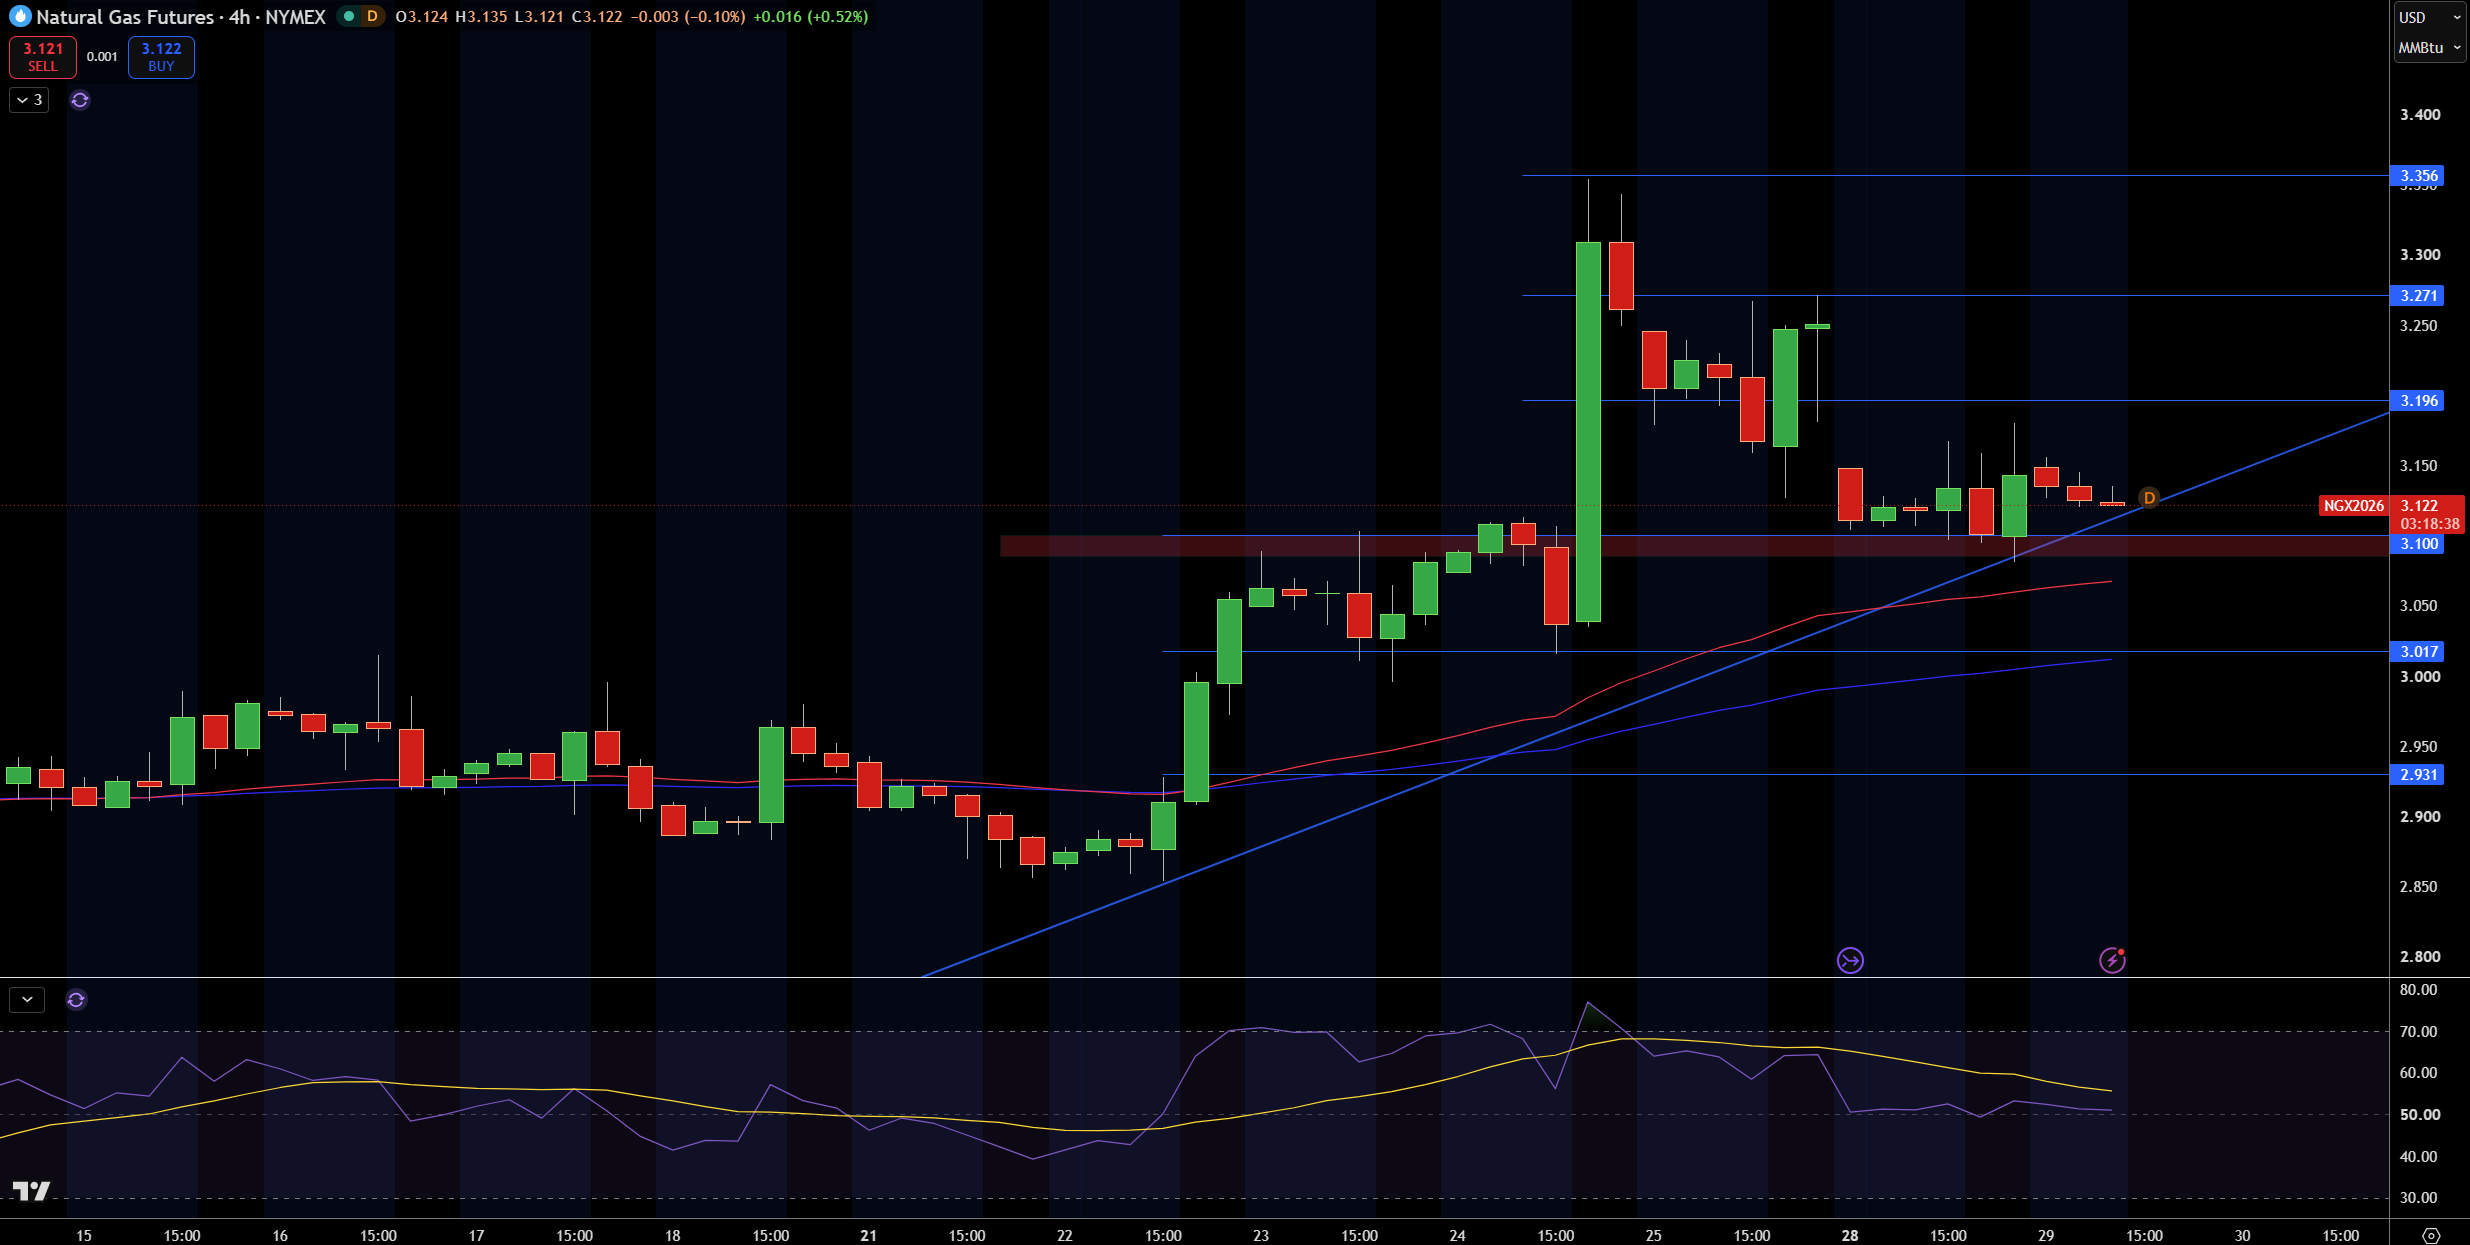
Natural gas is presently trading at $3.12. Recently, natural gas has been trading in a range between $3.10 and $3.20, with a higher degree of trade above the $3.10 level. Additionally, natural gas has been trading above a rising trendline and both moving averages. Overall, the recent correction from $3.27 has not damaged the uptrend and higher bullish minor degree wave.
To the upside, the main resistance is located at $3.20, and above that resistance at $3.27 and $3.36. The lowest support is located at $3.10, and below that support at $3.02 and $2.93.
RSI is currently at the 50 level, which indicates that the current trend is neither bullish nor bearish. I am currently biased to the upside of natural gas as long it is trading above $3.10 and the rising trendline. If natural gas trades below $3.02, I would change my bias to the downside. Furthermore, if natural gas trades above $3.20, I would expect natural gas to trade toward the $3.27 and $3.36 levels.
Natural Gas Price Forecast
Every new Natural Gas analysis as it publishes, today's technical signal and key levels, live price — on one page.
See all Natural Gas forecastsWTI Crude Oil Technical Analysis: USOIL Holds $92.97 as $95.60 Breakout Remains the Key Test
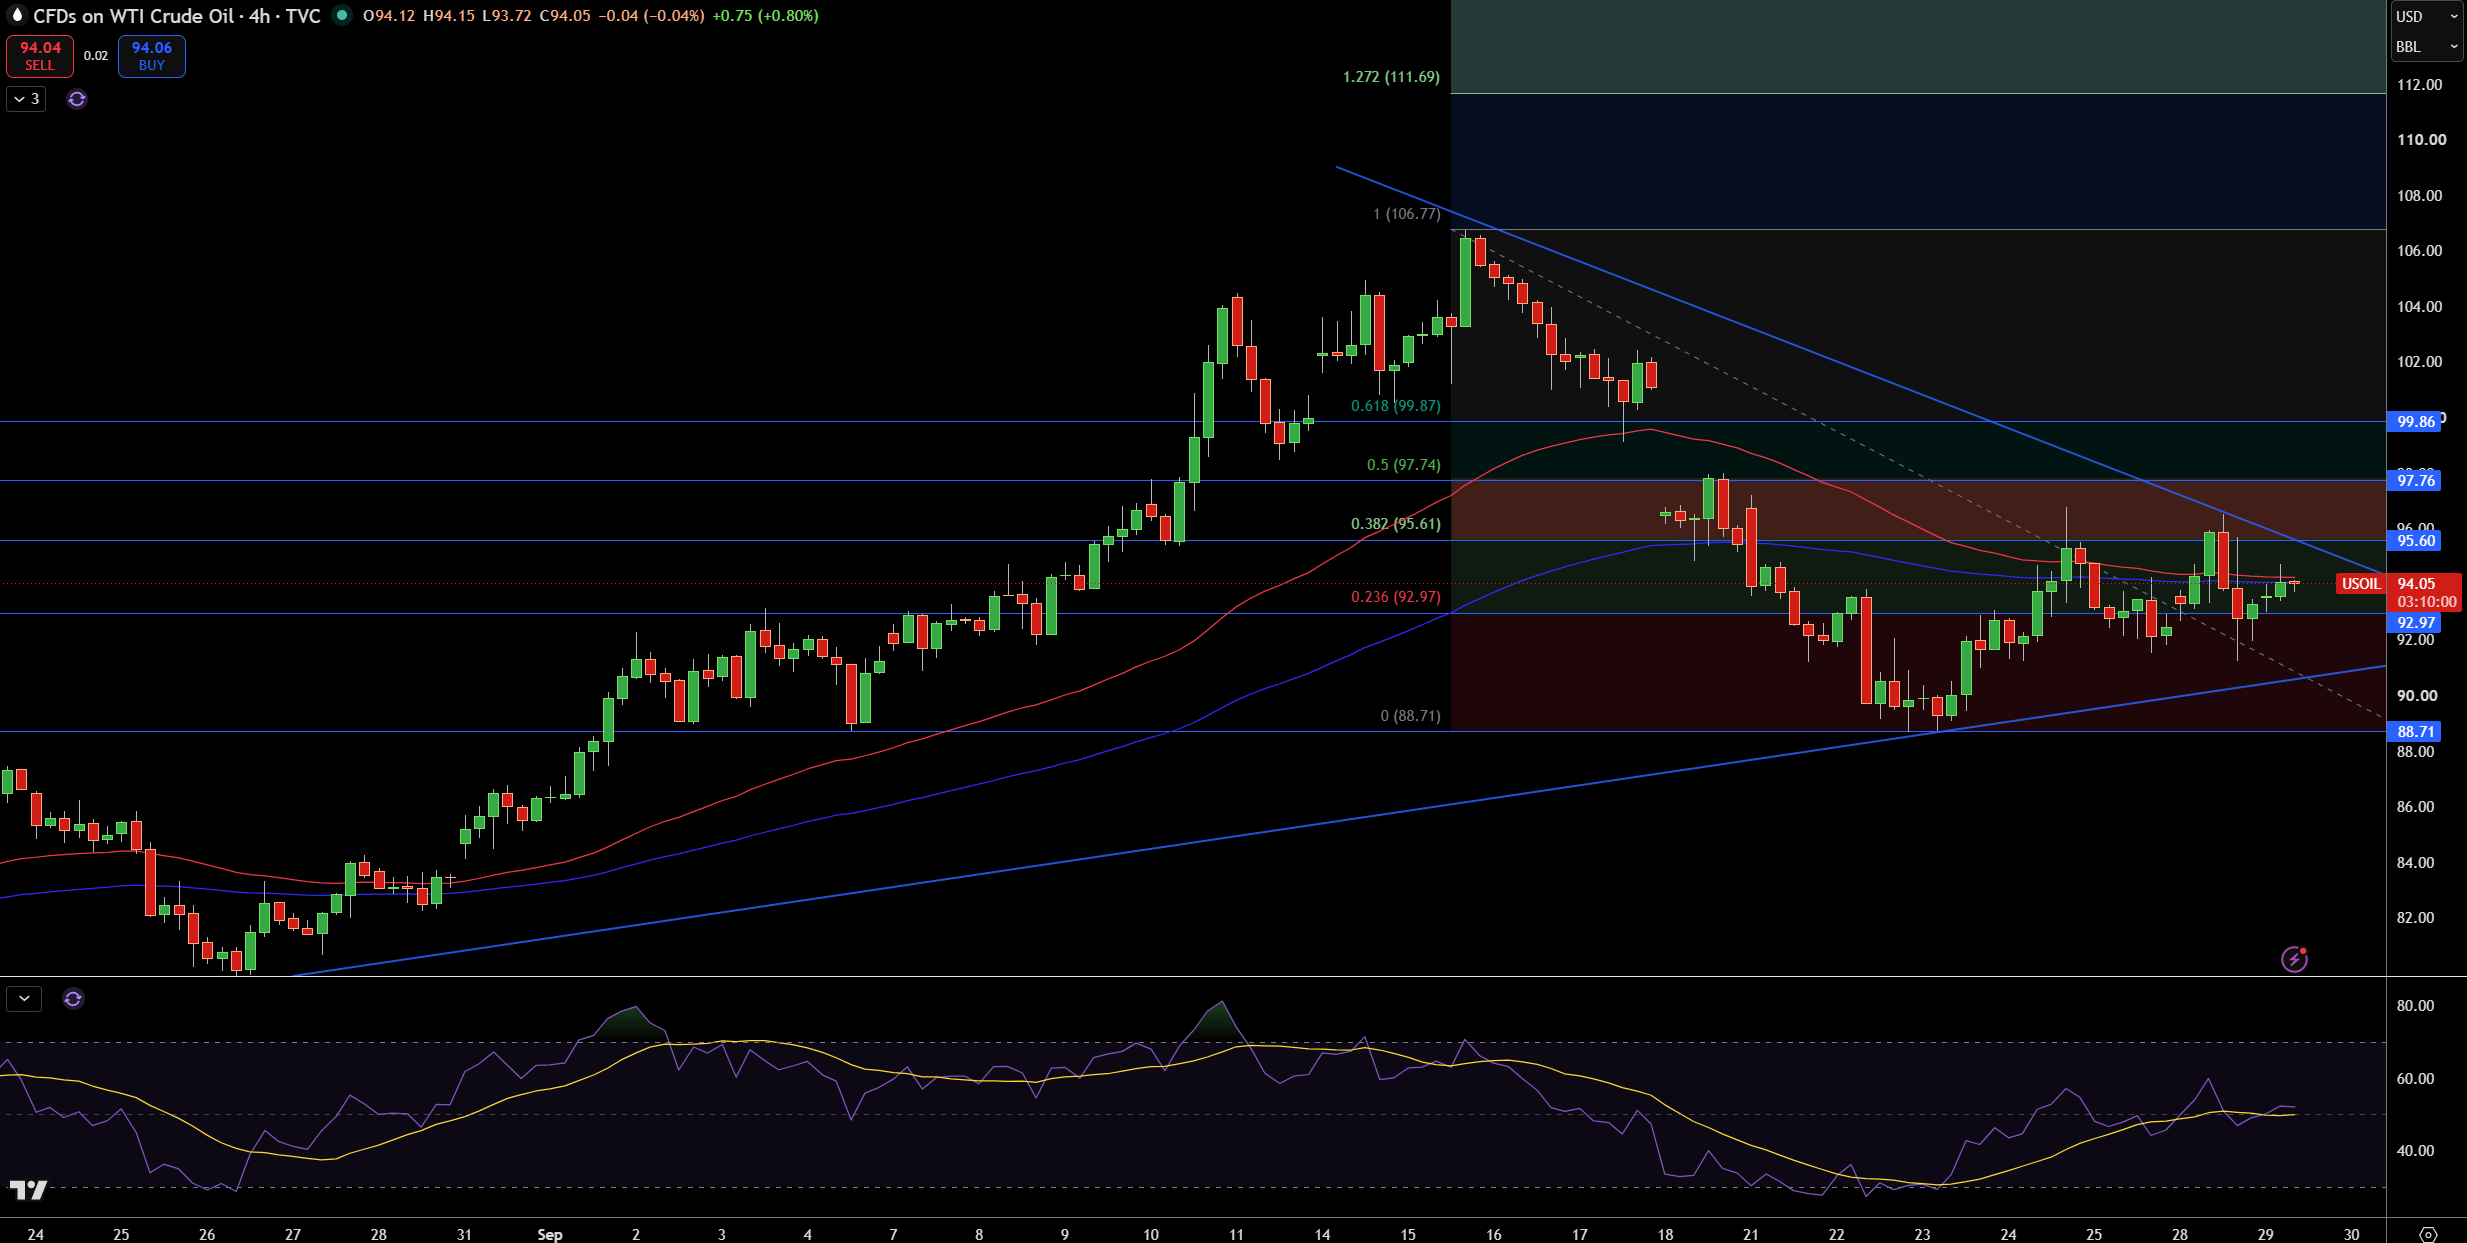
WTI Crude oil is currently trading at $94.05. I have been watching the price action on the 4 hour time frame. Recently, Price has tested the Fibonacci support level at $92.97 and is in a definite downtrend, evidenced by a moving average below the current price. The 4 hour time frame charts are showing a good deal of sideways movement and a failure to move above the $95.60 resistance level.
Should WTI manage to break above the resistance level at $95.60, the next level of resistance is projected at $97.76. Moving below the Fibonacci support at $92.97 projects an extension of the downtrend with the next major support levels at $88.71 and $78.78.
The RSI is in the middle, indicating no clear trend. Should the support at $92.97 hold, a move above the resistance at $95.60 would warrant a bullish outlook. A move below $92.97 would give a bearish outlook with the focus shifting to $88.71.
Brent Crude Oil Technical Analysis: UKOIL Holds $97.24 as $100.23 Remains the First Recovery Hurdle
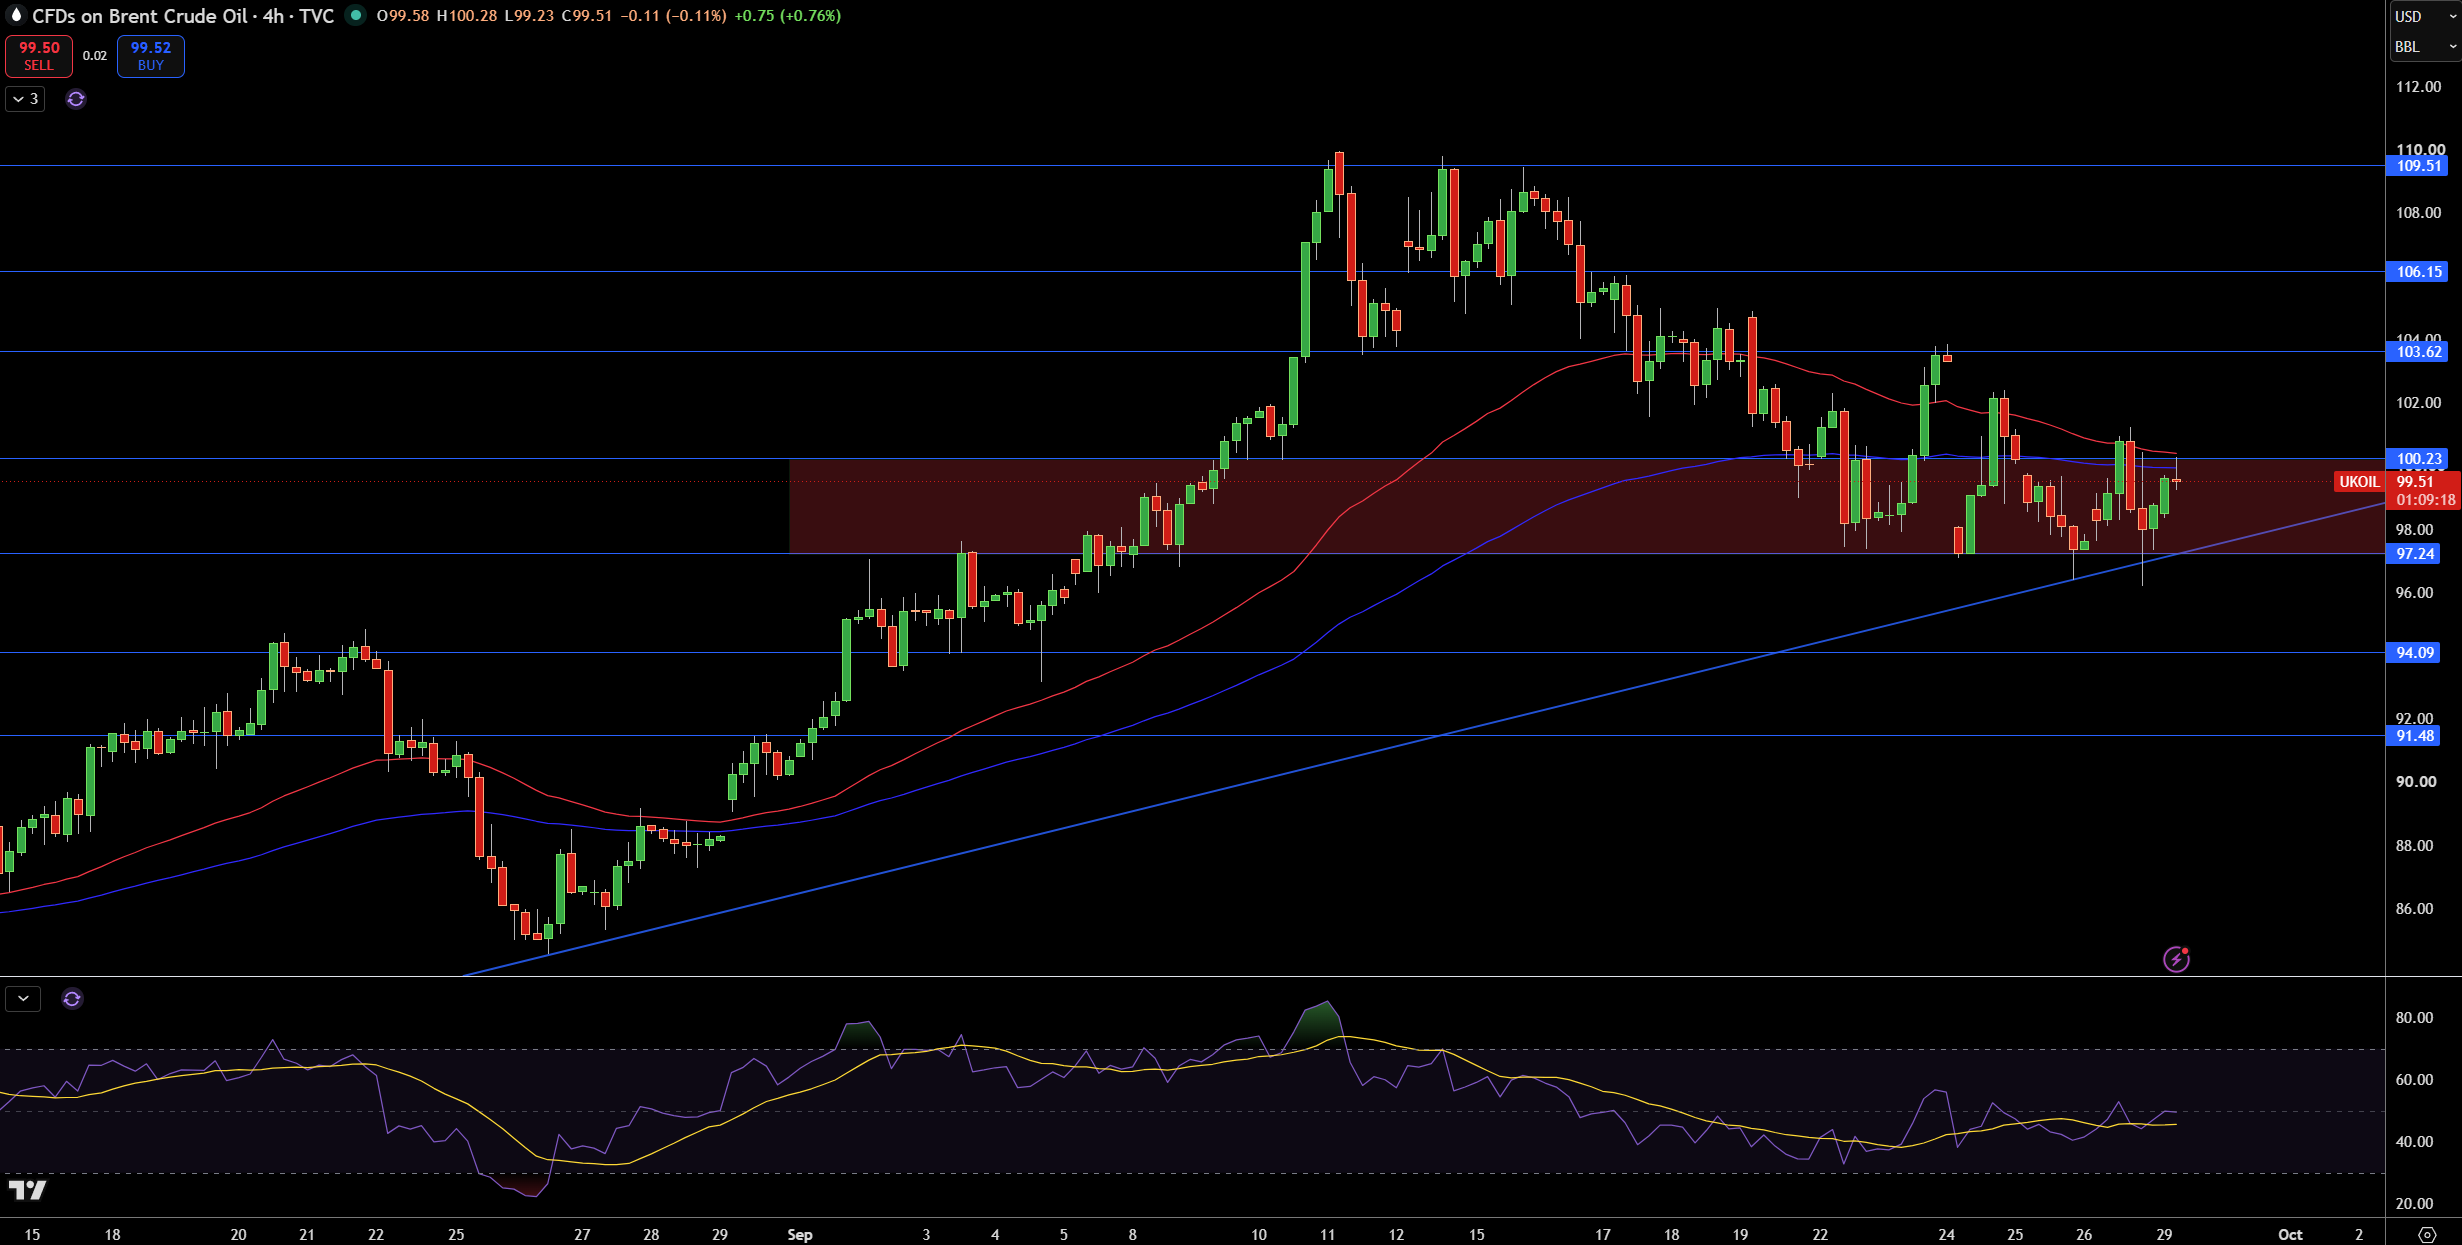
Brent crude is currently at $99.51, having bounced once again from $97.24. The bullish momentum is capped, in my opinion, by the bearish bias surrounding the moving averages. Therefore, while price is still above $97.24 and the rising trendline, I view the current price action as a sideways consolidation between $97.24 and the psychological resistance level at $100.23.
A break above $100.23 would open up the $103.62 and $106.15 resistance levels. To the downside, $97.24 would provide support first, and if broken, the rising trendline would come into play at $94.09 and $91.48.
The presence of the Rising Wedge formation between $112.52 and $96.64 gives a bearish bias to the consolidation, therefore I view the consolidation between $97.24 and $100.23 as bearish. Therefore, I would only become bullish if $97.24 was taken out to the downside, and bearish if $100.23 was broken to the upside.