
Dollar Index Outlook: Rising Yields Support Dollar as ECB Stays Cautious and BoE Hike Bets Build
The US dollar is higher on Tuesday, as investor expectation for a longer Fed tightening cycle increased with higher U.S. inflation and interest rates.
Oil price increases, along with a rise in Treasury yields, increase expectation for an elongated Fed tightening cycle, and have benefitted the U.S. dollar. Currently, there is a 70% chance for a 3rd consecutive 75 basis point rate hike at the October FOMC meeting, up from 57% last week. Traders expect the federal funds rate to rise to between 4.25% and 4.5%, from the current 3.25%-3.5%. Two year U.S. Treasury yields increased to almost 5%, while long term Treasuries fell to levels not seen since the financial crisis.
Higher US rates have benefitted the U.S. dollar index, which was further supported by tensions in the Middle East. Increases in oil prices stem from uncertainty about the resolution of the U.S. and Iran nuclear conflicts. AI related investments, high US inflation and robust economic activity have combined to eliminate the need for the Fed to signal a pause. Traders will get more rate hike signal when PCE inflation and employment data is released on Friday.
The ECB has taken a less aggressive stance than other central banks towards easing policy. Yesterday Lagarde indicated that ECB inflation expectations for 2021 have revised up to 4%. Lagarde does not expect that energy costs will cause “wage cost push” inflation. Hence, she expects that the ECB can remain on the sidelines until later this year.
Expectations for UK inflation are moving in the opposite direction. Recent surveys have indicated that the expected inflation outlook for the next year has increased to 4.5% from 3.9% in August. Longer-term expectations have increased to 4.3% from 3.7% in August. Recent signals by senior officials of the BoE have been interpreted as dovish. Investors are assigning an 85% probability of a 25 bp increase at the November BoE meeting.
Based on the forex outlook, the DXY is expected to strengthen, with the EUR expected to remain bearish and the GBP expected to strengthen.

U.S. Dollar Index Technical Analysis: DXY Holds 101.01 as 101.40 Remains the Next Upside Test
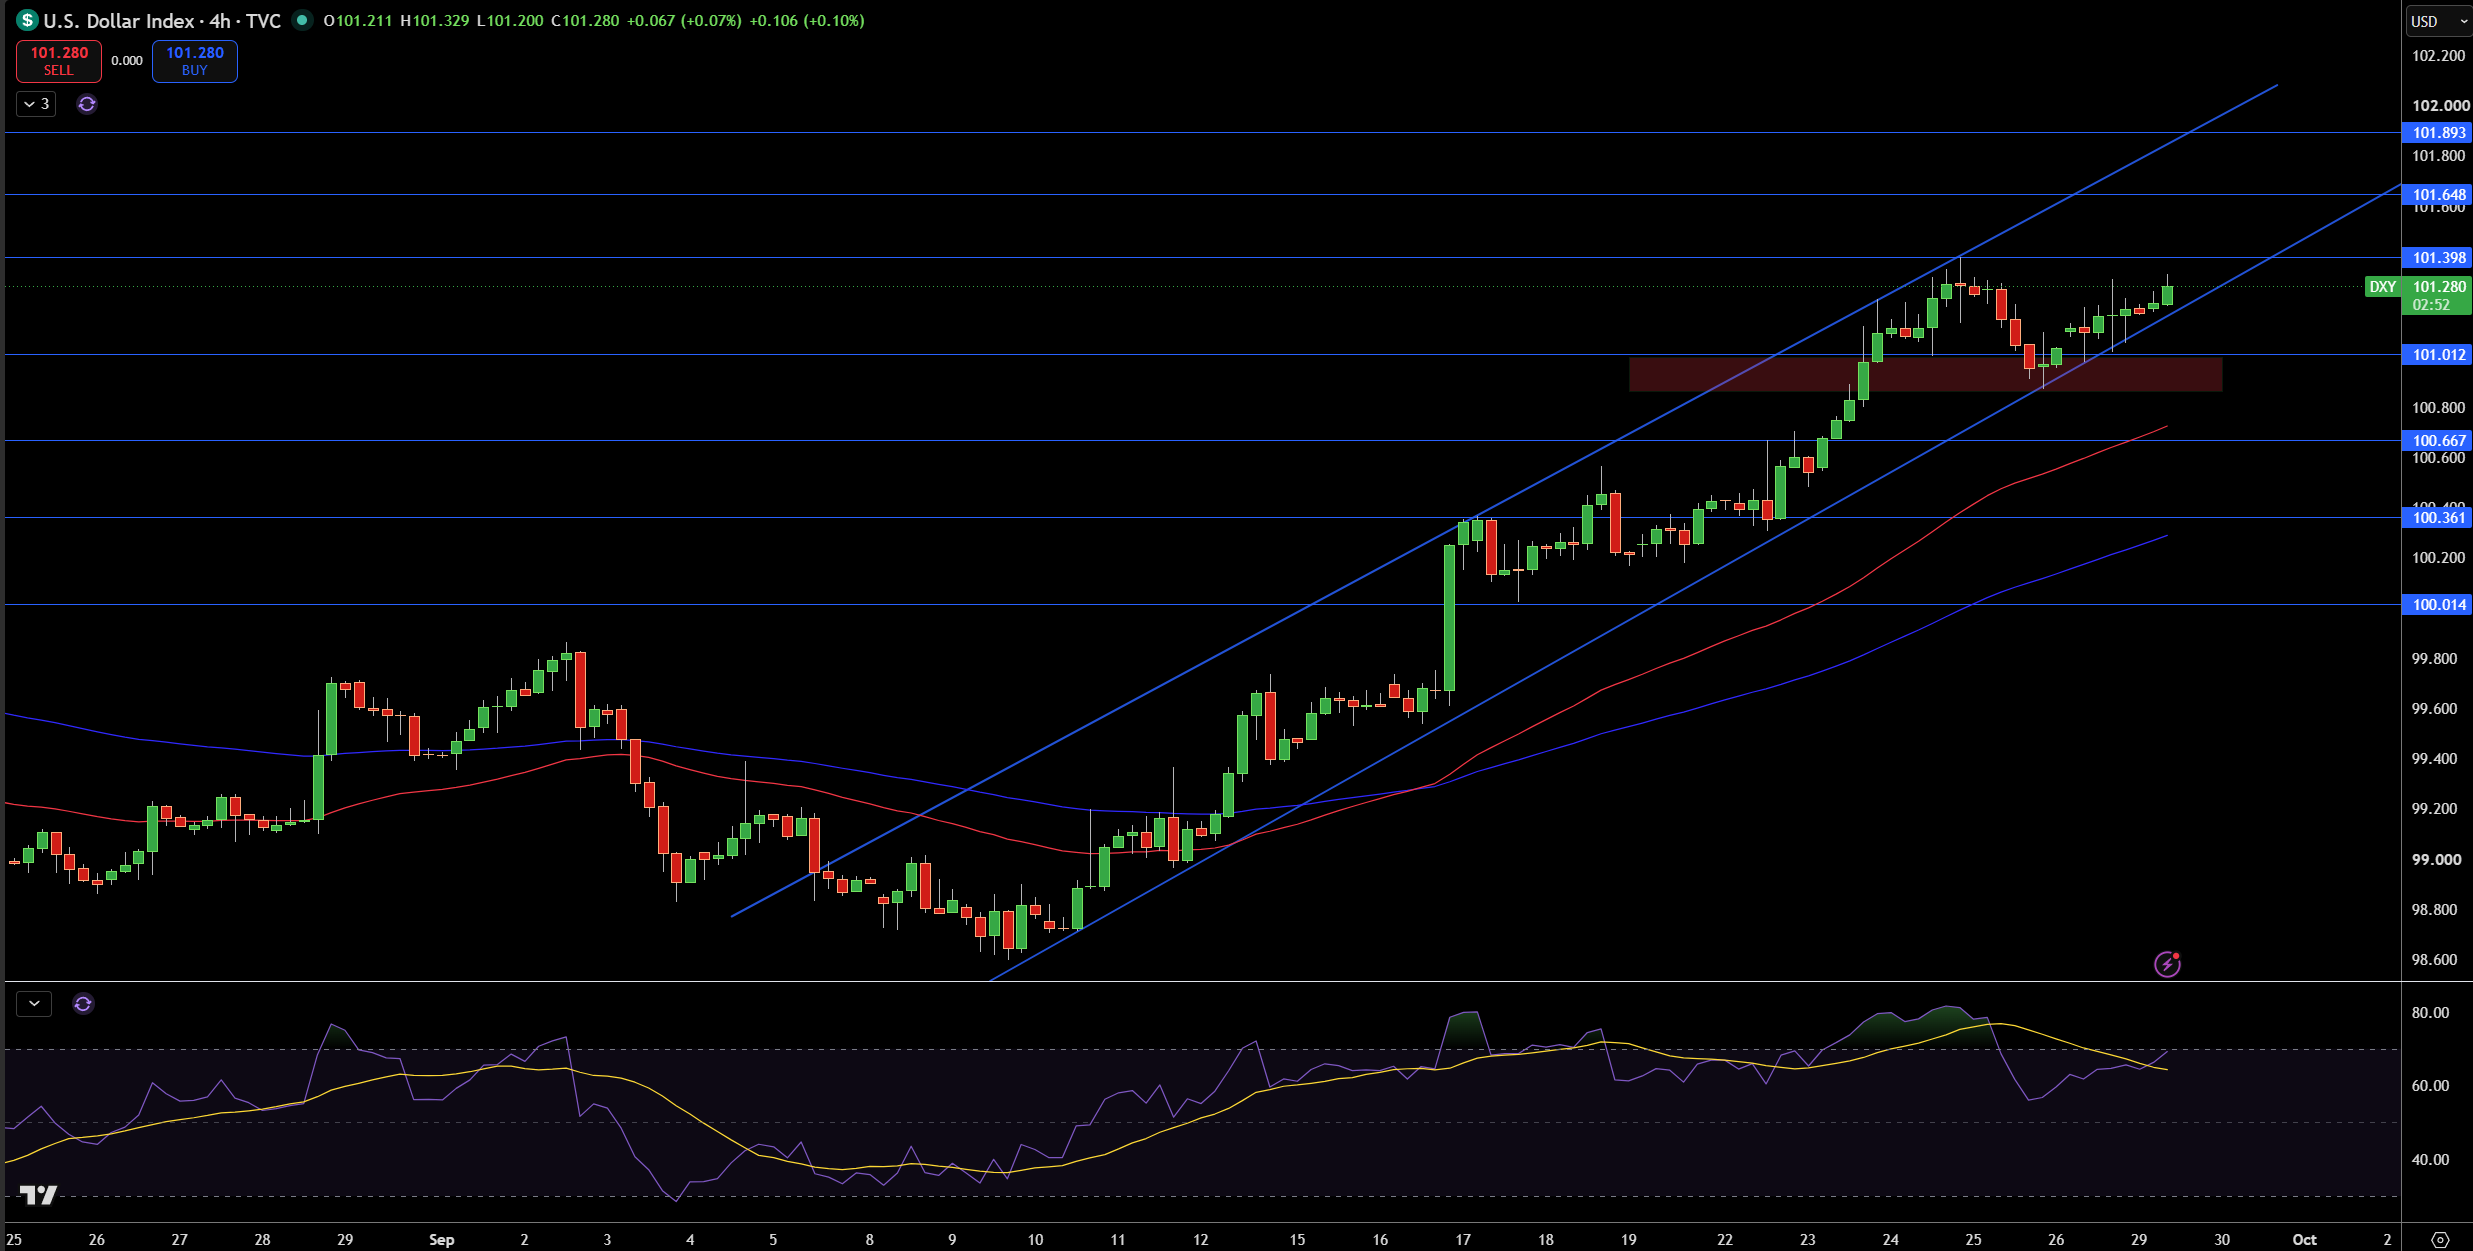
The U.S. Dollar Index is currently trading at 101.28 and is approaching rising trend line resistance on the 4 hour time frame. In the near term, the Index is expected to continue trading in the rising channel. The higher lows trend line support has been tested at 101.01 and as long as it holds, it should continue to push higher.
The first resistance is expected at 101.40. Sustained trading above this level should bring 101.65 into focus, and if broken, should bring 101.89 into focus. The trend line support should come into play at 101.01, and in the event of a breakdown of the channel, support should then be expected at 100.67, 100.36, and 100.01.
The Rising channel and higher lows should continue to push the index higher in the near term, but should it break support at 100.67, the trend would likely be in question. Conversely, an upside break and daily close above 101.40 should have a high probability of bringing 101.65 and 101.89 into the equation in the near term.
EUR/USD Price Forecast
Every new EUR/USD analysis as it publishes, today's technical signal and key levels, live price — on one page.
See all EUR/USD forecastsGBP/USD Technical Analysis: Sterling Holds 1.3205 as 1.3250 Remains the First Recovery Hurdle
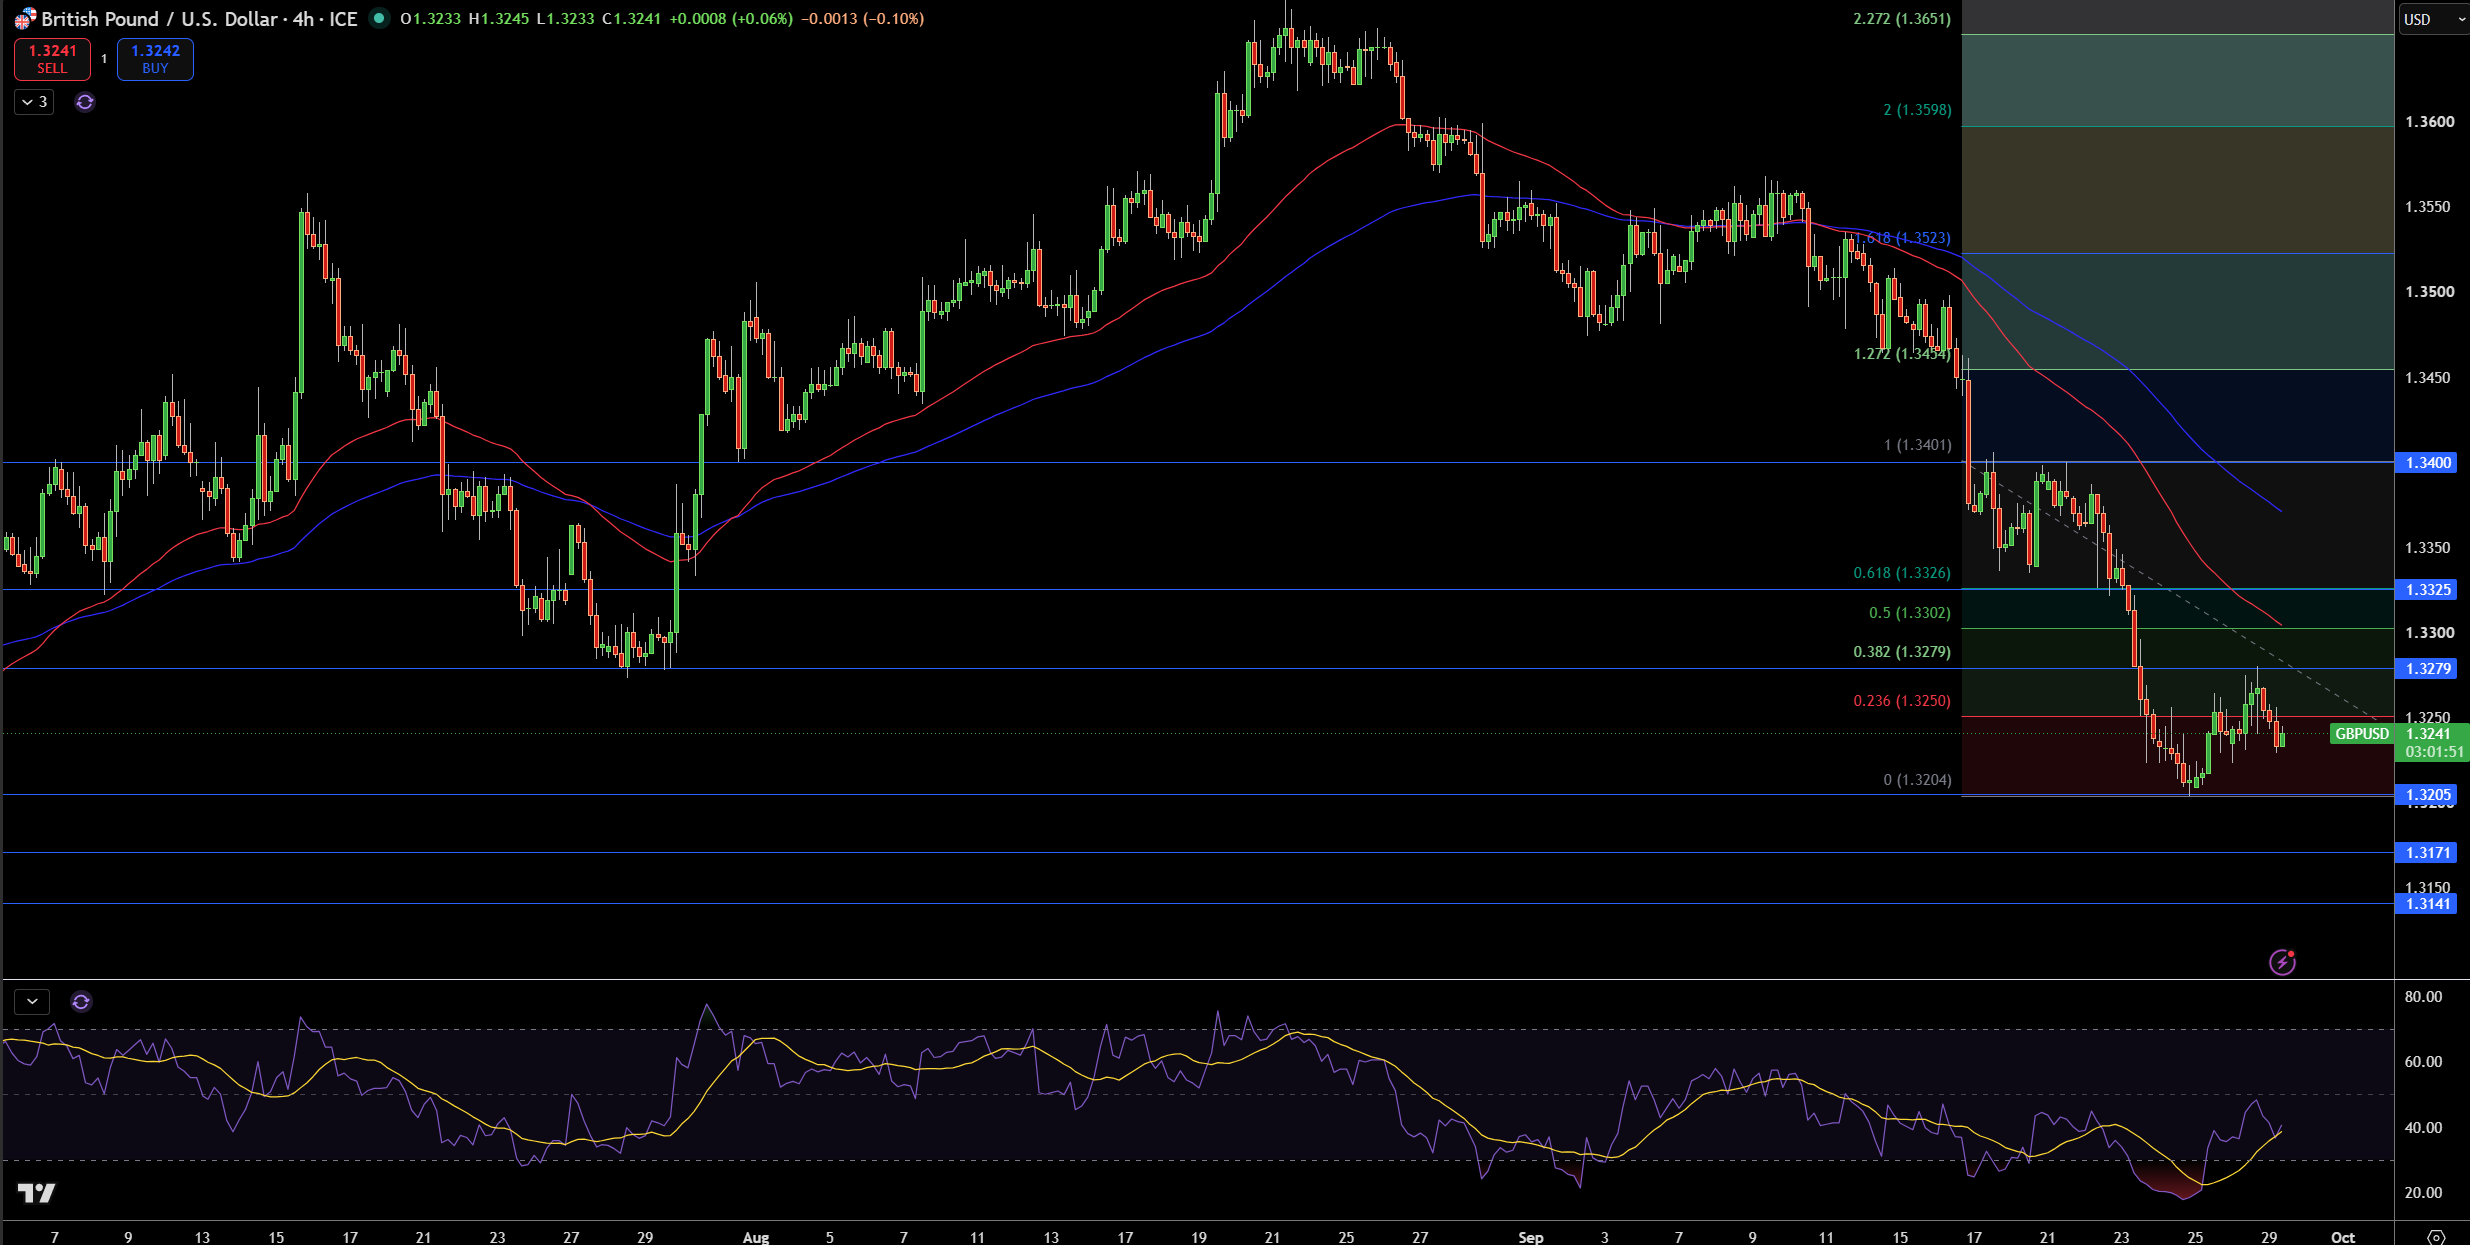
GBP/USD is currently trading at 1.3241. 1.3205 provided support and 1.3250 is the first resistance level. Price is below the 100 and 200 SMAs, and in a longer-term bearish trend. Recently, price has traded in a tight range and has not broken below the recent lows.
If prices rise, 1.3250 provides resistance and a move above this level would open a longer-term bearish trend and expose 1.3279. 1.3302 and 1.3325 provide resistance levels. If 1.3205 is broken, support would be found at 1.3171, and 1.3141.
Rising prices suggest a retest of 1.3250. If prices move below 1.3205, we could see a retest of 1.3171 and 1.3141. The RSI moving average is in a downtrend and neutral, suggesting prices are in a longer term downtrend. I would look for opportunities to sell if prices rise to 1.3250 and 1.3279. 1.3302 would negate this analysis and suggest a buy.
EUR/USD Technical Analysis: Euro Holds 1.1325 Support as 1.1412 Caps the Recovery
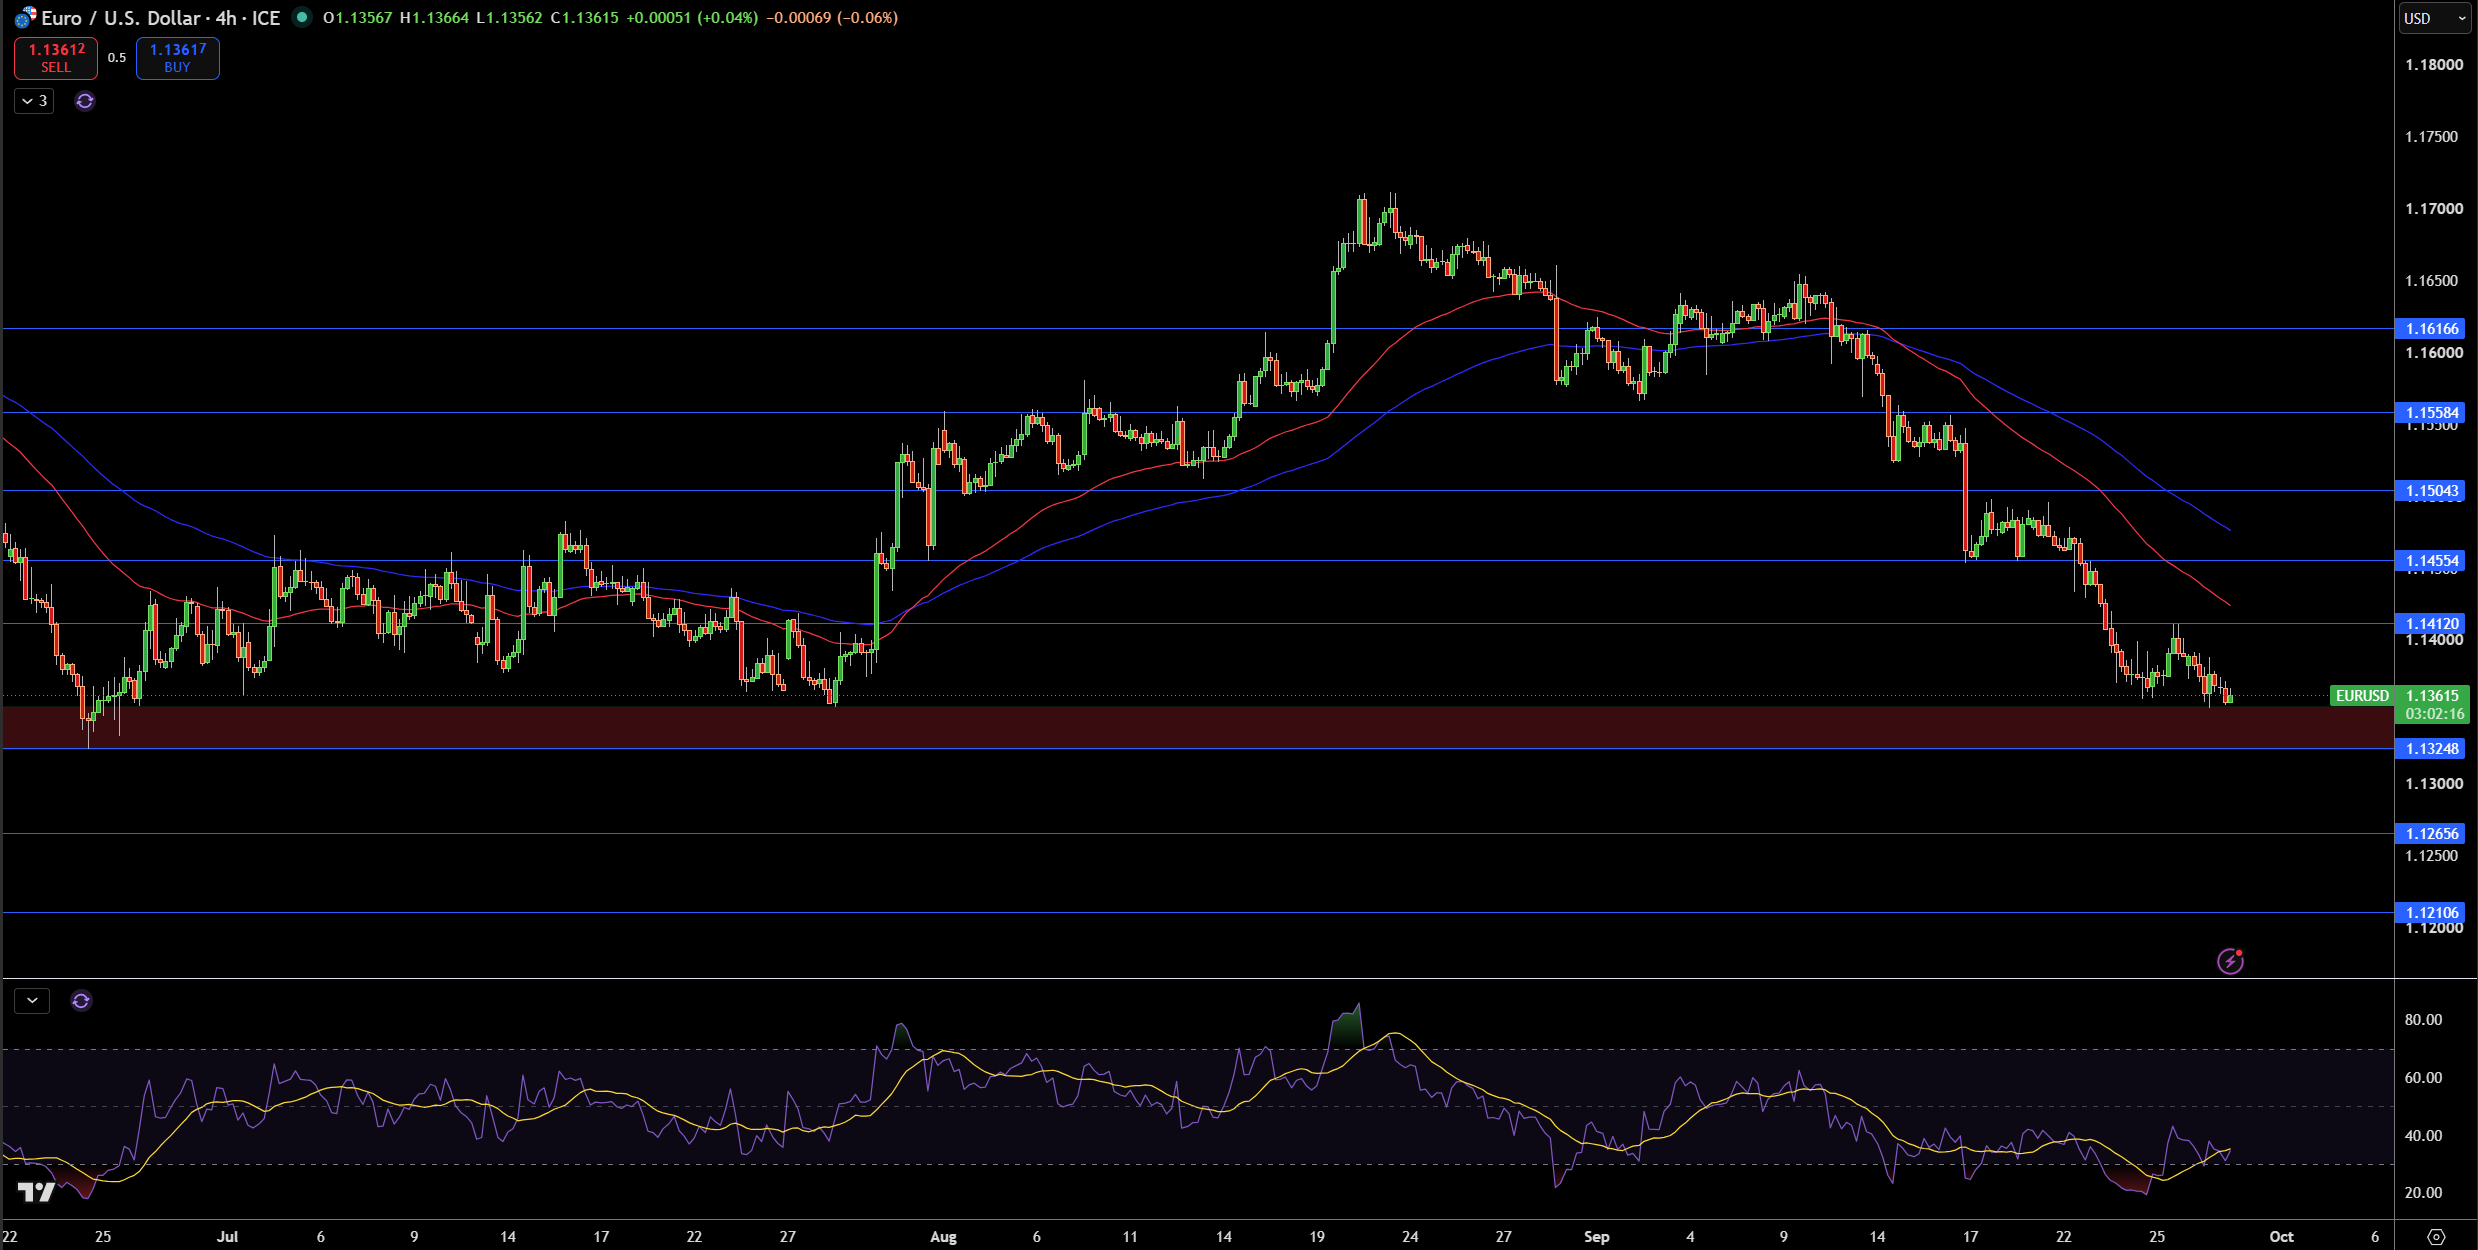
The EUR/USD pair is currently trading at 1.1362, and is showcasing further signs of weakness after recently sliding beneath the 1.1325 support zone. Below both of the moving averues, and in a lower high formation, the pair has further potential to the downside, and could still be in a short term formation.
I will be looking for the first significant level of resistance to be near the 1.1412 level. If the pair is able to rise above 1.1412, further resistance may come in near 1.1455, 1.1504 and 1.1558 respectively. If current support at 1.1325 is broken, further support may come in near 1.1266 and 1.1211.
While RSI has been showing some bullish signs near oversold territory, I believe further downside may be limited at the current time. If current support is broken, I may gain a bearish bias near 1.1266. I would gain a bearish bias near 1.1412 if it is tested and broken, and would need to see a bullish move above 1.1455 to negate my current bearish bias.