
Oil prices increased for a second day on Tuesday as traders watched the Strait of Hormuz and talks between the US and Iran. Brent oil climbed above $103.60 a barrel in early Asian trade. WTI oil traded above $93 earlier in the session. The talks have yet to produce a breakthrough, so the risk of another disruption in supply continues to support prices.
Saudi Arabia and the UAE are shipping more oil but some cargoes still need costly transfers between ships. So the rise in exports may offer less relief than the numbers suggest. In my view, Brent could move toward the $110 level if the talks between the US and Iran stall. A progress toward normal shipping through the Strait of Hormuz would take some pressure off prices.

WTI Crude Oil Forecast: $93 Support Puts $104 in View
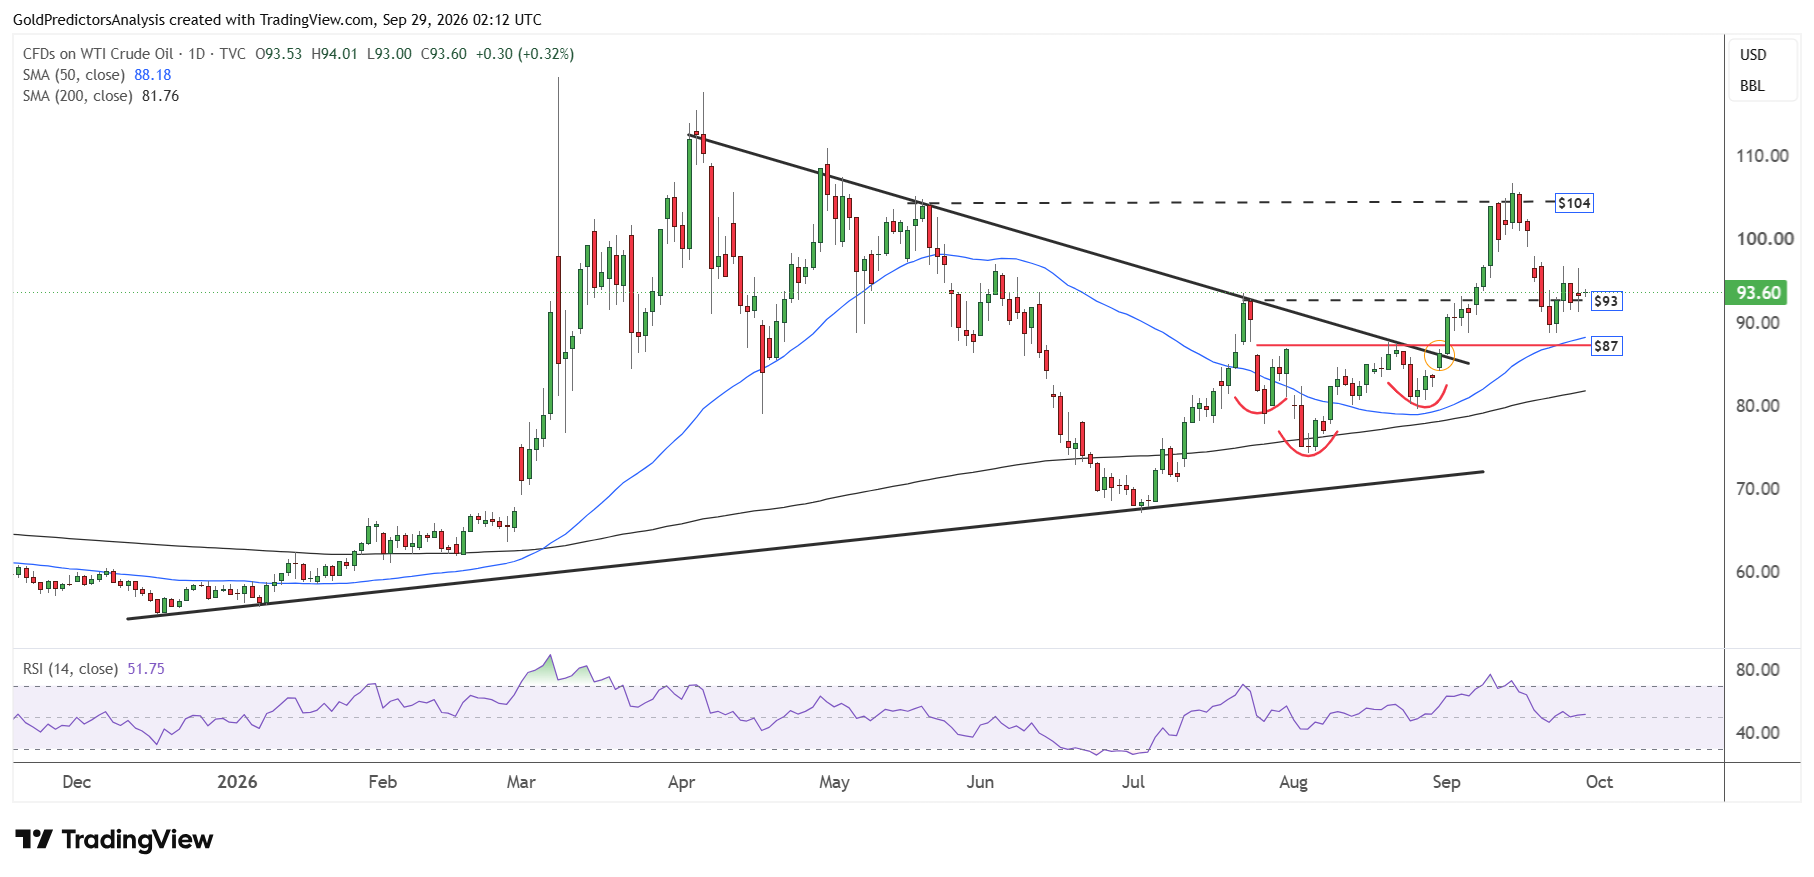
The daily chart for WTI crude oil shows that the price remains above the $93 support on Tuesday and is looking for the next direction. A break above the $97 area will open the way for further upside toward $104.
However, a break below $91 will likely open the way for a drop toward $87. The strong support in the WTI crude oil market remains in the $87 area.
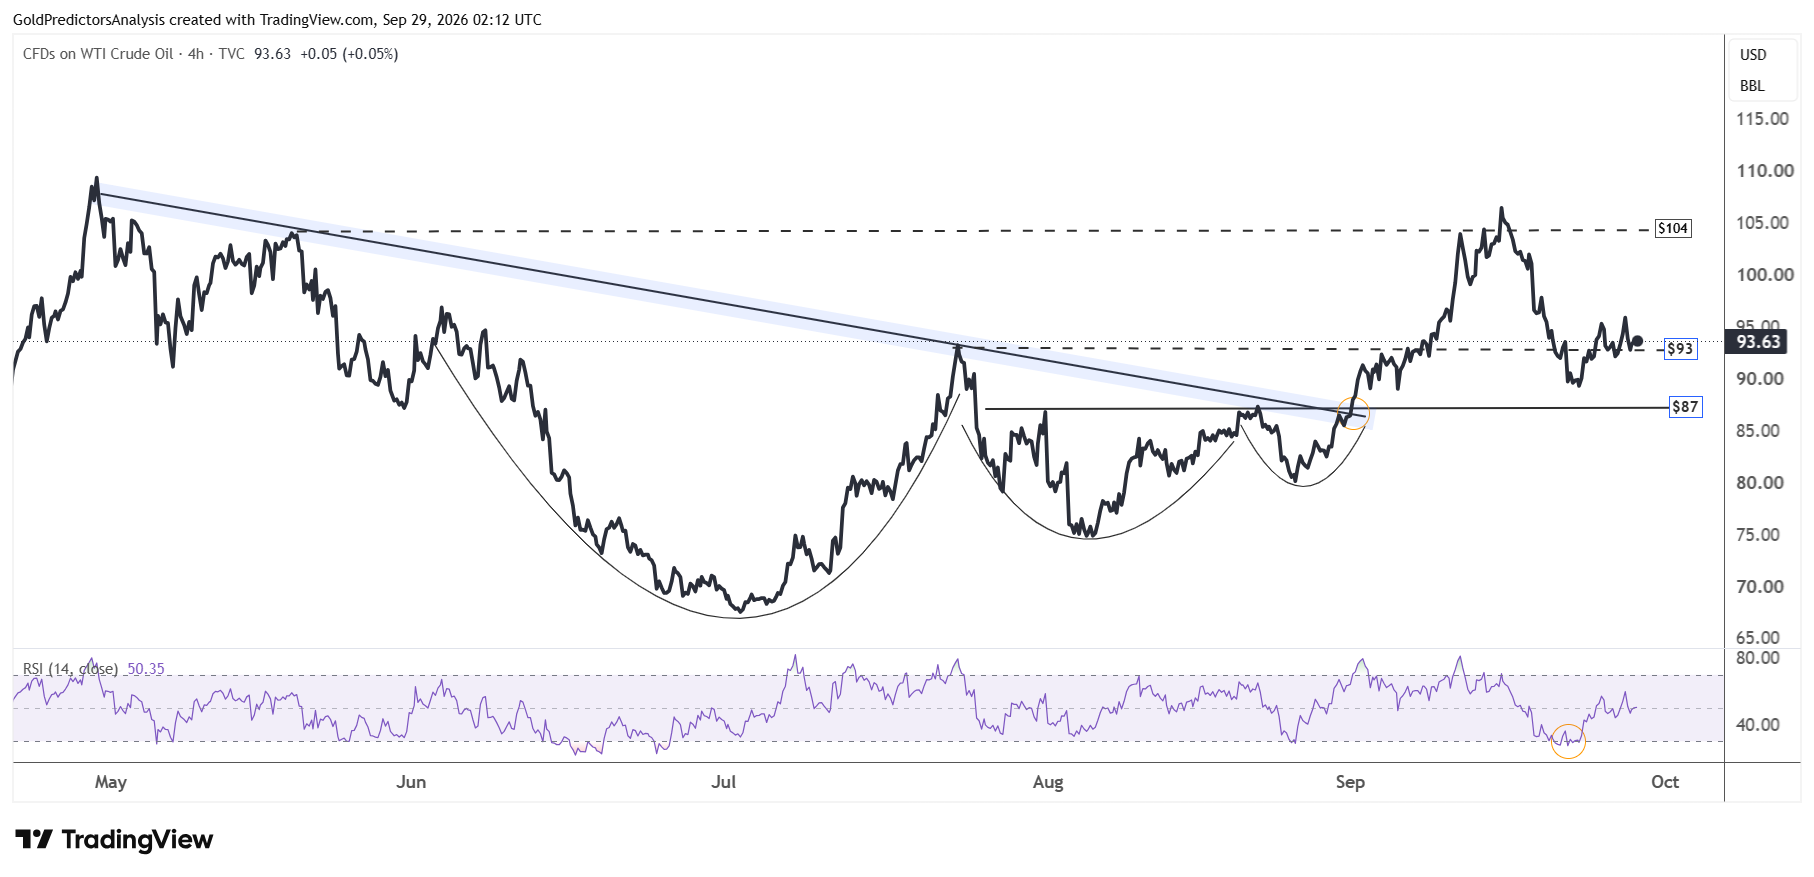
The 4-hour chart for WTI also shows strong consolidation above the $93 area. Overall, the price structure remains bullish, but volatility is still high in the oil market due to supply disruptions in the Middle East.
The weekly chart for WTI crude oil shows that prices have remained between $70 and $120 during the past few months. Despite the strong volatility, the RSI remains above the midline, which suggests positive momentum.
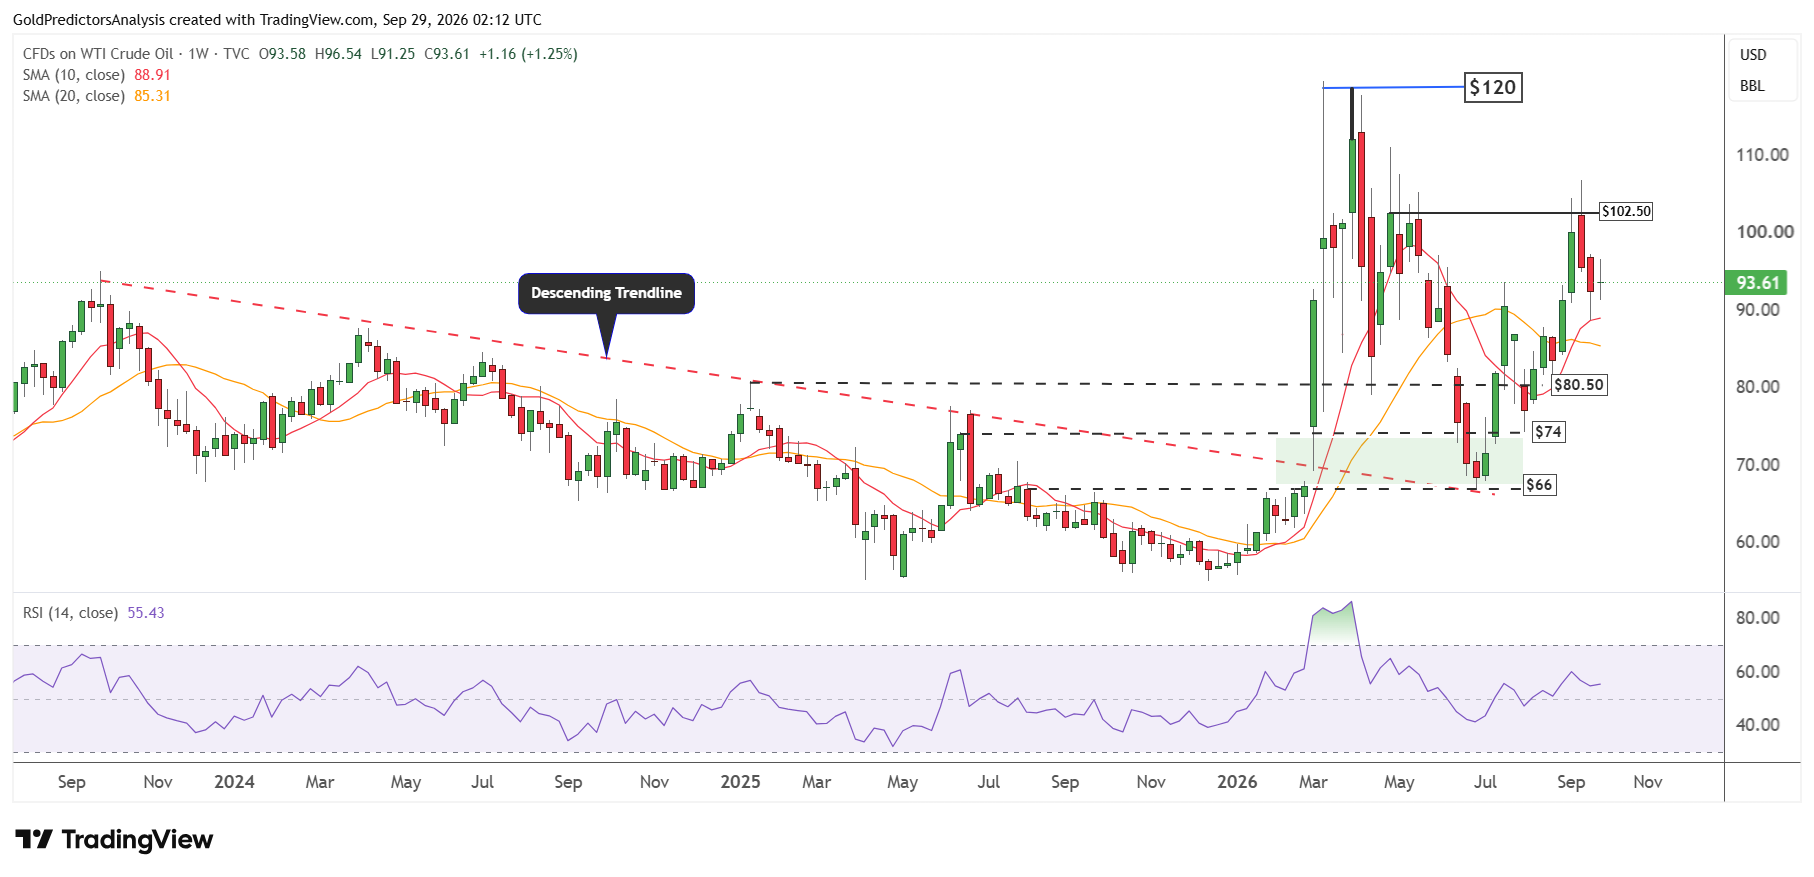
A weekly close above $102.50 is required to keep the strong rally in the WTI market moving towards the $120 area. Crude oil prices also remain above the 10- and 20-week moving averages. The rally last week followed a strong rebound from the support of the 10-week moving average.
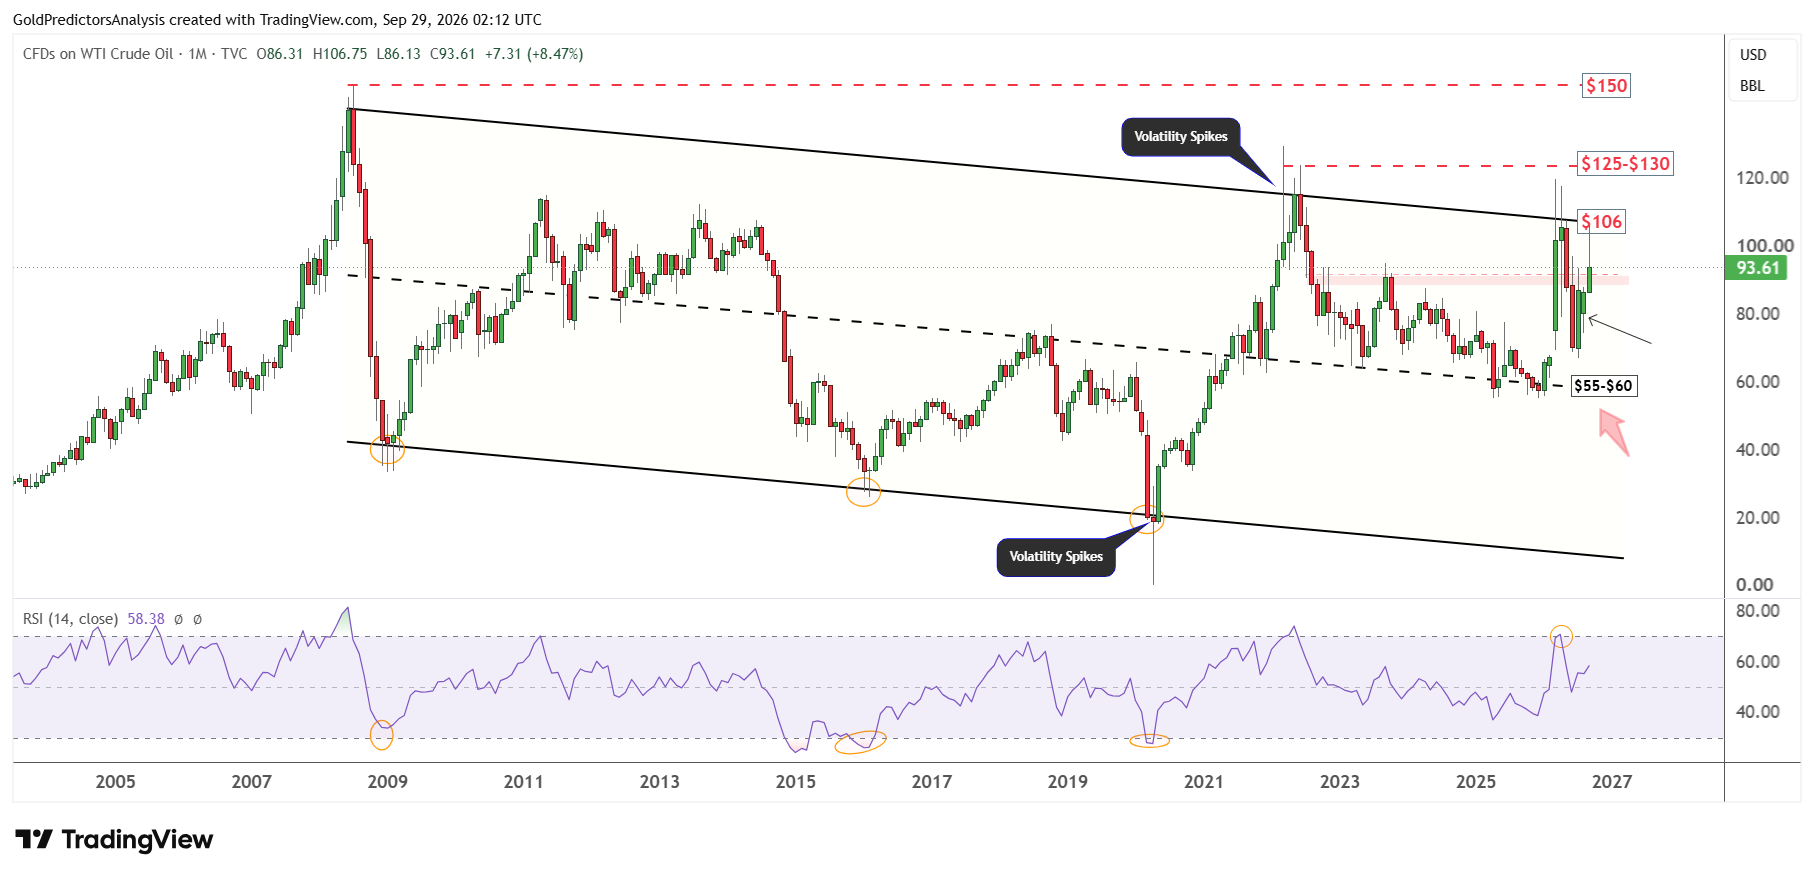
The importance of the $106 resistance is seen on the monthly chart below. The chart shows that $106 remains the key resistance marked by the descending channel that stretches from the July 2008 highs.
A monthly close above $106 is required to push prices towards the $125-$130 area. The RSI also remains above the midline on the monthly chart, which suggests a positive trend in the oil market.
Brent Oil Price Forecast
Every new Brent Oil analysis as it publishes, today's technical signal and key levels, live price — on one page.
See all Brent Oil forecastsBrent Crude Oil Forecast: $100 Support Keeps $113 in Focus
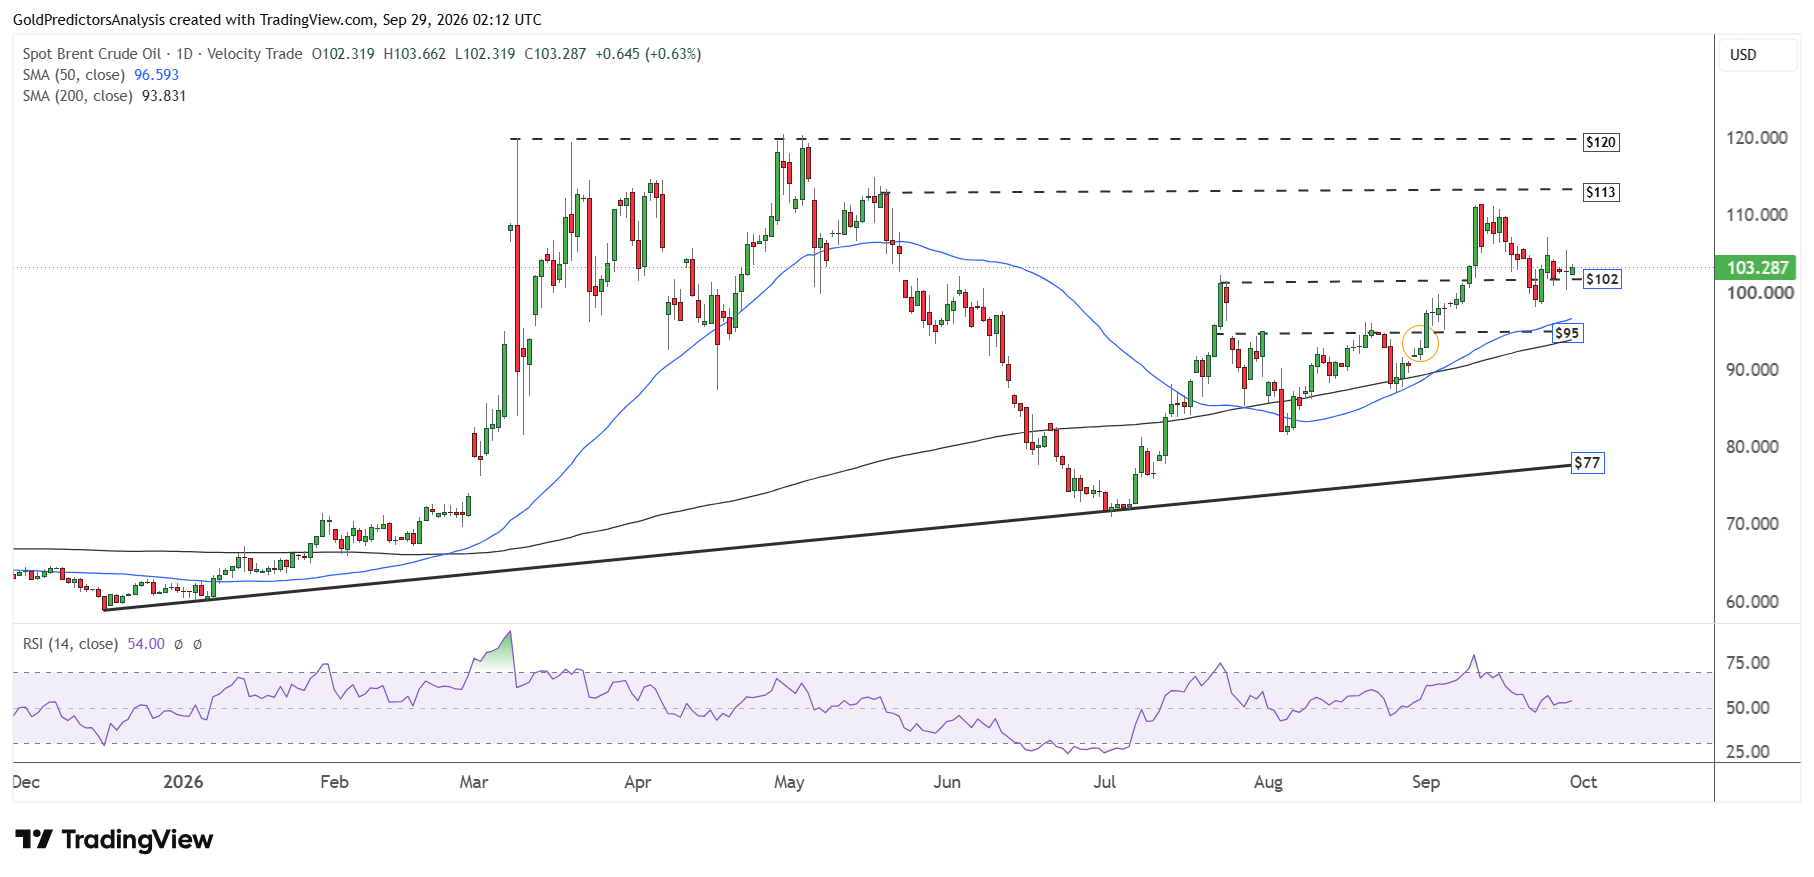
The daily chart for Brent crude oil also shows a positive trend in the short term on Tuesday. The price remains above the $102 area and looks to move towards the $113 level.
A break above $113 is required to push Brent crude oil towards the $120 area. On the other hand, the immediate support for Brent oil lies at $95. A break below $95 will likely open the way for further downside towards the $77-$80 support area. The RSI remains above the midline, which suggests a positive move toward $113 in the short term.
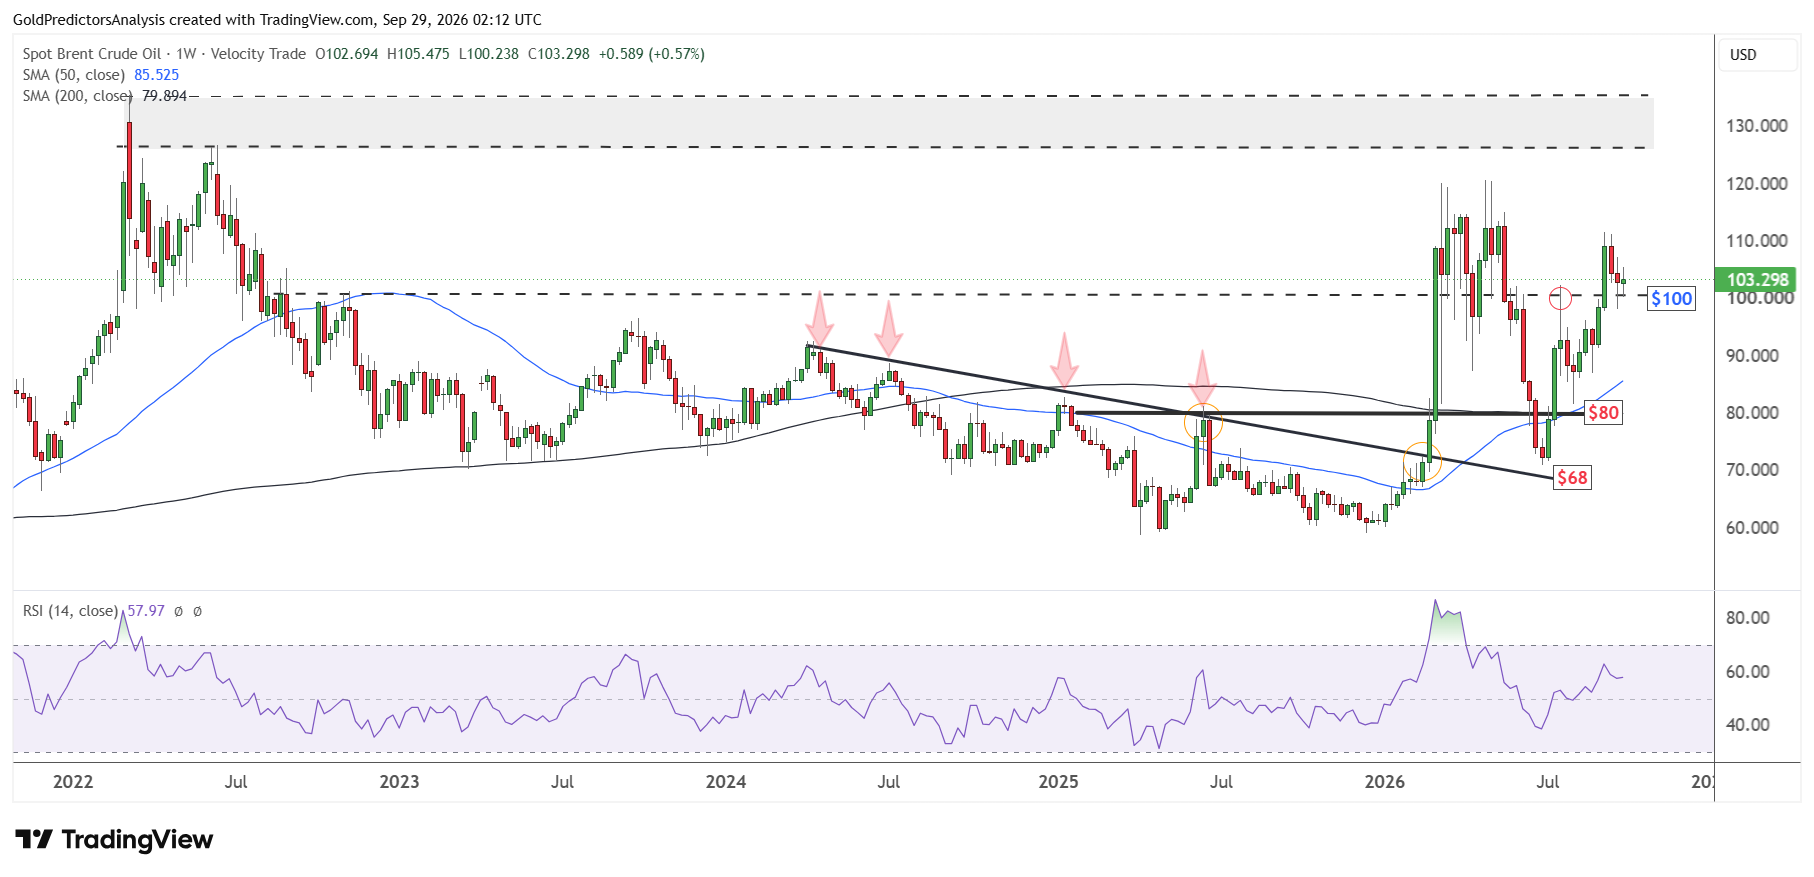
The weekly chart for Brent oil also shows that the price remains above the $100 area despite the recent correction during the last two weeks. As long as the $100 support holds for Brent oil, the possibility of a strong rally towards the $120 area is high.
Bottom Line
Oil prices may remain volatile as traders wait for progress in talks between the US and Iran. The higher exports from Saudi Arabia and the UAE could limit gains, but costly shipping still puts supply at risk. WTI needs to hold above $93 to keep the rally to $97 and $104 in the short term. Brent oil needs to stay above $100 to test $113. If shipping through the Strait of Hormuz returns to normal, some of the pressure supporting prices could fade.
Read more: WTI and Brent Slip as Iran Keeps Talks Open