


Support Breakdown Strengthens Bearish Pressure
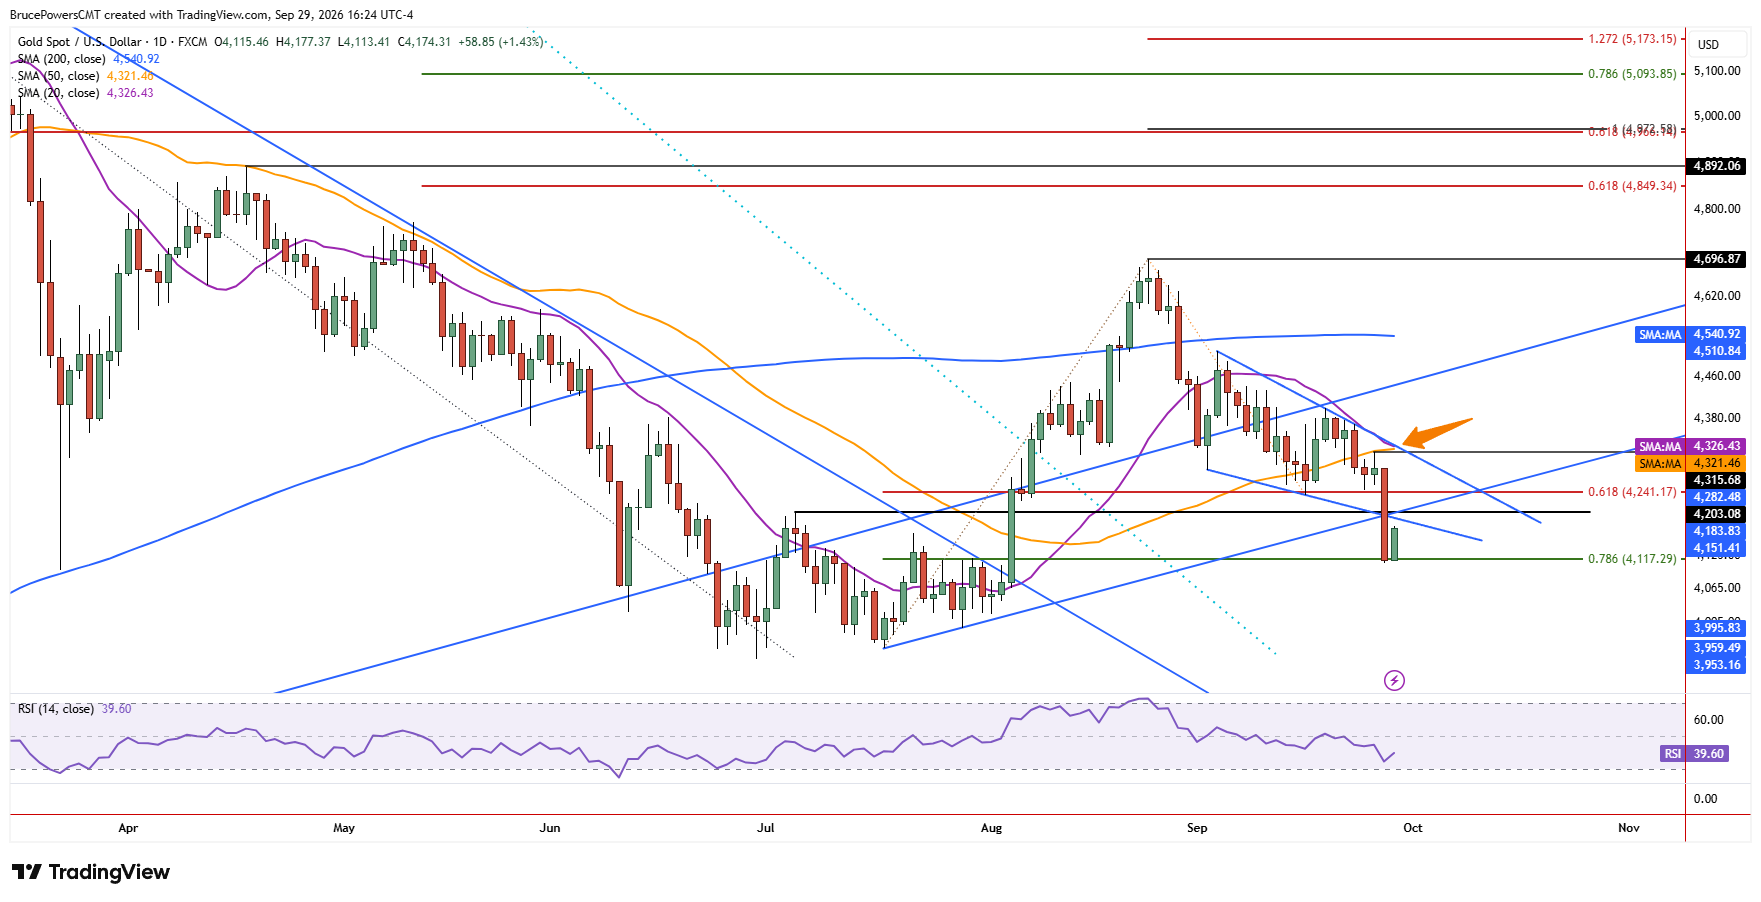
Bearish implications for gold have increased this week as Monday’s break below a key support zone confirmed a renewed shift in control to sellers. The larger bearish correction is therefore reasserting itself. The recent low of $4,235 had established support near the 61.8% Fibonacci retracement level, but both levels failed to hold on Monday. Aggressive selling followed the breakdown, with the next lower potential support zone also failing to hold.
That zone included the prior swing high of $4,203, which previously served as key resistance for the bottom consolidation range, as well as a short-term uptrend line, and the lower boundary of a falling wedge pattern that never confirmed. The failure of this confluence of support adds further weight to the bearish breakdown.

Moving-Average Resistance Confirms Selling Pressure
Additional bearish evidence includes the failure of support at the 50-day moving average last Wednesday and the minor pullback that followed two days later to test it as resistance. That pullback produced the last short-term high before Monday’s sharp selloff, reflecting increasing selling pressure and confirming the failure of the 50-day moving average as support. Moreover, last Wednesday’s resistance high of $4,316 is being reinforced by the falling 20-day moving average, which recently aligned with the upper boundary of the wedge formation, adding to the potential for resistance near that area.
Lower Fibonacci Support Becomes Critical
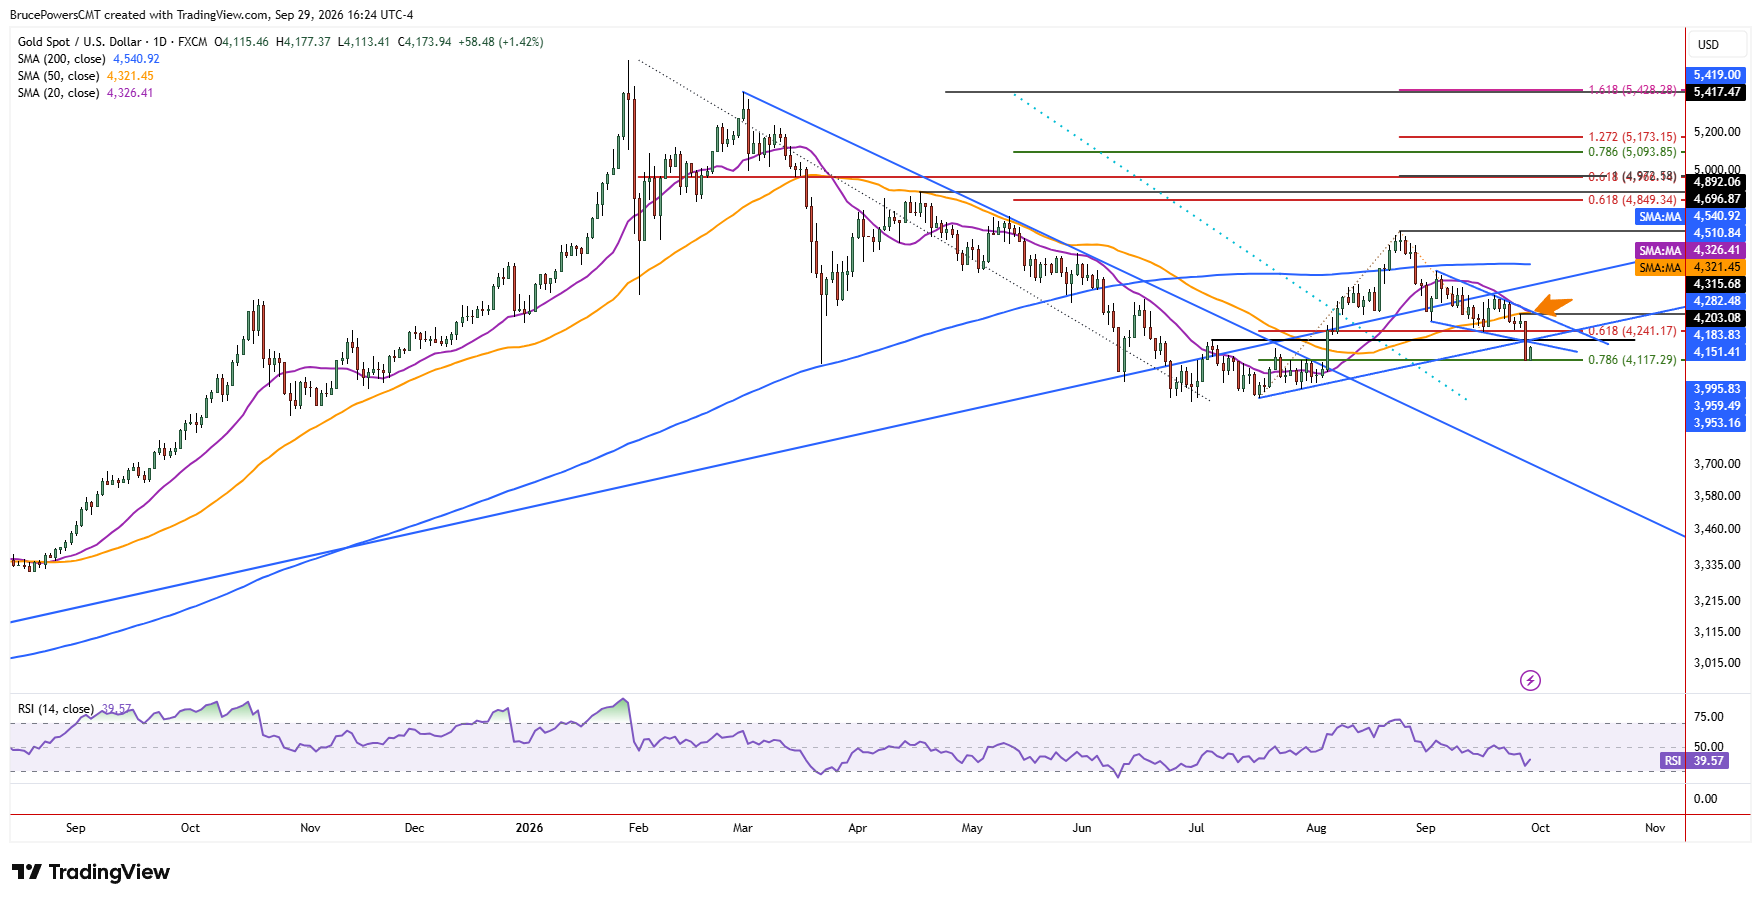
Gold had previously respected the 61.8% Fibonacci retracement level, but after that support failed, support has now been seen near the 78.6% Fibonacci retracement of the prior advance with Monday’s low of $4,111. Although this level might result in a bounce to test prior support as resistance, the bearish implications of the larger trend structure increase the chance that rallies will eventually be met with resistance, resulting in further downside pressure.
That creates potential short-term opportunities on rallies, but the broader bias remains bearish unless gold can reclaim and sustain trading above the 50-day moving average, currently near $4,321. Monday’s breakdown has therefore shifted the focus from defending support to identifying where the next rally may encounter resistance.
If you’d like to know more about how to trade gold and silver, please visit our educational area.


