WTI Crude Oil Technical Analysis
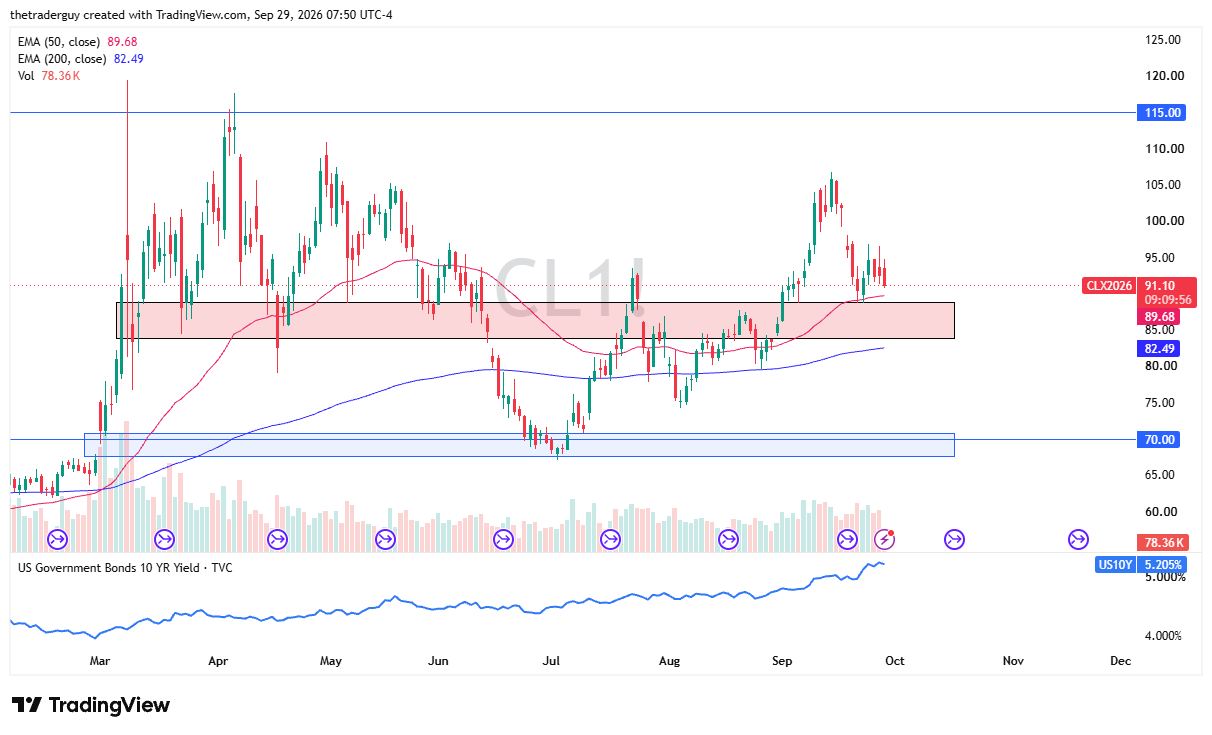
The light sweet crude oil market has fallen after initially gapping higher to kick off the trading session. We are now testing the crucial 50-day EMA.
The 50-day EMA is an indicator that a lot of people will use for dynamic support and resistance. Of course, we are getting fairly close to the $90 level. We are just a little bit over a dollar above there, and that is an area that has been interesting from both a support and resistance standpoint for some time now.
Anything below there opens up a squeeze between the 50-day EMA and the 200-day EMA indicators. The $95 level above is short-term resistance, although we have pierced it several times over the last couple of trading days.
Keep in mind, this is all based on the idea that perhaps more oil is getting through the Strait of Hormuz. That, of course, will affect the supply and demand equation.

Brent Oil Technical Analysis
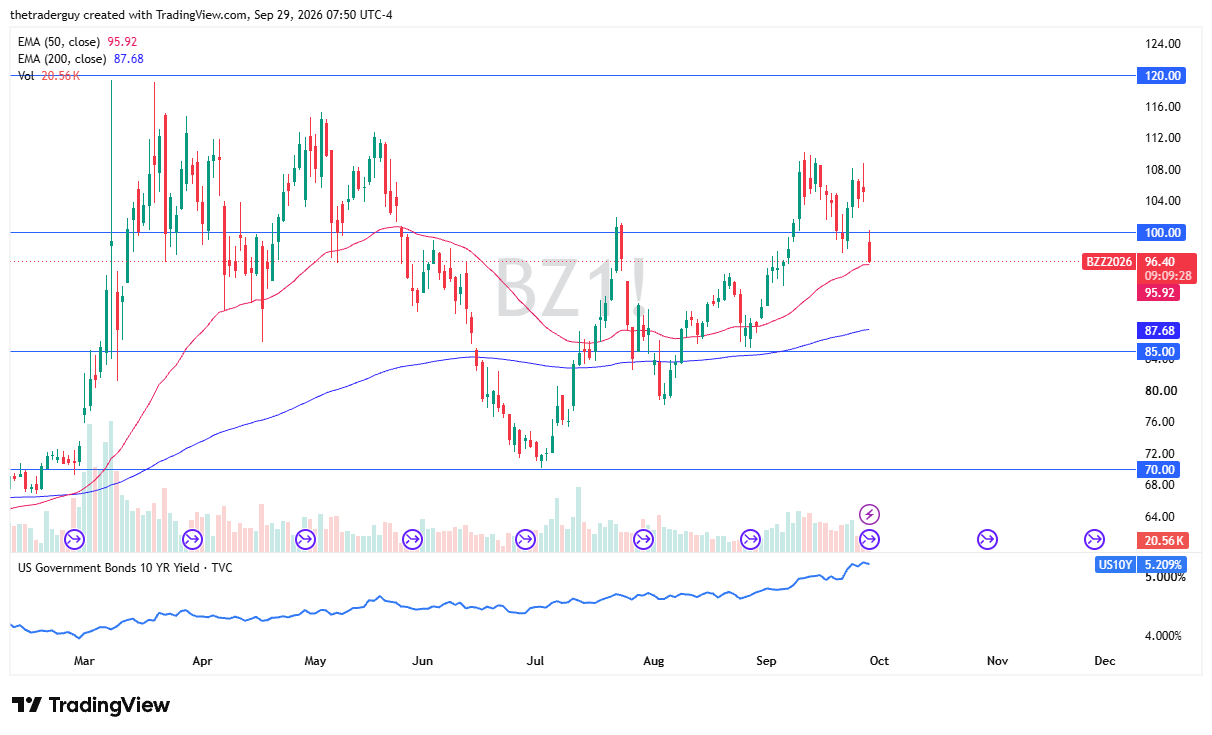
Brent markets have gapped lower on the rollover. We are switching over into the next contract, the month of December here, and we are right at the 50-day EMA. We are below $100. I do not read too much into that because of the rollover, but either way, it looks like we would be down regardless.
With that being the case, and the fact that the Strait of Hormuz may be supplying more crude, that is a good sign that maybe we need to drop. There are headlines out there about the United States and Iran speaking, but at the same time, the IRGC claims that the United States has no option but to admit failure and leave.
So, one of the biggest problems I think we have right now is that we do not even know who actually makes the decisions in Iran. These conversations may not matter. We just do not know.
That being said, we have a scenario that looks like oil is going to see a little bit of downward pressure. But on the longer-term chart, I still look at this as a market that value hunters will return to eventually. The fact that we are at the 50-day EMA is intriguing for those looking to get long.
Brent Oil Price Forecast
Every new Brent Oil analysis as it publishes, today's technical signal and key levels, live price — on one page.
See all Brent Oil forecastsIf you’d like to know more about how to trade natural gas, please visit our educational area.