Pullback Opens Door to Lower Channel Support
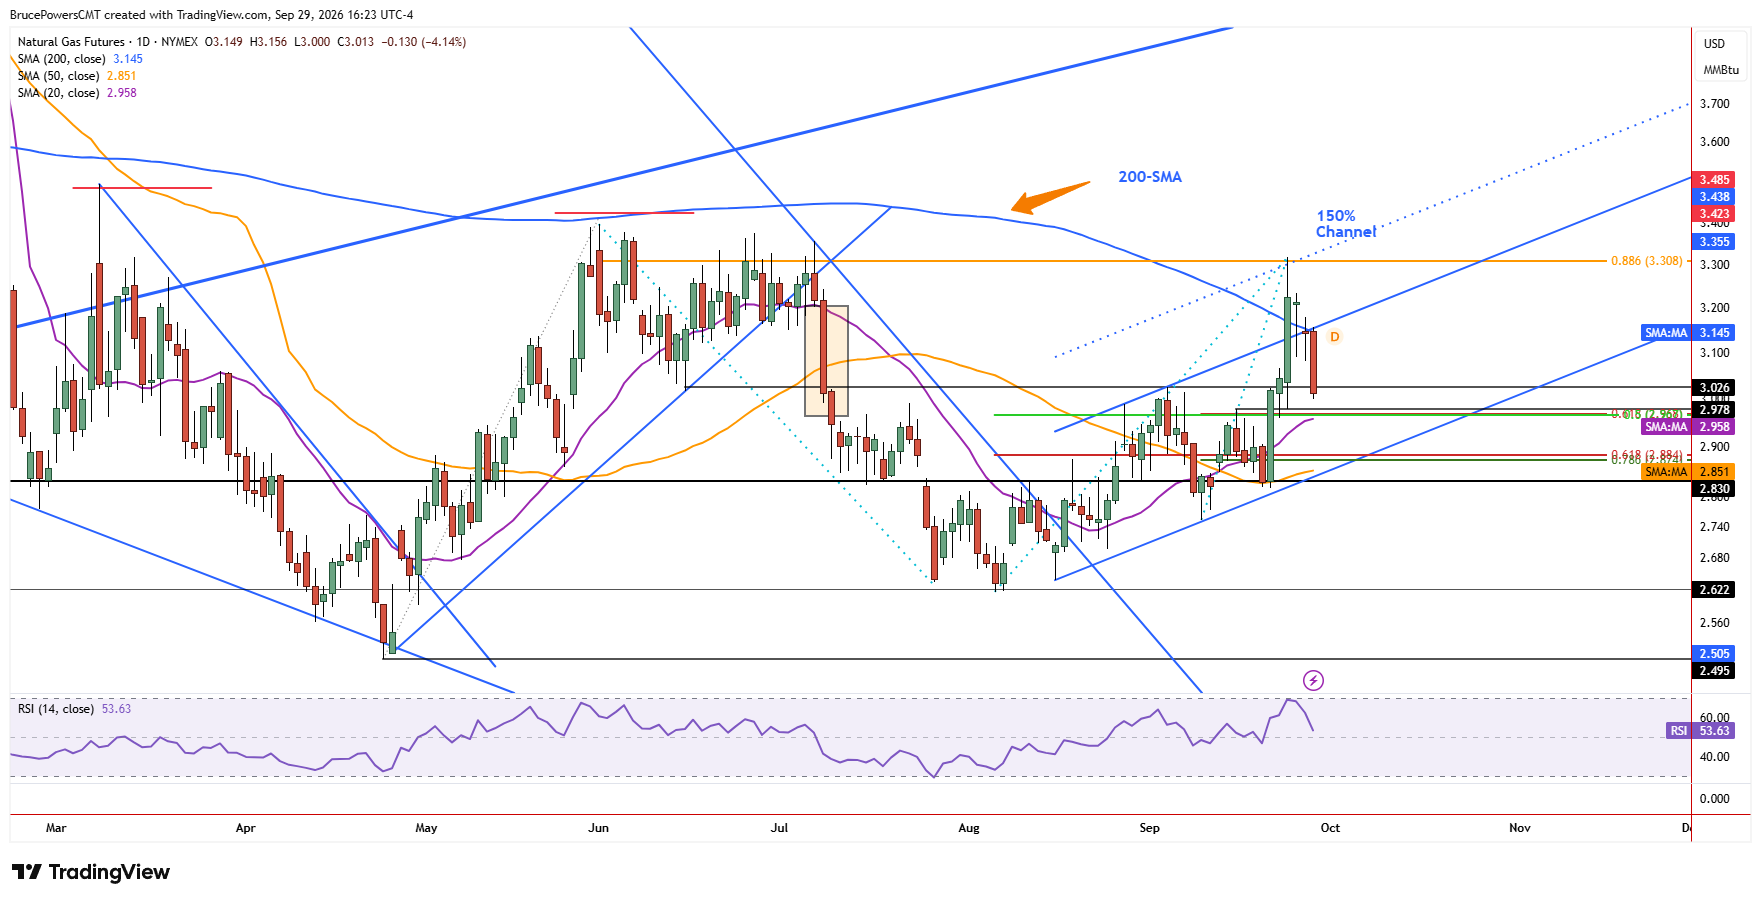
Natural gas deepened its pullback on Tuesday from last week’s high of $3.317, reaching a three-day low of $3.00. Although that low is now short-term support, clear signs of bearish momentum suggest that the next lower support zone from around $2.978 to $2.967 may be reached before a bottom is established. However, both the sharp advance that preceded this decline and the drop back into a rising trend channel indicate that this first potential support zone may not hold. The lower boundary of the channel is near the 50-day moving average at $2.85, which can be used as a proxy for the trendline for now.

Failed Support Turns Into Resistance
The potential for a deeper retracement is also supported by the confluence of key resistance reached with last week’s high of $3.317. An 88.6% Fibonacci retracement was completed during the advance at $3.308, and resistance was supported by the alignment with an upper boundary line for the channel. That upper boundary line extends the original channel by 50%.
Then, signs of weakness continued with a failure of support at the convergence of the 200-day moving average and the upper boundary of the original channel formation near the same price. Tuesday’s price action confirmed the bearish signal since the day’s lower daily high of $3.156 marked resistance at the confluence of the channel boundary and the 200-day moving average. Prior support has now switched to resistance, which is bearish.
Recovery Gives Way to Corrective Action
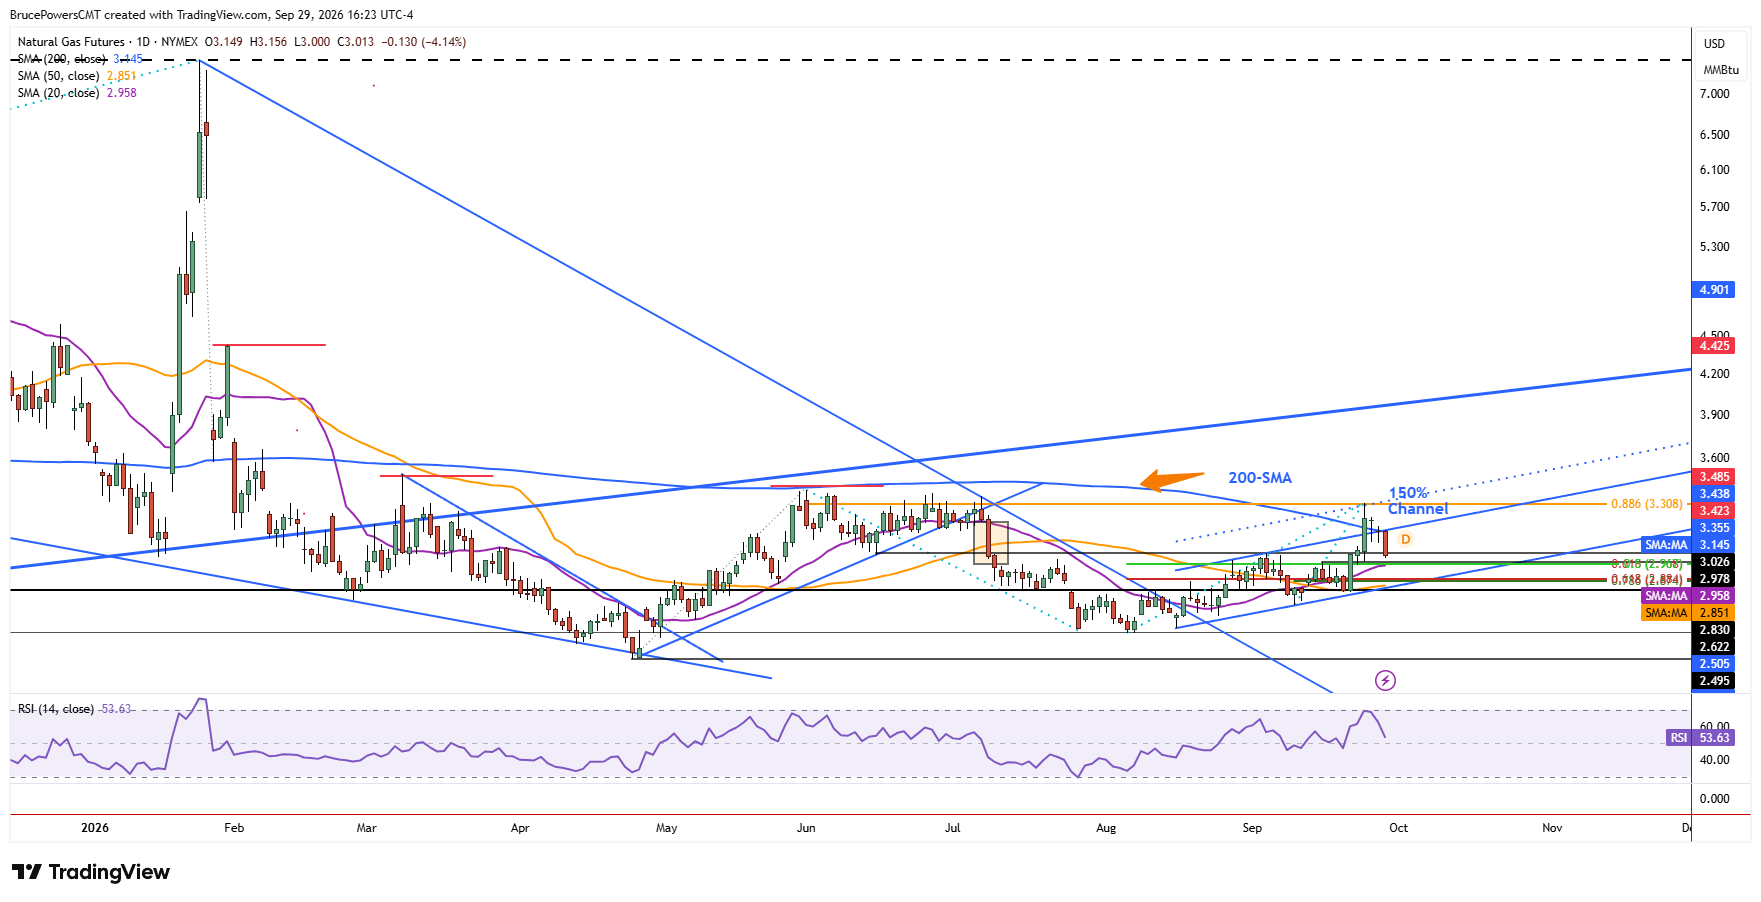
Given the potential for further downside, short-term signs of strength are anticipated to be met with resistance and further downside pressure. Last week’s high suggests that the recovery from the August bottom may have completed and the market needs to digest gains and move into a period of consolidation.
Weekly Range Frames Next Phase
Evidence of a potential transition to consolidation can be seen on the weekly chart. Last week established a wide range from $2.817 to $3.317, as volatility expanded during the advance. Subsequent trading within that range would show consolidation on that higher timeframe. This supports the possibility that natural gas may still be early in its next bearish correction.
Natural Gas Price Forecast
Every new Natural Gas analysis as it publishes, today's technical signal and key levels, live price — on one page.
See all Natural Gas forecastsIf you’d like to know more about how to trade gold and silver, please visit our educational area.