Spot Silver Reverses Earlier Weakness at Key Long-Term Support
Spot Silver (XAGUSD) traded under the 50% retracement of its all-time high Tuesday, hit $60.30 and was back above the level late in the New York session. Buyers didn’t just sit on bids at $60.84. Silver traded through it to $60.30 first, then came back over $60.84 and the $61.04 level. The swing from the low to the high of the day was $1.15. That’s more than an ordinary intraday bounce. Sellers had taken out the 50-day moving average and the $61.04 to $62.98 zone on the way down from $67.55. The 50% level is where they finally ran out of room. It took a lot of broken support to get there.
The dollar is through its September high and Treasury yields are sitting near their highs. Buyers showed up with both of them still pressing. The main trend is still down. This is the first real chance buyers have had to show the long-term value area is drawing more than passive bids.
At 19:05 GMT, Spot Silver is trading at $61.35, up $0.71 or +1.16%. It traded from $60.30 to $61.45.

The Dollar Is Still Pressing, and Silver Turned Anyway
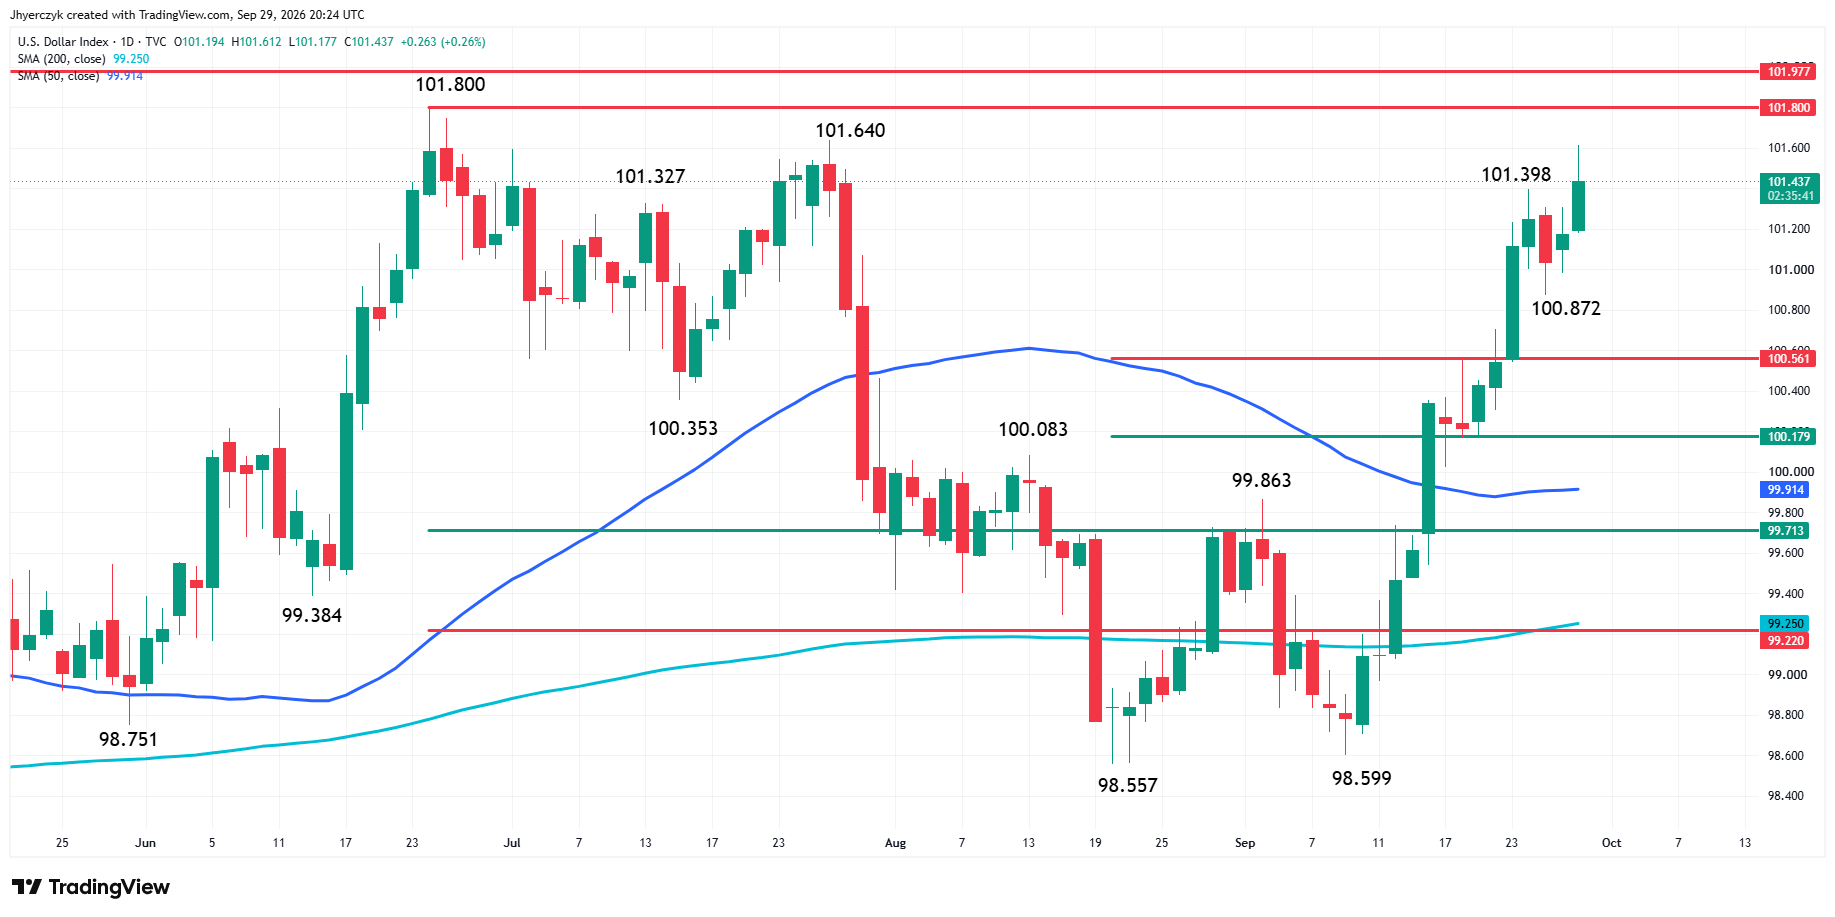
The Dollar Index is near 101.58. It cleared the 100.56 breakout level and took out the September high at 101.40 on the way there. Buyers are still taking it higher, with 101.80 and 101.98 next. Currency traders have a clear reason to own dollars right now. That’s a lot of dollar strength for silver to fight. Silver didn’t wait for it to stop.
Silver’s reversal came with the dollar through its September high. A bounce off a collapsing dollar wouldn’t have told traders much. This one came against it, and I’d pay more attention to that than to the size of the move.
Yields Haven’t Given Silver Buyers Any Cover
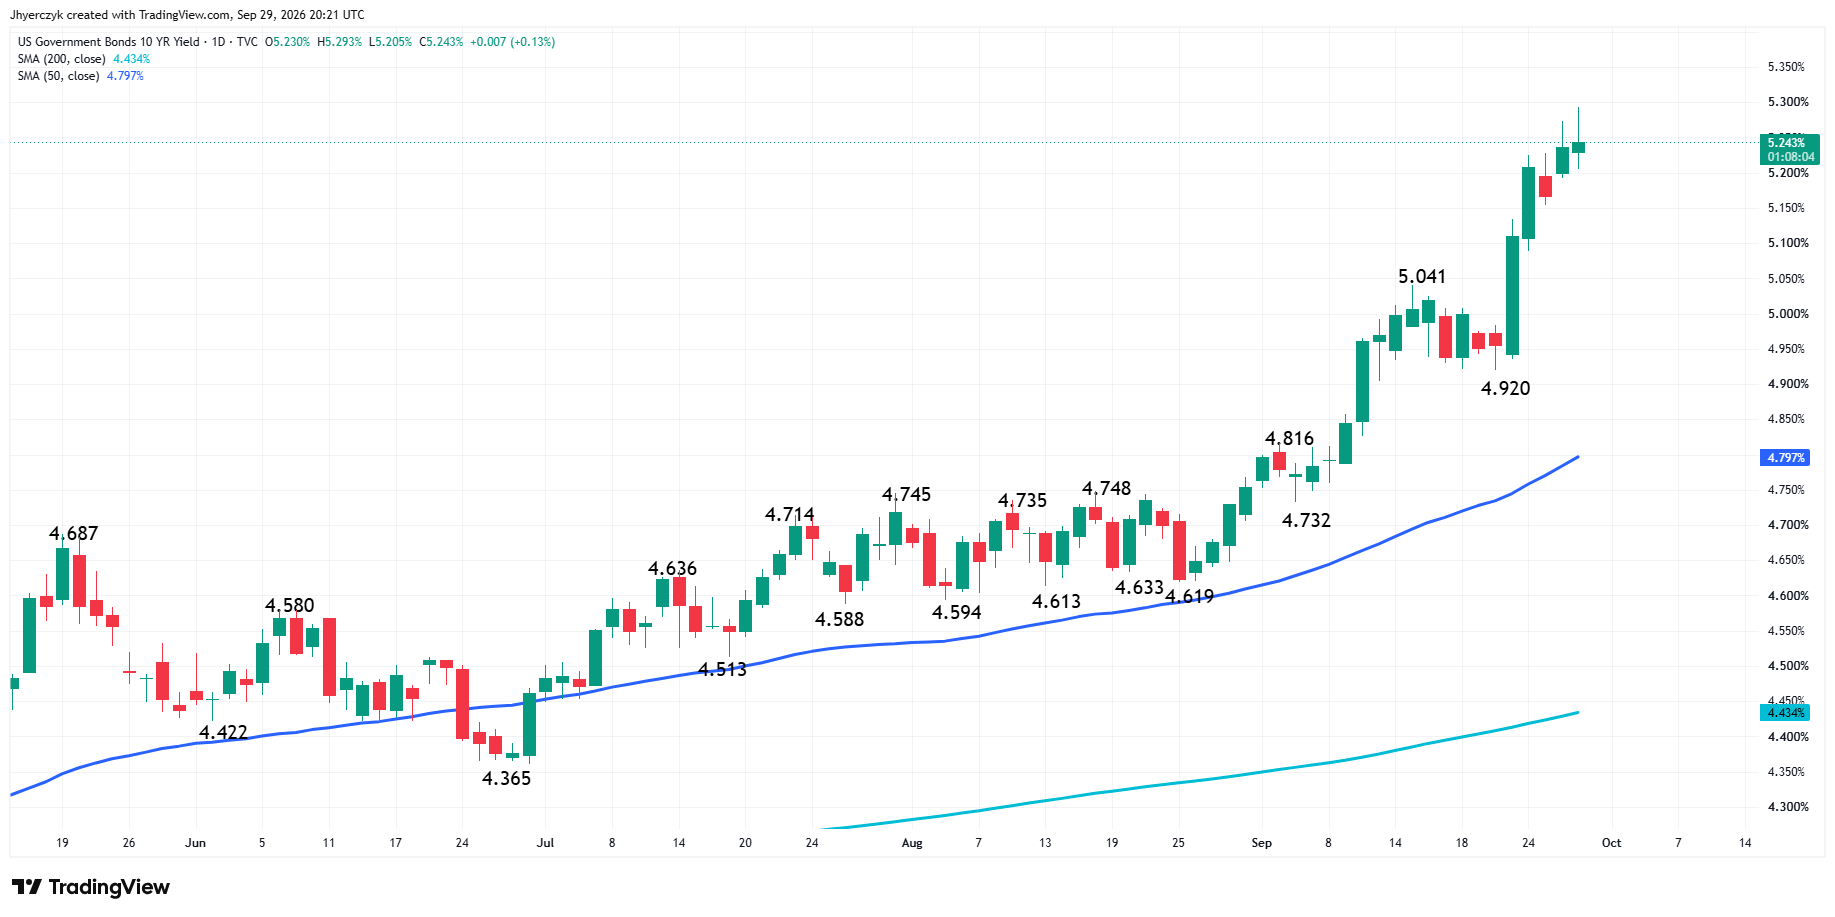
After touching 5.293% earlier in the day, the 10-Year U.S. Treasury yield is holding near 5.28%. The 5.04% breakout level and the 50-day moving average near 4.80% are well below it. The long end of the curve is still pricing inflation and higher rates. The 10-Year is a basis point off its high, and bond traders have barely backed off.
Silver found buyers at $60.30 with the bond market sitting right at its highs. The 50% level gave them a better risk-reward price, and they used it. Bond traders gave them nothing else to work with.
Silver Price Forecast
Every new Silver analysis as it publishes, today's technical signal and key levels, live price — on one page.
See all Silver forecastsPCE and Payrolls Decide How Far the Bounce Can Run
Oil is still elevated and inflation is still sitting in the rate trade. Traders are pricing a 68.1% chance of another quarter-point Federal Reserve hike in October. Crude is still one Middle East headline away from putting inflation back in front of the bond market. Silver can’t control any of that.
The August Job Openings and Labor Turnover Survey (JOLTS) was the soft number, with 7.079 million openings against a revised 7.335 million in July. The October hike trade held anyway. Silver didn’t get any help from it either.
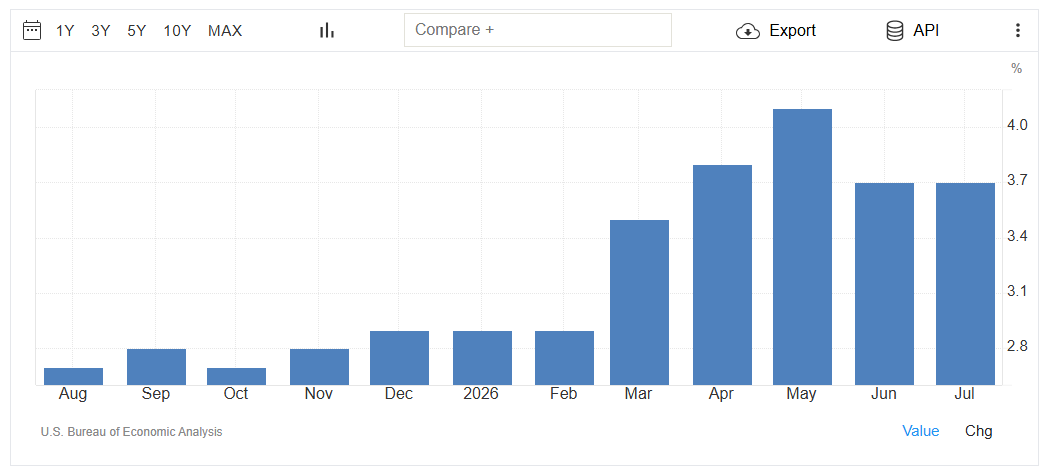
Wednesday’s Personal Consumption Expenditures (PCE) reports are the bigger inflation test, and Friday’s Non-Farm Payrolls report comes right after. Silver is going into both against the same dollar-and-yield trade that drove the sell-off. Softer data is what pulls those two off their highs. Sellers just couldn’t hold it under the 50% level Tuesday. The reversal came on price, not macro relief.
Daily Spot Silver (XAGUSD) Technical Analysis
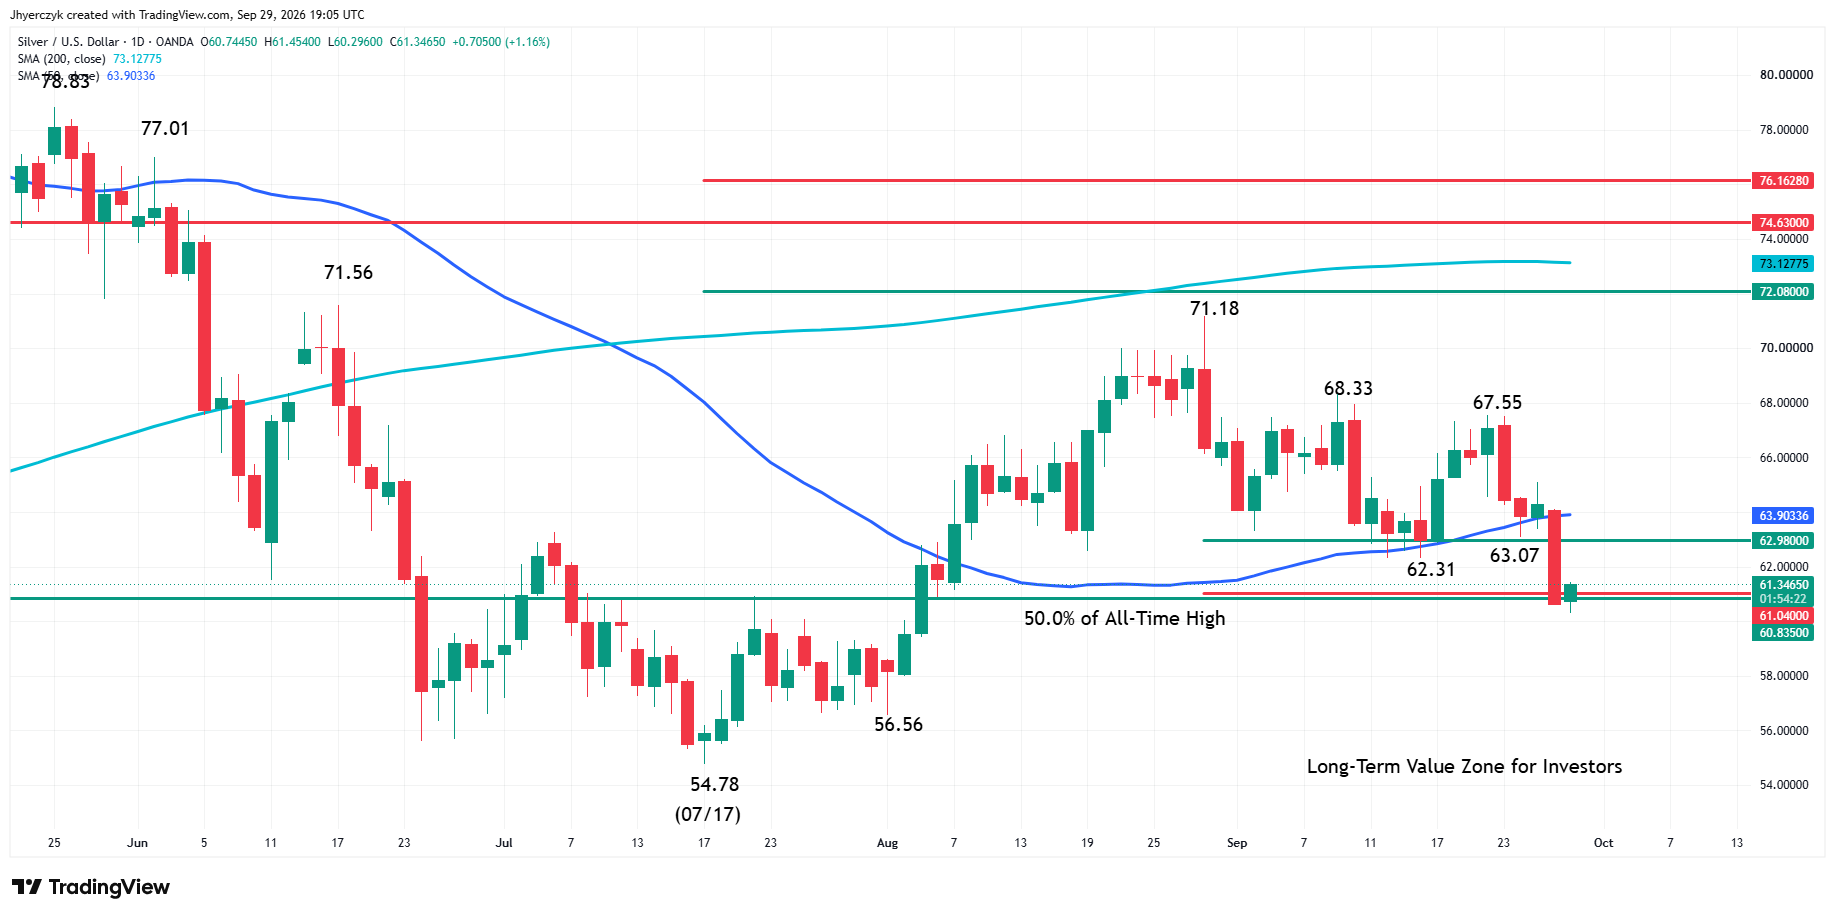
Spot Silver is making a closing price reversal bottom Tuesday after posting a lower low at $60.30 and recovering above the prior close. The pattern needs a follow-through rally on Wednesday to be confirmed. The main trend remains down according to the daily swing chart. A trade through $67.55 will change the main trend to up. A trade through $60.30 will signal a resumption of the downtrend.
The 50% retracement of the all-time high is $60.84. Silver broke under it during the session but recovered above it. That makes $60.84 the first support level. The $61.04 level has been reclaimed and becomes support. The next upside test is $62.98.
The 50-day moving average at $63.90 is the short-term resistance and trend indicator. The 200-day moving average at $73.13 is the long-term resistance and trend indicator. Silver remains below both.
The reversal does not establish a new bottom or change the swing-chart structure.
What to Watch
Wednesday is the confirmation test for the reversal, and the PCE reports land the same day. Payrolls comes after that. Tuesday’s buyers need company, and they have to prove themselves quickly.
Sellers took silver to $60.30, and buyers had it back over $60.84 late Tuesday. That’s the level they have to keep on Wednesday. Tuesday’s high at $61.45 is the first price buyers have to take out Wednesday. After that, they have to deal with $62.98 and then the 50-day moving average.
More Information in our Economic Calendar.