Natural Gas Technical Analysis
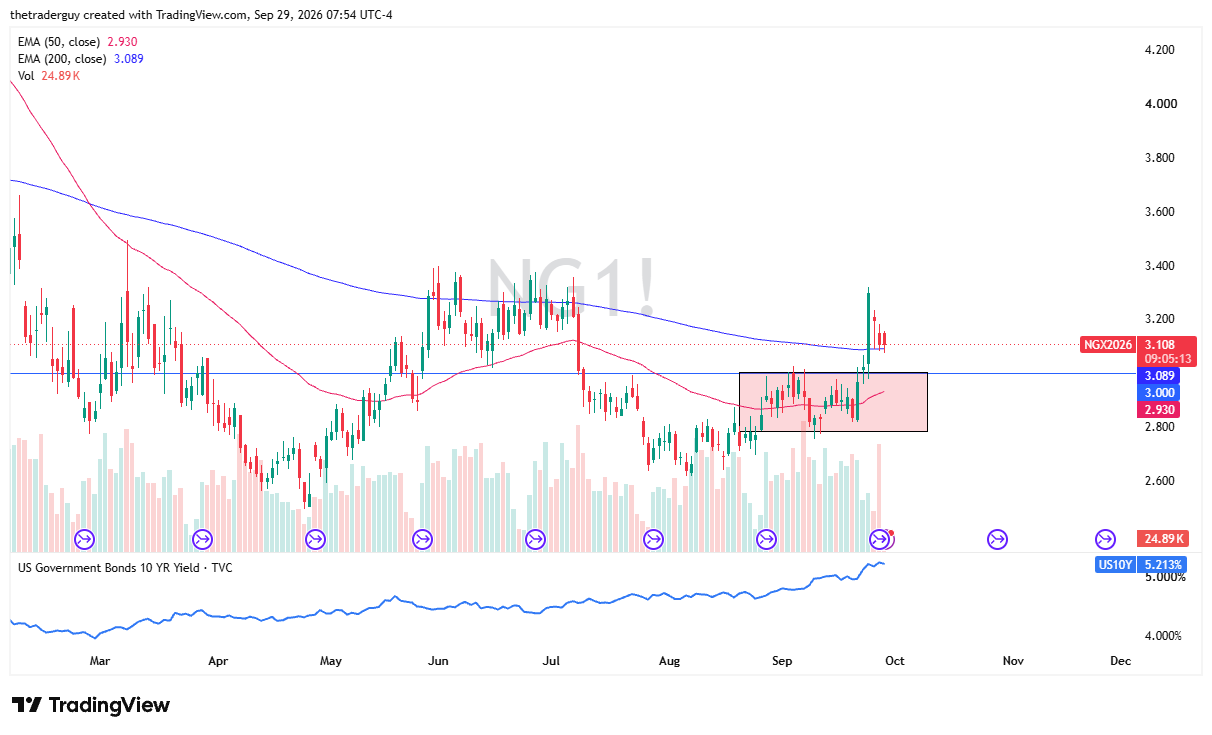
The natural gas market is a little bit negative after gapping higher at the beginning of the session here on Tuesday, as we continue to see a lot of questions asked about what happens next.
Ultimately, this is a market that is very seasonal, and we are getting fairly close to the time of year when traders will be thinking about heating in the Northeast of the United States. We are well above $3 as we are now trading the November contract. The November contract does start to see some cooler temperatures. We’ll have to wait and see.
There are some concerns that it might be a little bit of a crazy winter in North America with El Niño. But the other thing that we need to keep in mind is that the Europeans may have to import more natural gas—liquefied natural gas, that is—from the United States. Therefore, it could open up the possibility of a little bit more bullish winter. We’ll just have to wait and see if the weather also cooperates.
This is all about the weather predictions in the United States right now.
Natural Gas Price Forecast
Every new Natural Gas analysis as it publishes, today's technical signal and key levels, live price — on one page.
See all Natural Gas forecastsAt this point in time, it looks like $3 is probably significant support, just as that 200-day EMA is trying to be. We are starting to tilt to the upside.
We are starting to see some cooler temperatures coming, so we should see a little bit of a drawdown in supply. We are about 5% over the 5-year average right now as far as storage is concerned, so we’re not hurting for supply. But as that starts to get worked off, price should, if history is any indication, start to show that on the charts as well.

If you’d like to know more about how to trade natural gas, please visit our educational area.