


US 2 Year Yield Technical Analysis
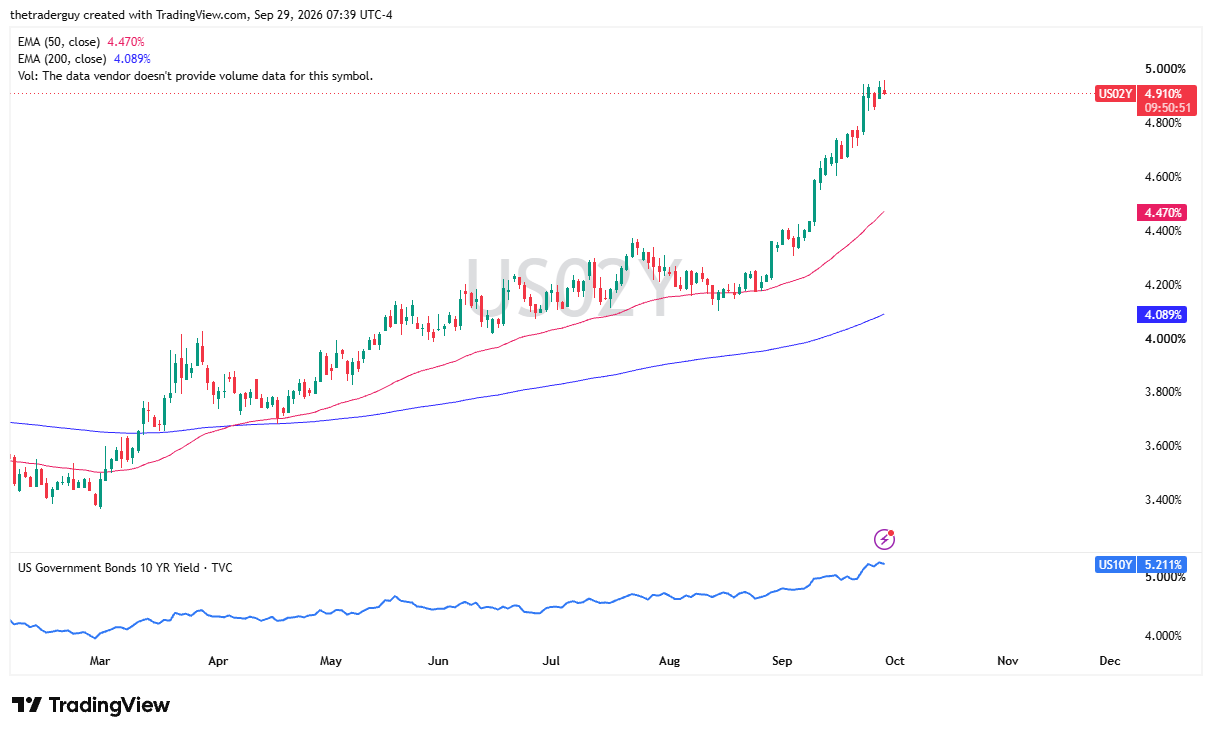
The US two-year yield is calming down a little bit, as is the 10-year yield. I’m watching both, but I’m paying a little bit more attention to the 2-year yield to see if it rolls over. If it does, that might provide a little bit of U.S. dollar weakness. We are seeing several currency pairs get a little bit stretched at the moment in favor of the U.S. dollar, so a little bit of giveback would not necessarily be the biggest surprise.
EUR/USD Technical Analysis
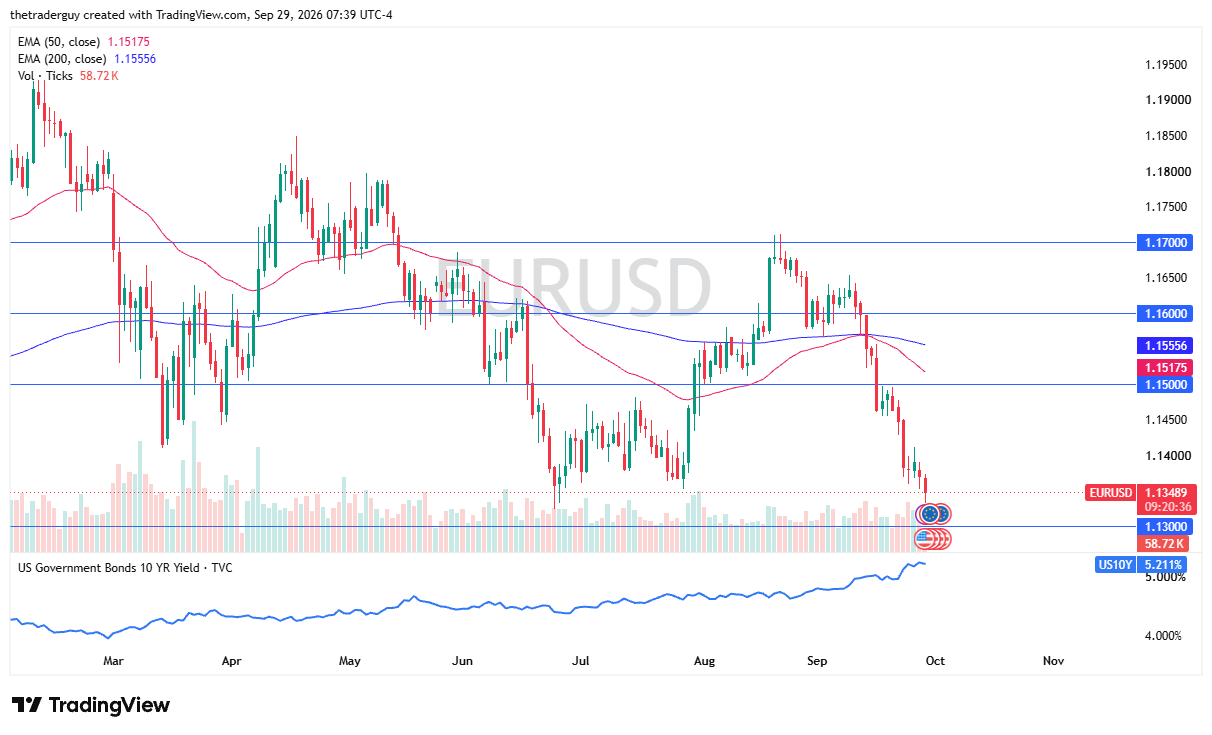
The first pair that I’m watching right now is the euro against the U.S. dollar. I’m thinking maybe a bounce is coming if we see the rates roll over in the United States. I think this is a relief rally. I’m not looking for some type of major trade here, but a bit of a bounce could very well be a reality, perhaps to the 1.14 level. We are already starting to see that come to fruition.
If rates continue to drop, I suspect probably doing a quick smash-and-grab long there may come into play.
AUD/USD Technical Analysis
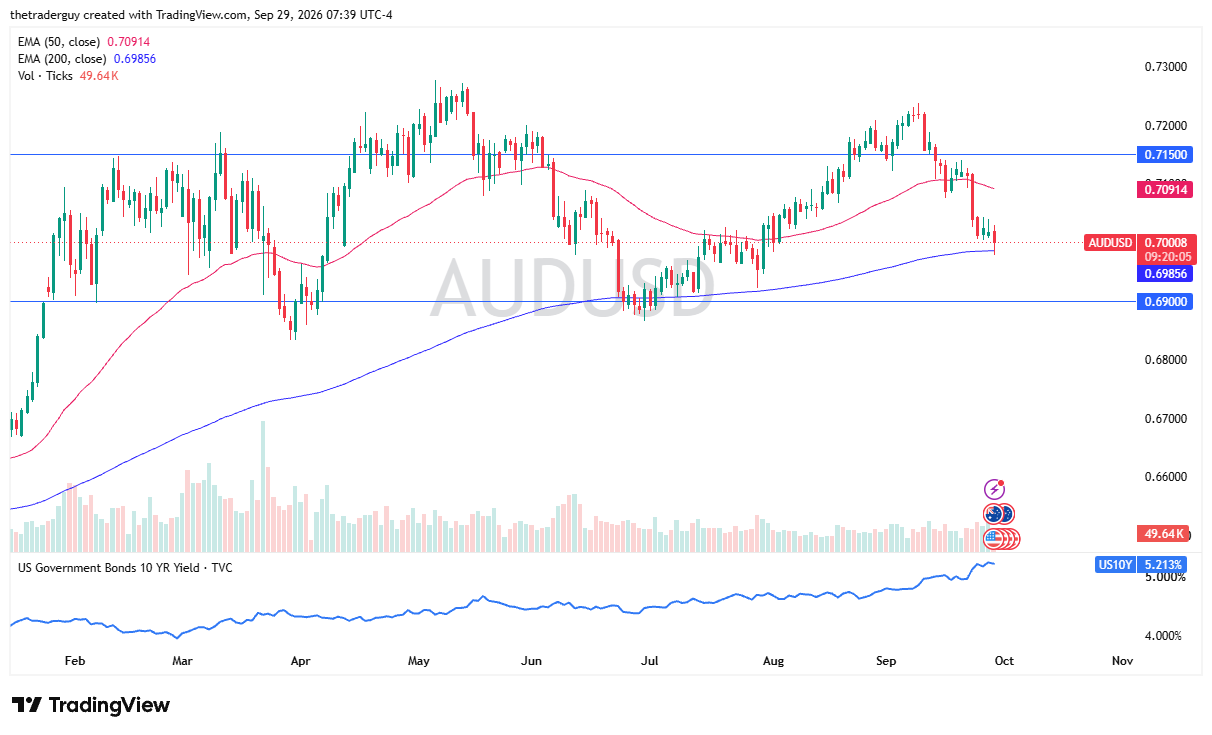
The Australian dollar is testing the 200-day EMA. Again, if rates drop in America, I think that ties together quite nicely as a technical setup that people might be paying attention to. The 0.7050 level above is a little bit of a target, perhaps a barrier. But if we can break that, then I’ll be looking to try to get to the 50-day EMA, which is currently tucked in just below 0.71.
Copper Technical Analysis
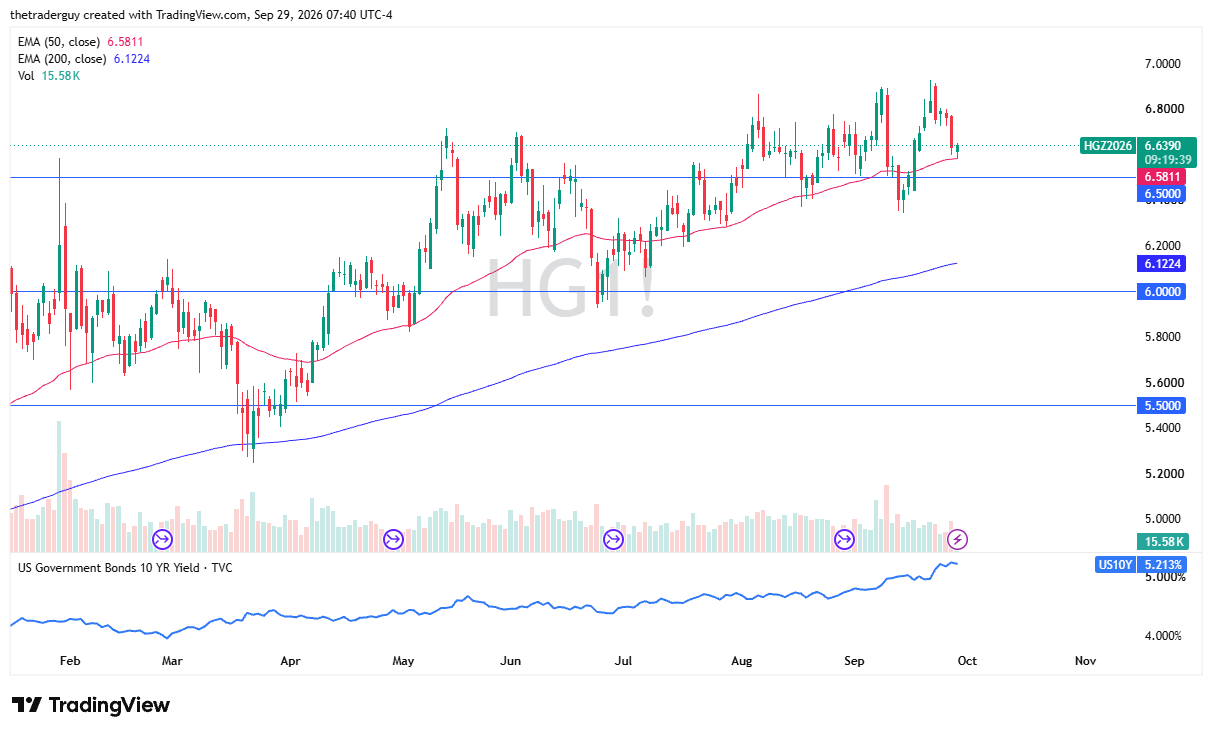
Copper looks like it’s trying to bounce from the 50-day EMA. Let’s be honest, copper is a market that’s going to have a lot of demand, and supply is not that great. We are seeing copper at pretty stretched intervals from time to time, but the one thing that I would use to characterize this chart is a slow and steady grind higher. I don’t see that changing right now.
EUR/USD Price Forecast
Every new EUR/USD analysis as it publishes, today's technical signal and key levels, live price — on one page.
See all EUR/USD forecastsThe 50-day EMA seems to be holding, so I’m very interested in buying copper today.