


Double Bottom Breakout Signals a Shift
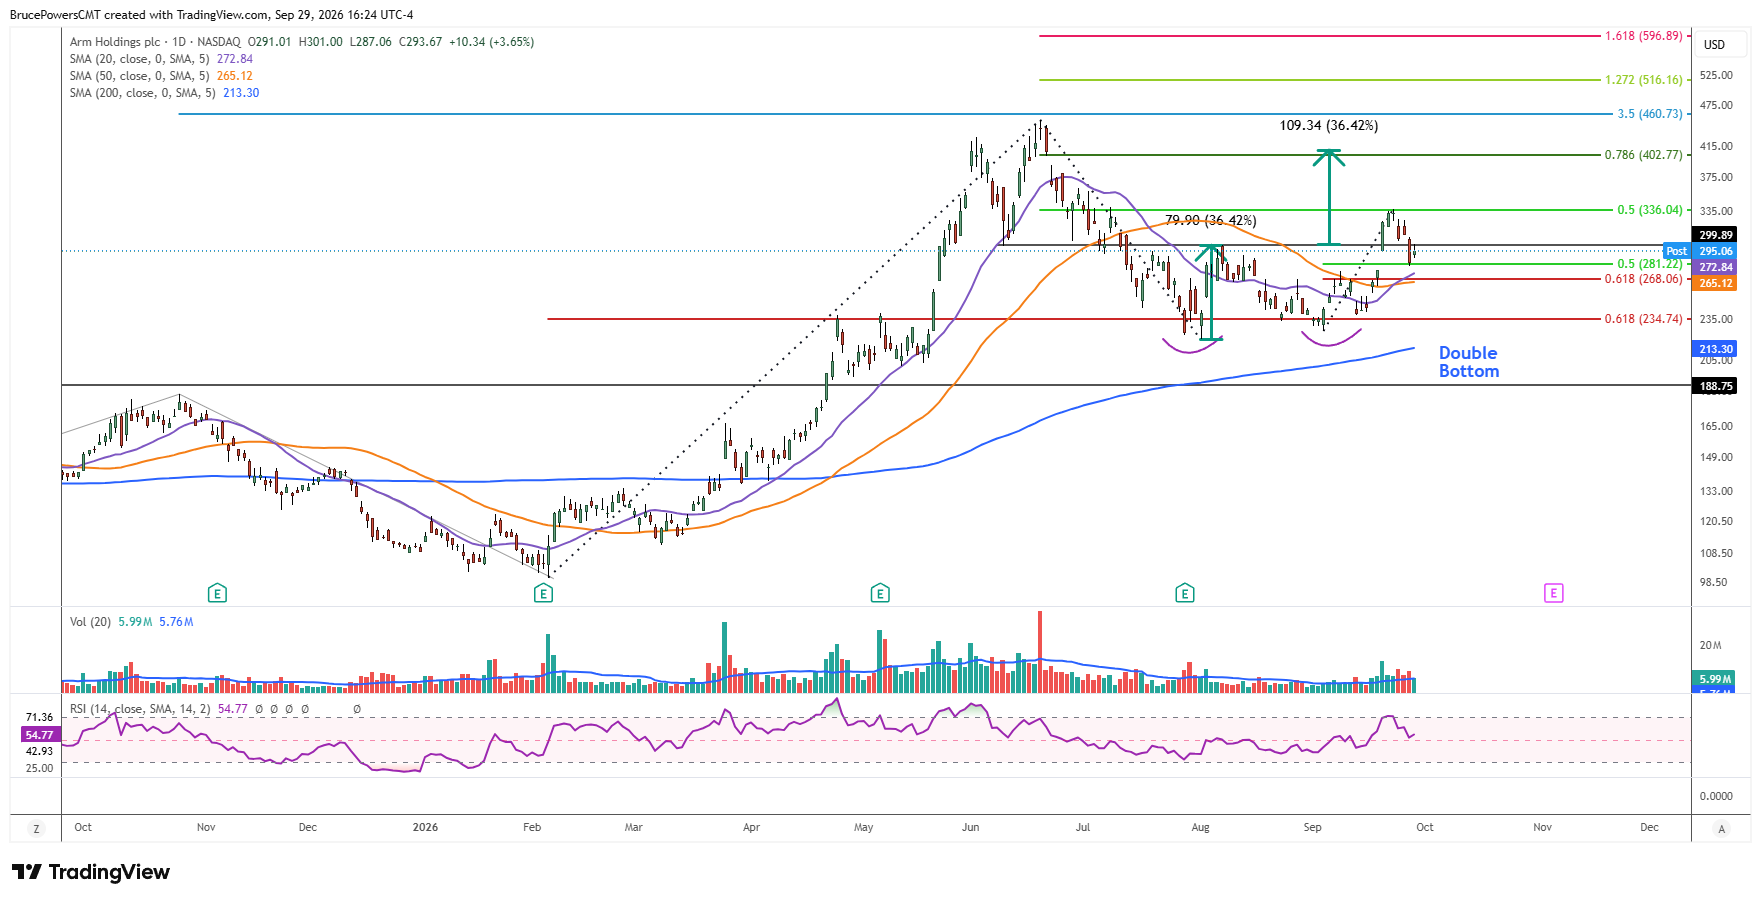
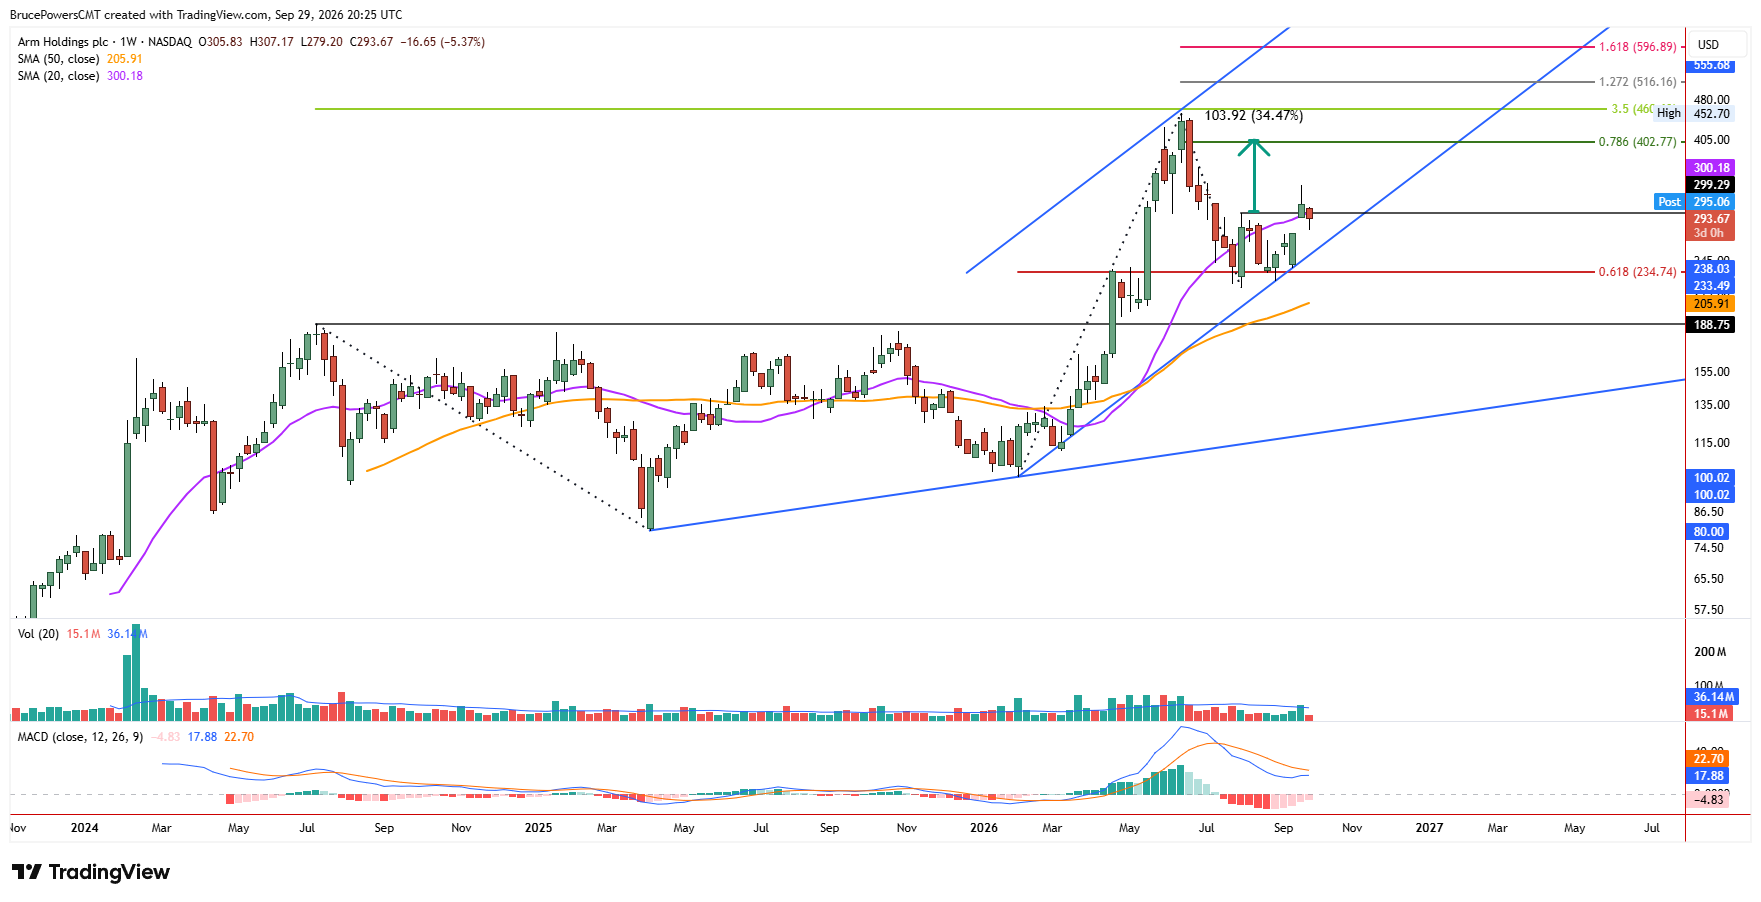
Shares of Arm Holdings (ARM), a semiconductor industry company, broke out of a double bottom pattern last week as sentiment for the sector improved. The advance signaled a bullish reversal and suggesting that the recent bearish correction may have been completed. Support for the correction was found near the 61.8% Fibonacci retracement zone following the peak of $452.70 in June.
A breakout of the double bottom formation was triggered on a rally above the neckline of the pattern at $299.29. ARM then pushed to an eventual high of $338.98, while weekly volume reached a 14-week high. ARM is now establishing its first pullback following that significant bullish signal, potentially creating a favorable risk setup.

Support Zone Holds Key to Continuation
Last week’s advance was further reinforced by the reclaim of the 50-day moving average, which had represented dynamic resistance since ARM broke below it in mid-July. More recently, the 20-day moving average has crossed above the 50-day moving average, indicating improving short-term momentum. The pullback from last week’s high retraced 50% of the prior advance, reaching Monday’s low of $279.20. Although the 50% retracement zone may attract buyers, there is a more significant support zone a little lower that could become important if the pullback extends.
A bullish upside gap accompanied last Monday’s sharp advance, and it has been more than halfway filled so far. The 50-day moving average near $265.32 identifies a lower dynamic support boundary, with a sustained break below that average signaling potential failure of the double bottom breakout. Last week’s gap is filled at $275.78, and the 61.8% Fibonacci retracement of the prior advance is at $268.06, identifying a range of possible support from $275.78 to $268.06.
Once signs of strength emerge from this support zone, the next leg higher in the developing advance could be ready to resume. Conversely, a drop below the new higher swing low that forms during the pullback would provide an early warning that the bullish setup is weakening.
Upside Targets Come Into Focus
An initial upside target zone is marked near the confluence of two indicators: the 78.6% Fibonacci retracement at $402.77 and the measuring objective from the double bottom pattern near $410. If ARM confirms a bullish reversal from key support, further demand and bullish momentum could develop, keeping these upside objectives in focus. This makes the current pullback particularly important.
If you’d like to know more about technical analysis and how traders use it, please visit our educational area.


