
Oil Pullback Gives Stocks a Bid, but Treasury Yields Keep the Pressure On
Stocks are trying to find their footing about 90 minutes into the New York session Tuesday. Oil is lower this morning. Chip stocks are catching a bid off Monday’s lows, and the Nasdaq Composite Index has pulled away from Monday’s bottom. Treasury yields haven’t budged from their highs, though, and that’s keeping the broader indexes pinned. Very little of Monday’s selling has been reversed.
The chip bounce is the best thing on the screen. Buyers are still willing to step into the AI trade on a dip. The rest of the market isn’t following with much conviction. The S&P 500 Index is barely positive, and the Nasdaq Composite Index is still trading under the retracement zone it lost Monday.
At 14:57 GMT, the Nasdaq Composite Index is trading at 26,865.26, up 44.88 points or +0.17%. The S&P 500 Index is at 7,685.33, up 1.64 points or +0.02%. The iShares Semiconductor ETF (SOXX) is up $12.42, or +2.21%, at $573.21.

Daily Nasdaq Composite Index Technical Analysis
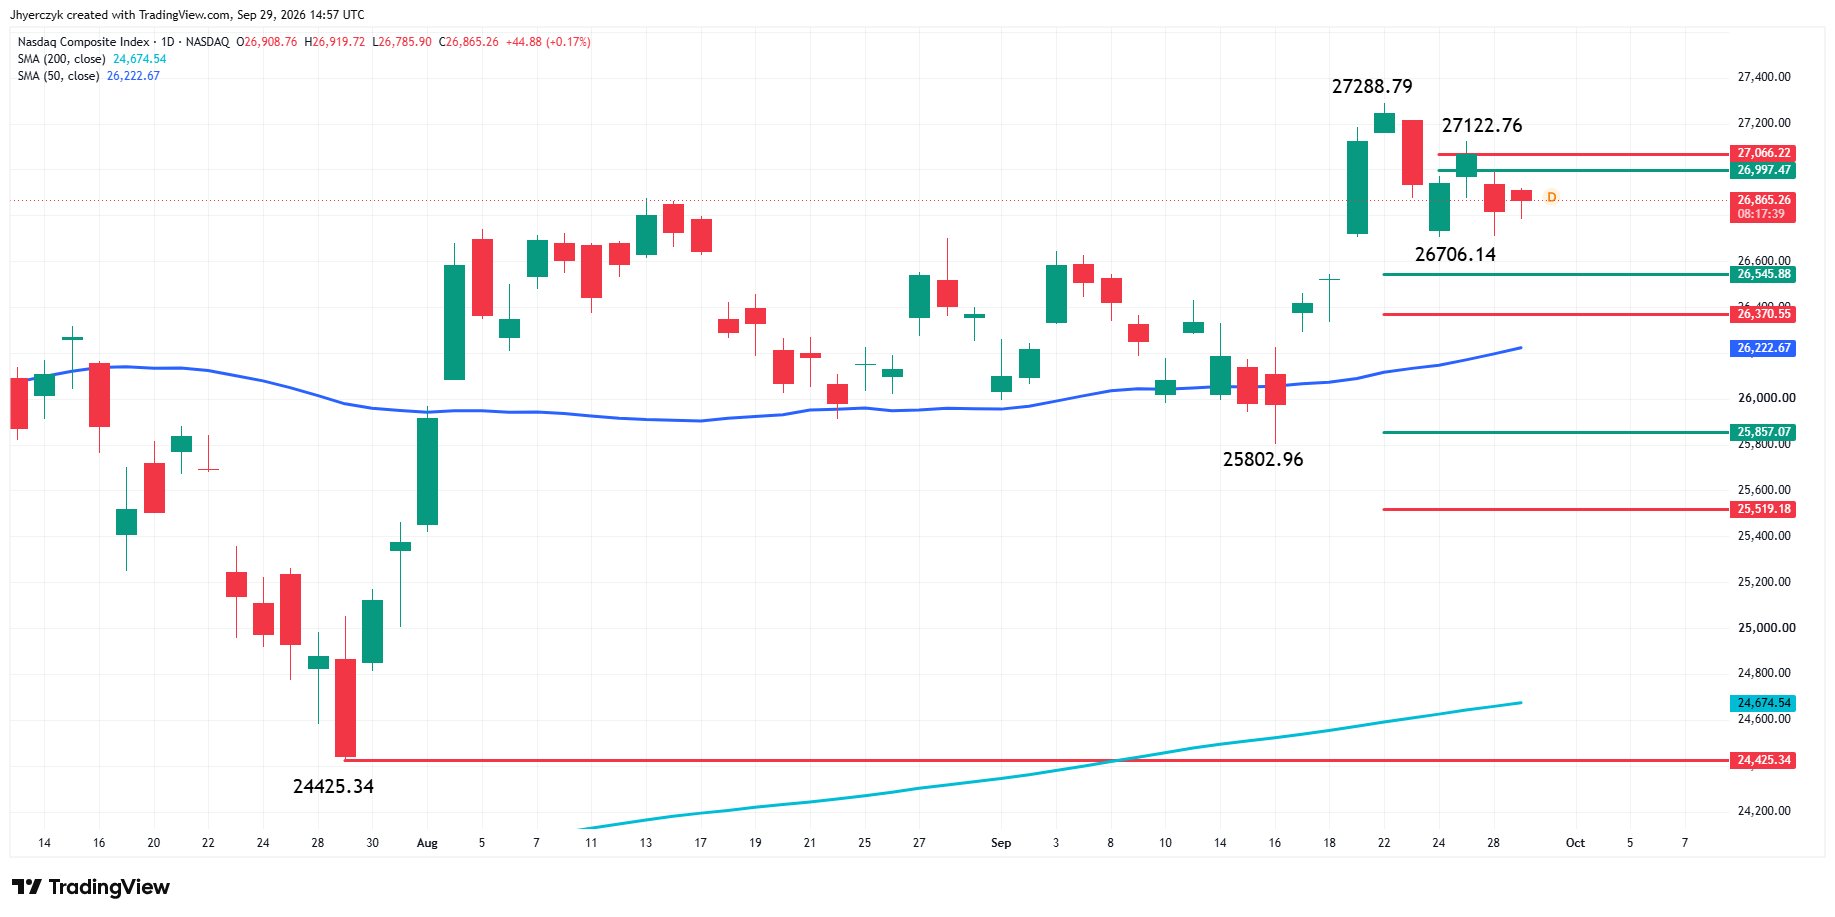
The main trend is up according to the daily swing chart. A trade through 27,288.79 will signal a resumption of the uptrend. The main trend will change to down if 25,802.96 fails to hold.
The minor trend is also up. A trade through 26,706.14 will change the minor trend to down.
The Nasdaq Composite Index remains below the 26,997.47 to 27,066.22 retracement resistance zone. The nearest support zone is 26,545.88 to 26,370.55. The 50-day moving average at 26,222.67 is the next major support and trend indicator underneath.
Daily S&P 500 Index Technical Analysis
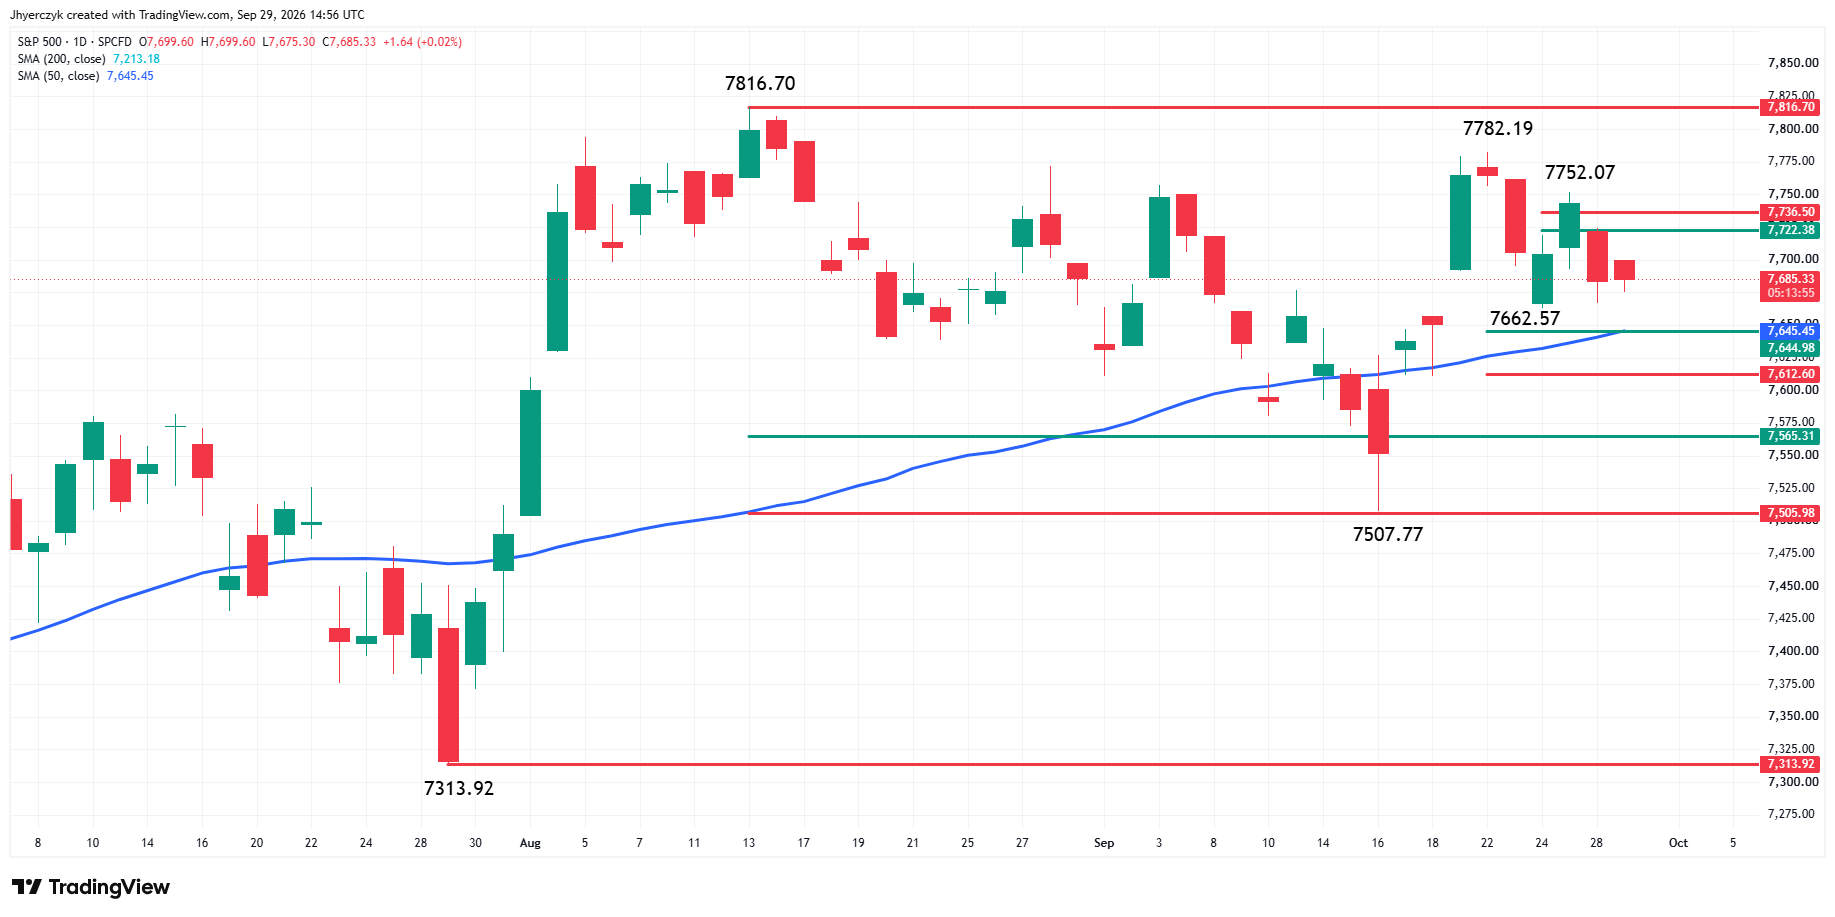
The main trend is up according to the daily swing chart. A trade through the record high at 7,816.70 will signal a resumption of the uptrend. The main trend will change to down if the main bottom at 7,313.92 fails to hold.
The S&P 500 Index is in a short-term pullback after failing to hold above 7,752.07. The first upside test is the 7,722.38 to 7,736.50 resistance zone.
The first support is the recent bottom at 7,662.57. The 50-day moving average at 7,645.45 is the next support and trend indicator underneath.
Daily iShares Semiconductor ETF (SOXX) Technical Analysis
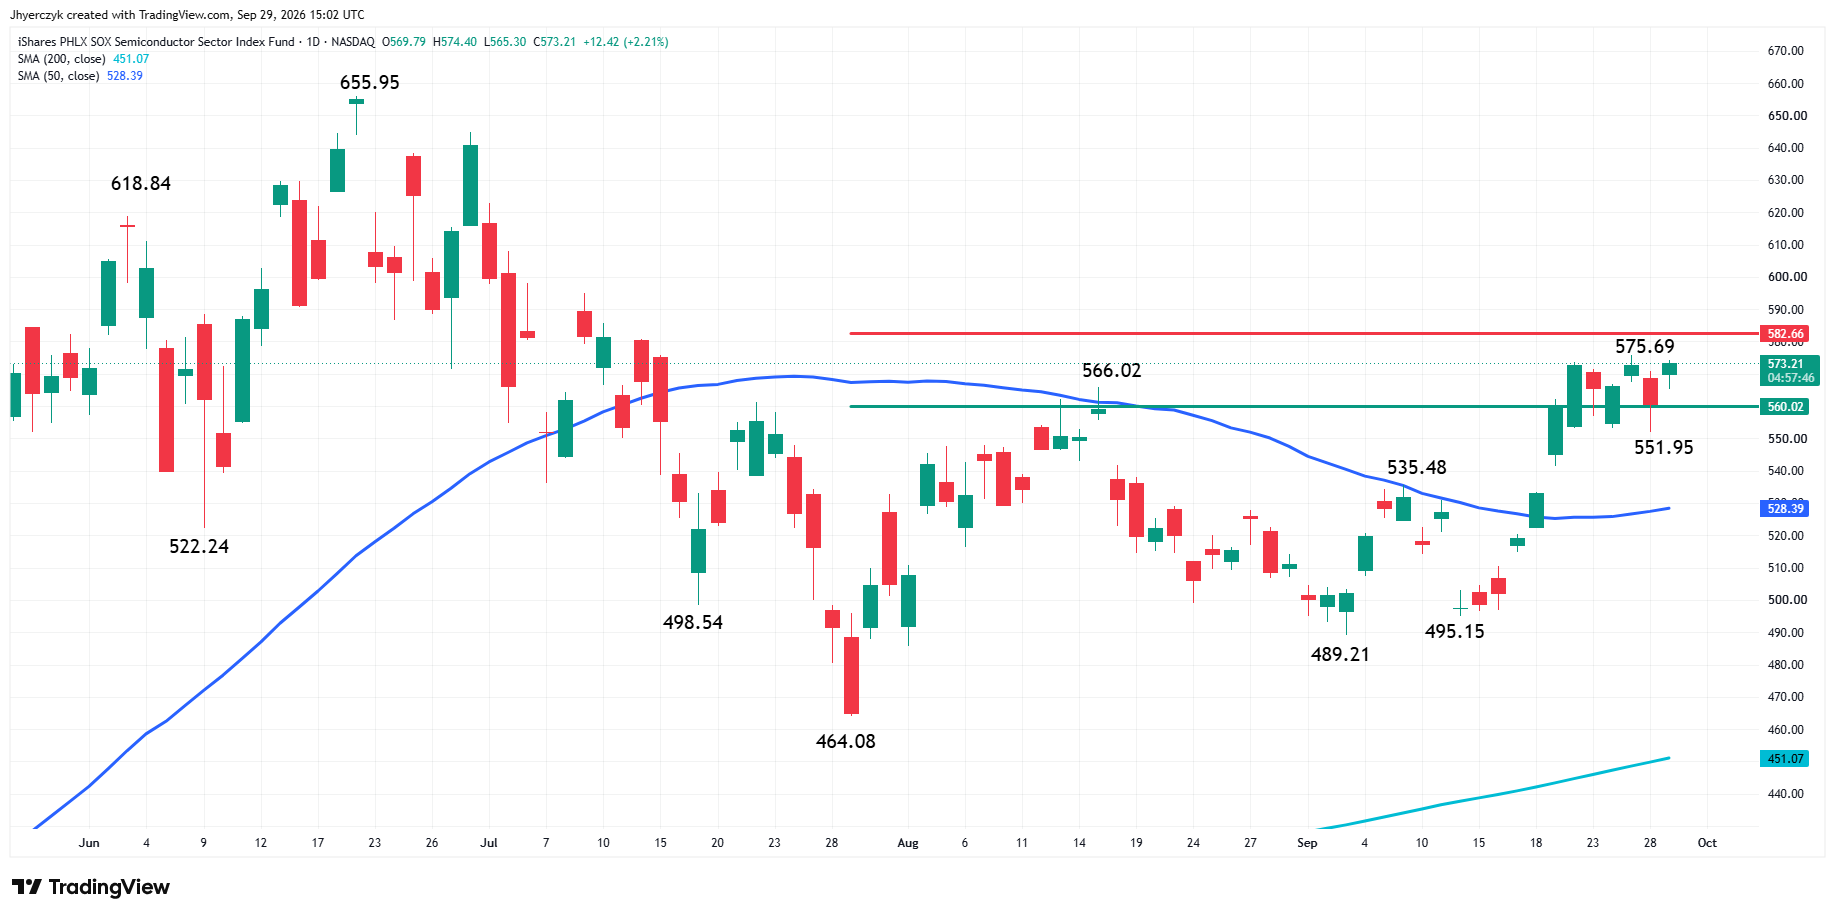
SOXX is trading higher Tuesday after buyers took the ETF back above $560.02. The next upside target is last week’s high at $575.69. The 61.8% retracement level at $582.66 is the key resistance level above that.
The 50-day moving average at $528.39 is providing short-term support and trend direction. The 200-day moving average at $451.07 is providing long-term support and trend direction.
The main trend indicator is pointed higher. The first support is the recent bottom at $551.95.
Softer Crude Took Some Heat Off the Rate Trade
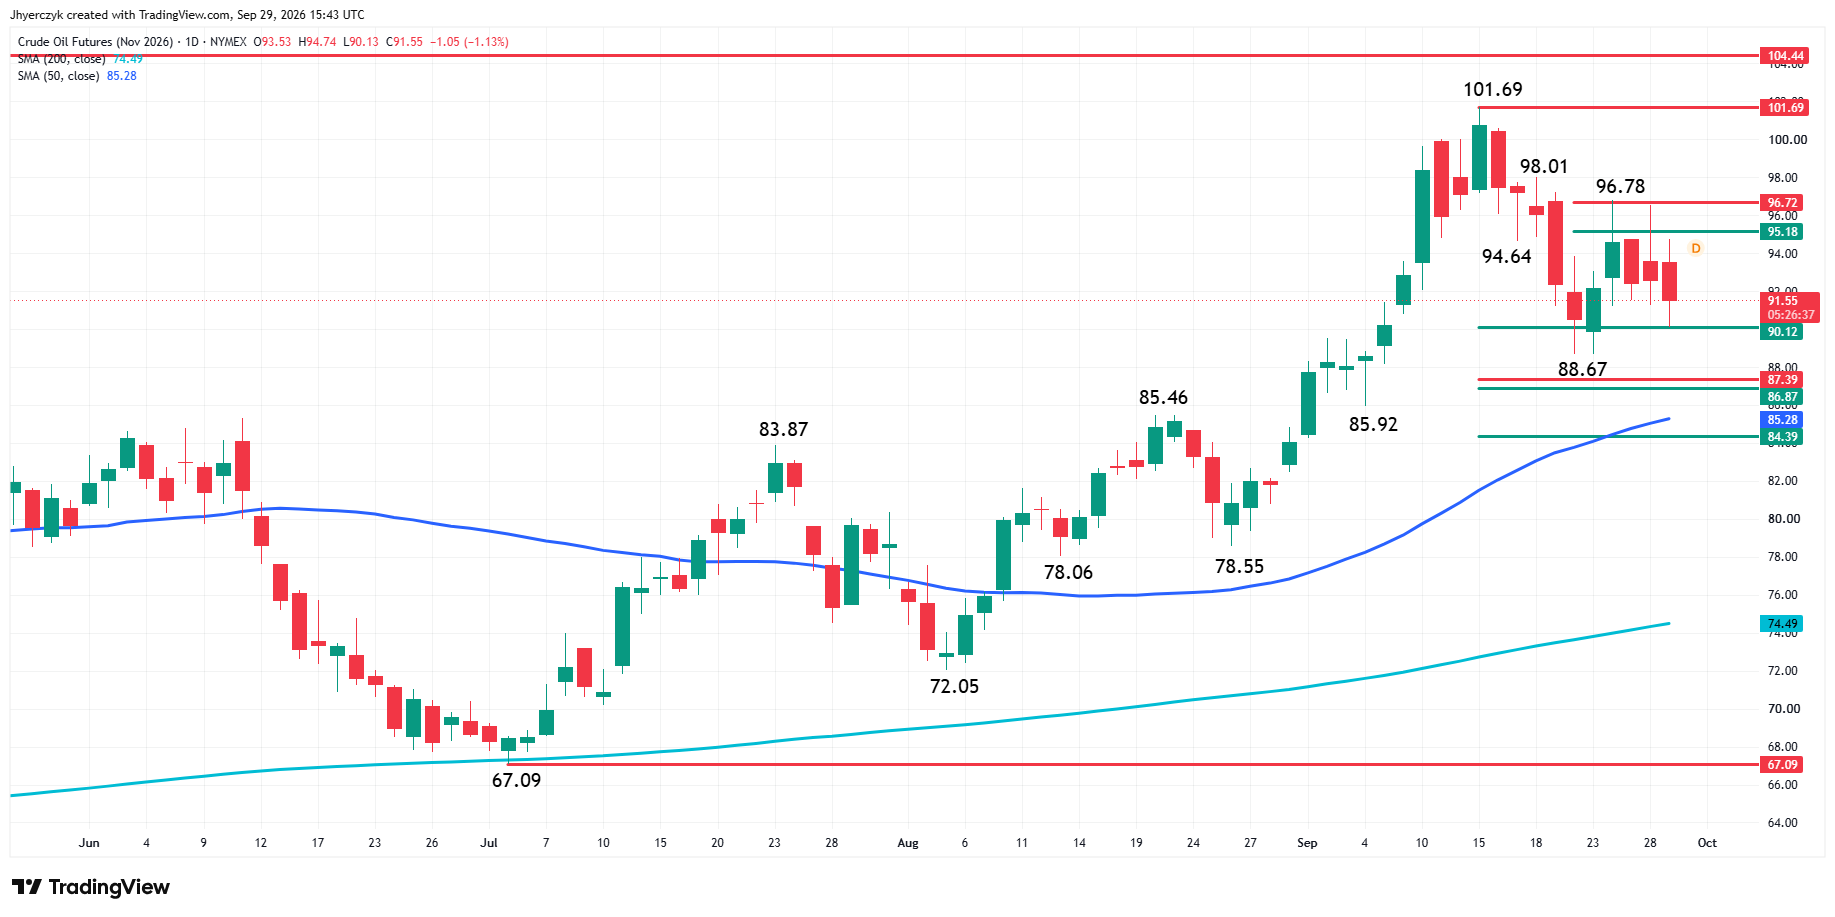
Crude is backing off Tuesday. Middle East export flows are improving. U.S. and Iranian officials are still holding indirect talks through mediators. WTI crude oil fell toward $90.71 per barrel, while Brent traded near $103.97. Crude is off, but not by enough to change the inflation argument.
Stocks took the relief. Some of the immediate inflation pressure came out with the oil price. Tuesday’s dip in crude is the first break stocks have had since the peace talks stalled Monday.
Energy is still carrying a geopolitical premium. It can come back on a single Iran, Hormuz or Saudi supply headline.
Lower oil is lifting stocks without setting off a real risk-on move. Buyers are getting a breather. They want proof that inflation pressure is actually fading before they commit.
The 10-Year Is Still Making Stock Buyers Wait
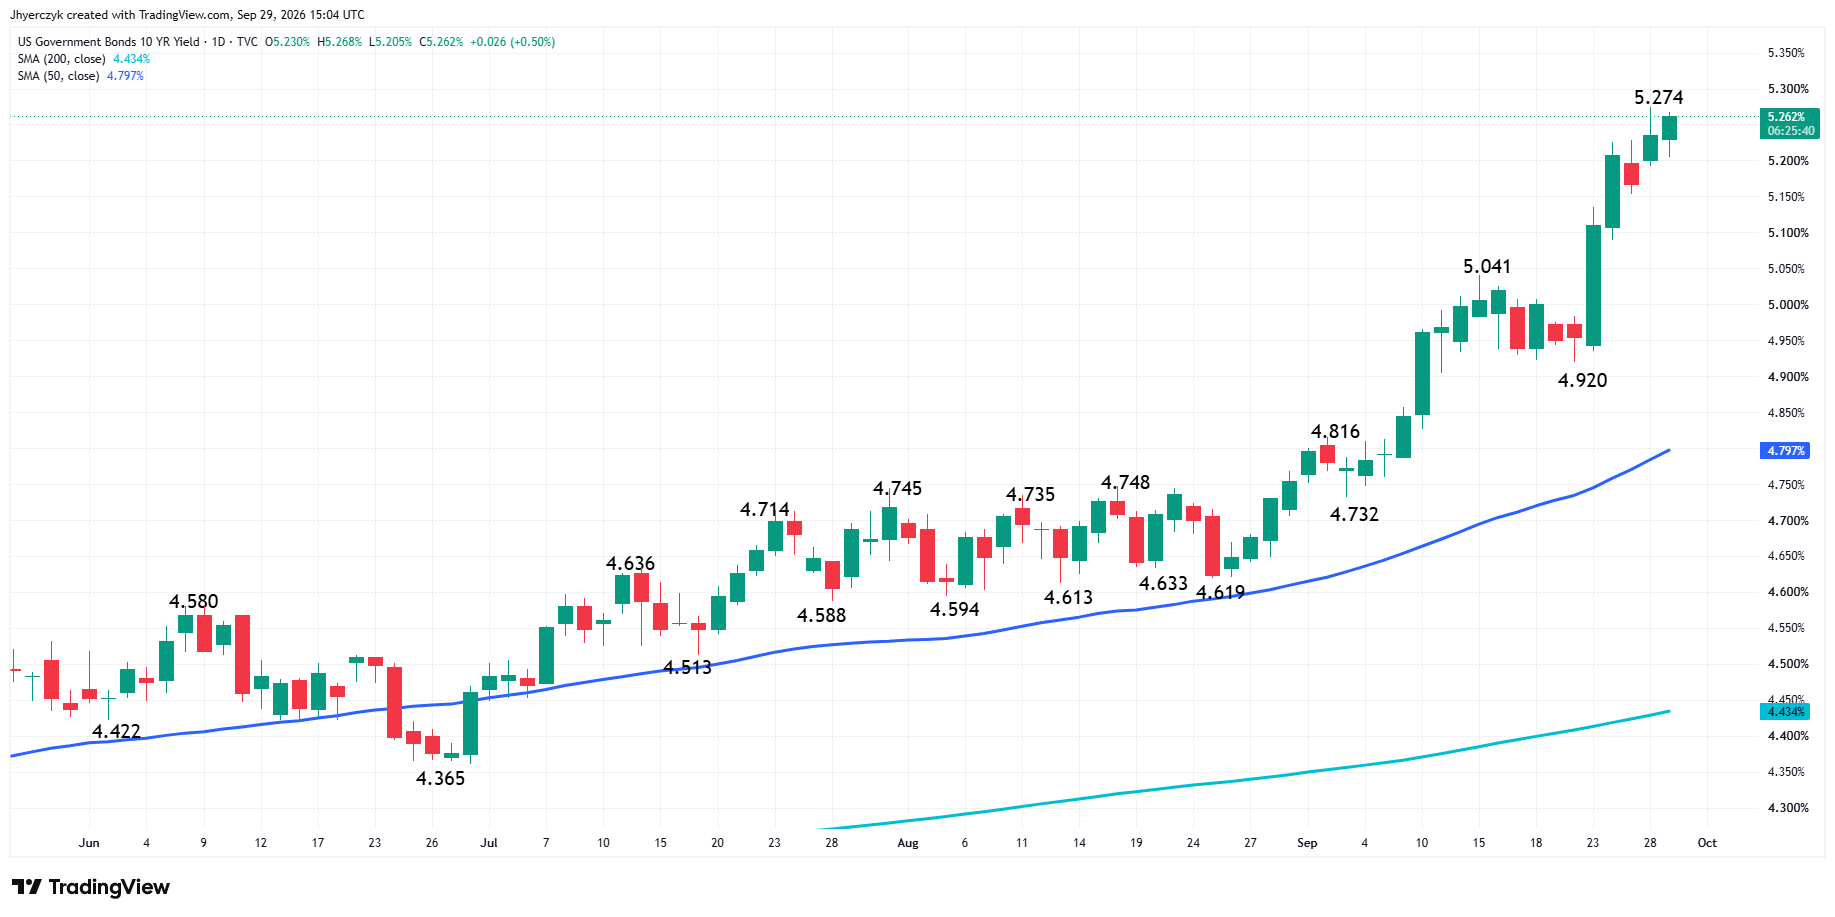
The 10-Year U.S. Treasury yield touched 5.27% and is trading near 5.26%. The 30-Year yield is near 5.59%. The market hasn’t seen those levels in years.
The bond market is still holding near its highs. That’s the problem for stocks this morning. Stocks bounced anyway. The bounce just hasn’t come with any help from Treasuries. The 10-Year is still well above the 5.04% breakout level and the 50-day moving average near 4.80%.
Traders are pricing a 68.1% chance of another quarter-point hike in October, according to CME FedWatch. With oil still elevated and PCE inflation data out Wednesday, that’s enough to keep the rate trade in charge.
Earnings and the AI trade can carry stocks through high yields for a while. A bond market that keeps repricing the rate outlook higher is a different story. Tuesday’s rebound is a start. It needs help from yields to go further.
A Big Consumer Confidence Miss Adds to the Doubts
The Conference Board’s consumer confidence index fell 6.7 points to 81.9 in September. Economists were looking for a reading near 89. That’s a miss of more than seven points.
Consumers turned more negative on current business conditions. They’re also less confident about the labor market and the next six months.
The October hike is still on the table after that report. Stock buyers now have one more reason to question how much higher rates the economy can absorb.
Wednesday’s Personal Consumption Expenditures (PCE) report is the first test for the bond market. A soft number gives bond traders a reason to take some profit out of the sell-off.
Chip Buyers Came Back, but the Rest of Tech Hasn’t
The early leadership is coming from the same corner that carried the market last week. AMD is higher after acquiring AI firm World Labs. Nvidia and the other chip names are finding buyers after Monday’s selling. AMD’s deal gave traders a company-specific reason to buy on a day the index needed one.
That’s keeping the Nasdaq Composite Index from a second hard down day. It isn’t pulling money back into the rest of technology, communication services or the big growth names that sold off Monday. Those are the names that need to turn for the S&P 500 Index to get off the flat line.
Leadership this narrow worked when the AI trade was running. It’s a lot less useful with yields climbing. I want to see the bid spread past a handful of chip stocks before I’d say the rate trade is losing its grip.
What to Watch
Oil gave stocks a better Tuesday morning. One Iran or Saudi headline can take it back before either report hits.
The chip stocks are doing all the lifting right now. They need help from the bond market. The 10-Year is still sitting a basis point off its high, and Wednesday’s PCE report is the first number that can pull it down.
Payrolls on Friday matters more. It lands after a consumer confidence miss. A weak jobs number isn’t going to get cheered this week just because yields drop on it.
The Nasdaq Composite Index has the chip stocks working for it. The index still needs to get back into and through the 26,997.47 to 27,066.22 zone it lost Monday to show the bounce has depth. A slip under the minor trend trigger at 26,706.14 would put the 26,545.88 to 26,370.55 support zone back in front of the market.
The S&P 500 Index is essentially flat and stuck in a short-term pullback. Buyers have to take back the 7,722.38 to 7,736.50 zone before the 7,752.07 high and the 7,782.19 secondary high come back into play. Underneath, the recent bottom at 7,662.57 and the 50-day moving average at 7,645.45 have to hold. A failure there brings 7,612.60 and 7,565.31 into view.
SOXX is the strongest chart on the board. It took back $560.02 and is sitting just under last week’s high at $575.69. The ETF has to clear the 61.8% level at $582.66 to bring in new buyers. A sustained move back under $560.02 would weaken the near-term outlook and put the 50-day moving average at $528.39 back in front of the market.
More Information in our Economic Calendar.