Bitcoin (BTC) has gone up by 1.3% in the past 24 hours, as the crypto market is still taking a breather after its latest rally.
The top crypto started to retreat right after hitting our long-dated target of $85,000, as part of a normal profit-taking move.
We are still in bullish territory and believe that the rally will keep going despite this retreat. However, we don’t think this pullback is over yet.

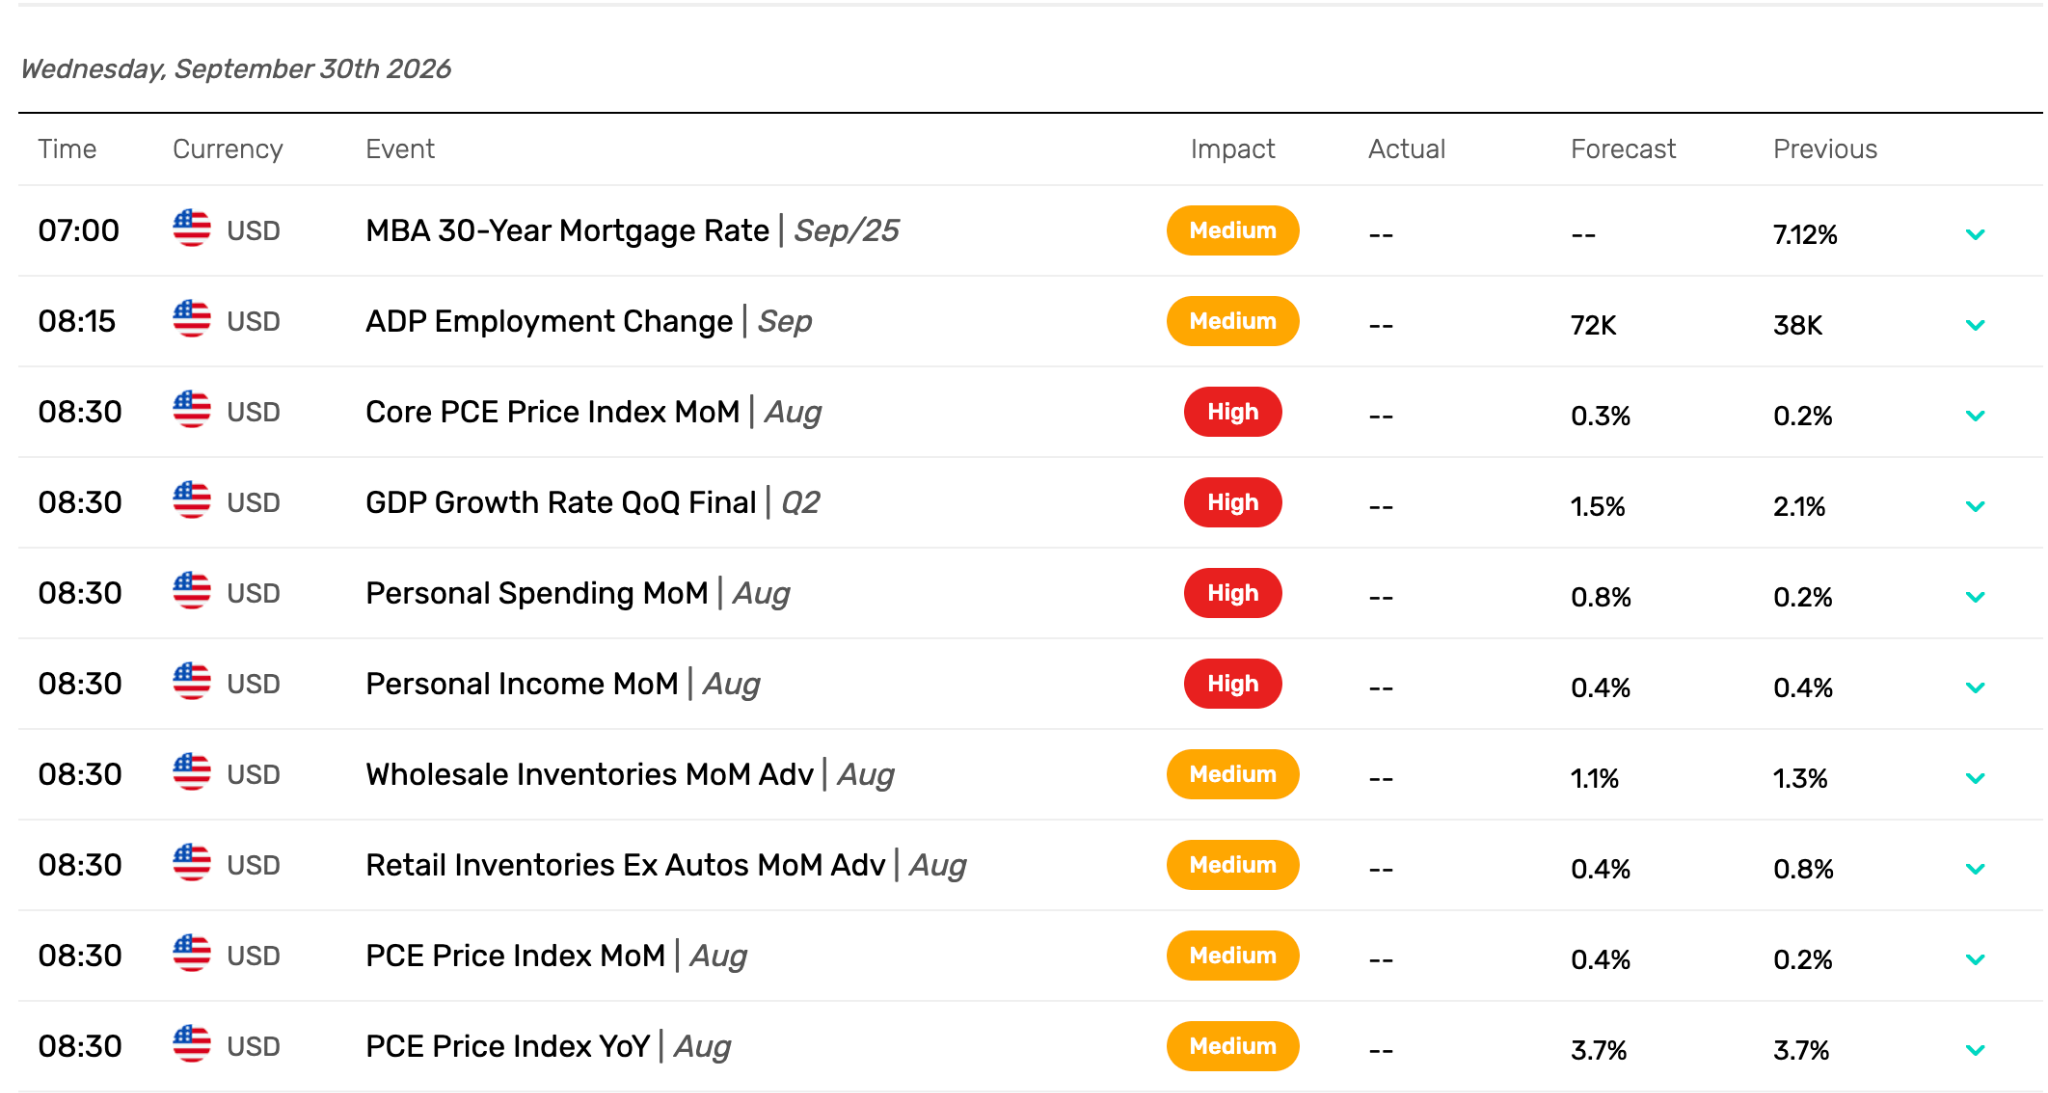
Market participants expect that the monthly variation in this key inflation gauge will double to 0.4% compared to the previous month. Meanwhile, analysts also predict that quarter-on-quarter GDP growth in Q2 will decelerate to 1.5%, down from a previous 2% print in Q1.
If inflation levels increase beyond these expectations, chances are that this latest pullback could intensify. Right now, the odds of a rate hike during the next FOMC meeting in October are sitting at 68% as per data from FedWatch.
A higher-than-expected PCE Price Index print could dramatically increase those odds, and subsequently, the odds of a 50bps rate hike earlier than expected. This could result in a short-term drop in the price of risky assets like BTC.
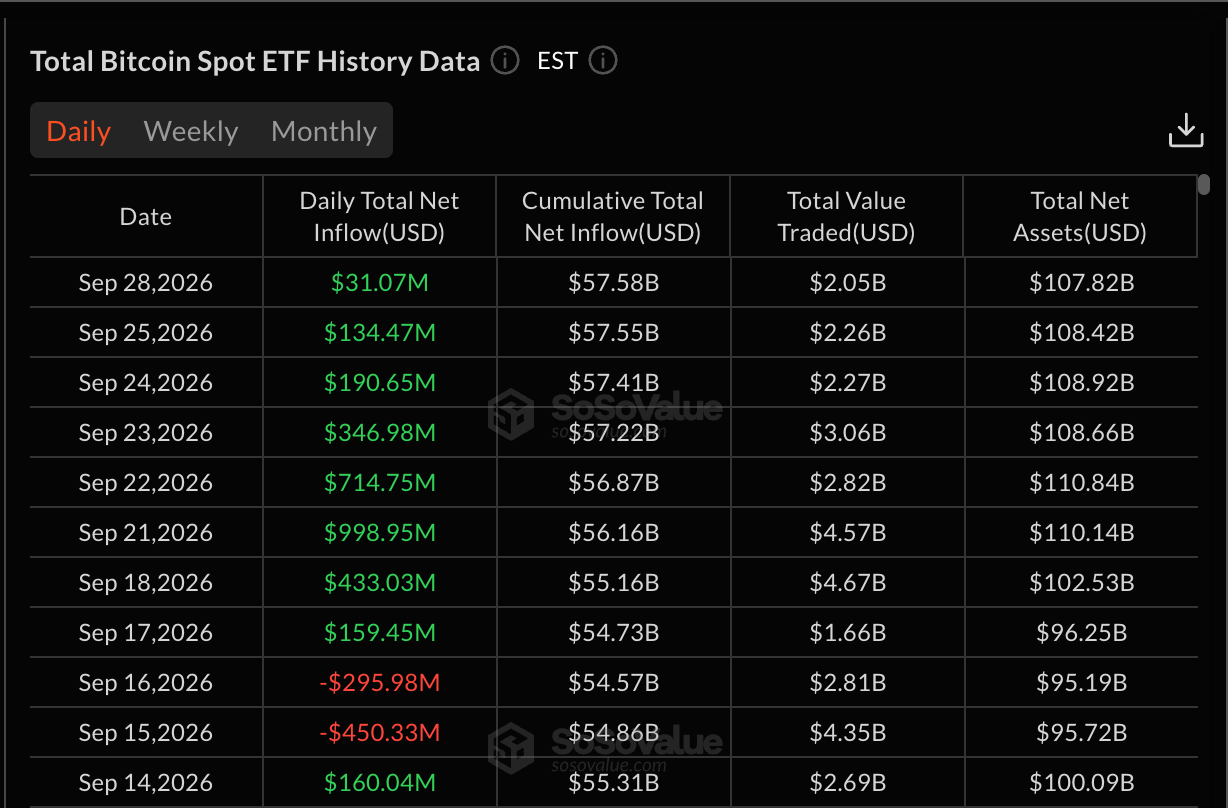
Despite this risk, exchange-traded funds (ETFs) linked to Bitcoin notched their 8th consecutive day of positive inflows. This indicates that Wall Street continues to take bullish positions with the expectation that the current rally will continue.
During this relatively short period, ETFs have brought in $3 billion — nearly as much as what investors poured into these vehicles in August. Some FOMO appears to be setting in as top tokens in the crypto market rallied past their 200-day exponential moving average (EMA) and continue to hit key price targets.
Bitcoin Price Forecast
Every new Bitcoin analysis as it publishes, today's technical signal and key levels, live price — on one page.
See all Bitcoin forecastsBTC Eyes Rebound Off $80K – $82K “Hot Zone”
Heading to the chart, our baseline scenario for BTC is that the price will retreat a bit after tagging this $85,000 target, but not much. The course is set toward the high $90,000s, and potentially the $100K level is bullish momentum remains strong.
The Relative Strength Index (RSI) is still standing above 60, favoring a bullish outlook as well. Paired with strong ETF inflows and sentiment readings in “Greed” Mode, we are in full-on bull market mood.
Turning to the 4-hour chart, we can see more clearly where the next buy zone for Bitcoin appears to be. The price action in this lower time frame has formed a bearish structure of lower highs and lower lows.
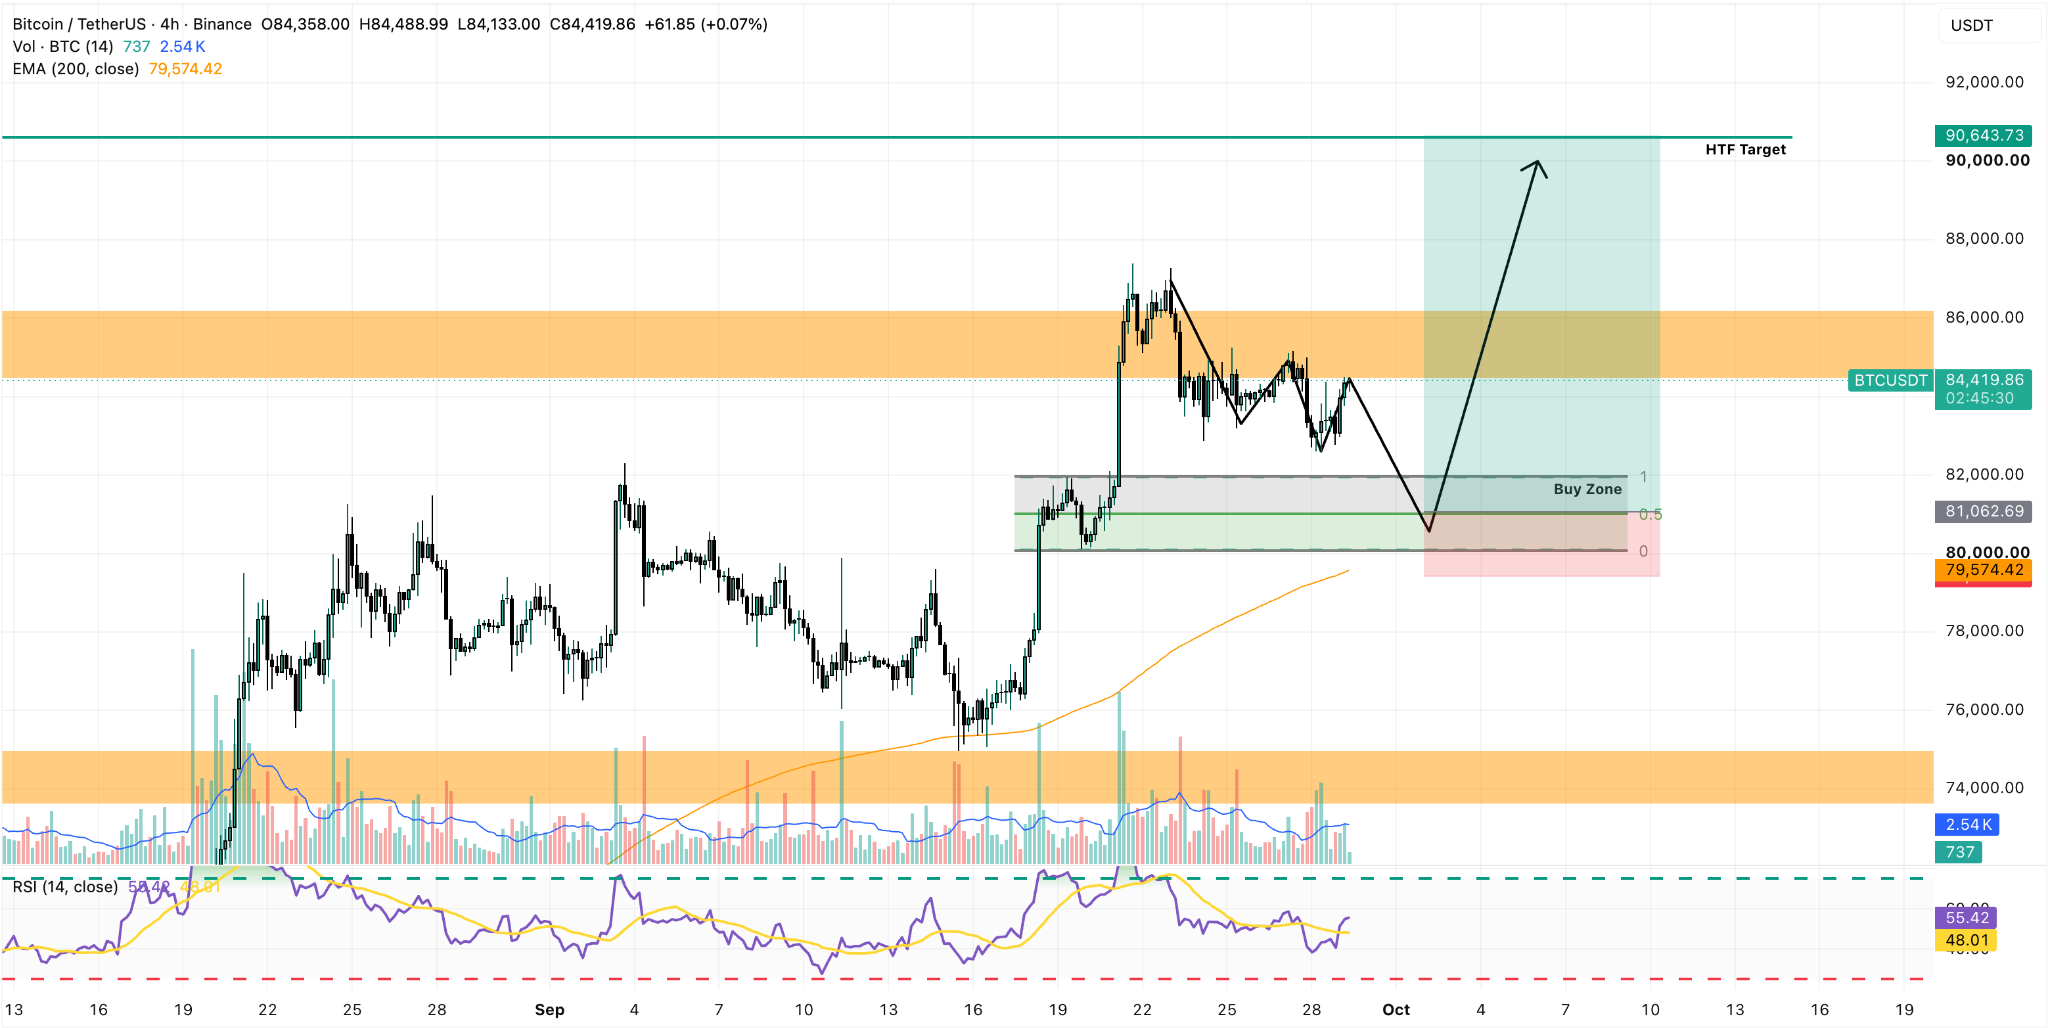
This is evidence of an ongoing pullback. Hence, we see the $82,000 to $80,000 area as a high-probability price zone from which BTC will likely bounce strongly as long as market conditions remain unchanged.
It is worth noting that tomorrow’s inflation print will be critical to determine if this area will hold or not. A higher than expected PCE Price Index may weaken this demand zone or increase the selling pressure too much, to the point that this cluster could break.
If it holds, the odds of a breakout above the $85,000 area would be quite high, and we envision a first target of $90K in the near term. This trade offers an attractive 4x risk-reward ratio with an appropriate entry.