


Ethereum’s native token, Ether (ETH), is approaching a long-term resistance zone that has preceded some of its strongest rallies in recent market cycles.

Past ETH Fractals Produced Four Major Rallies
As of Sept. 29, ETH was trading near $2,723, testing the upper portion of a broad $2,150-$2,800 range on its two-week chart. Previous bullish resolutions from this structure were followed by gains of roughly 65% to 135%, making the current setup notable from a fractal perspective.
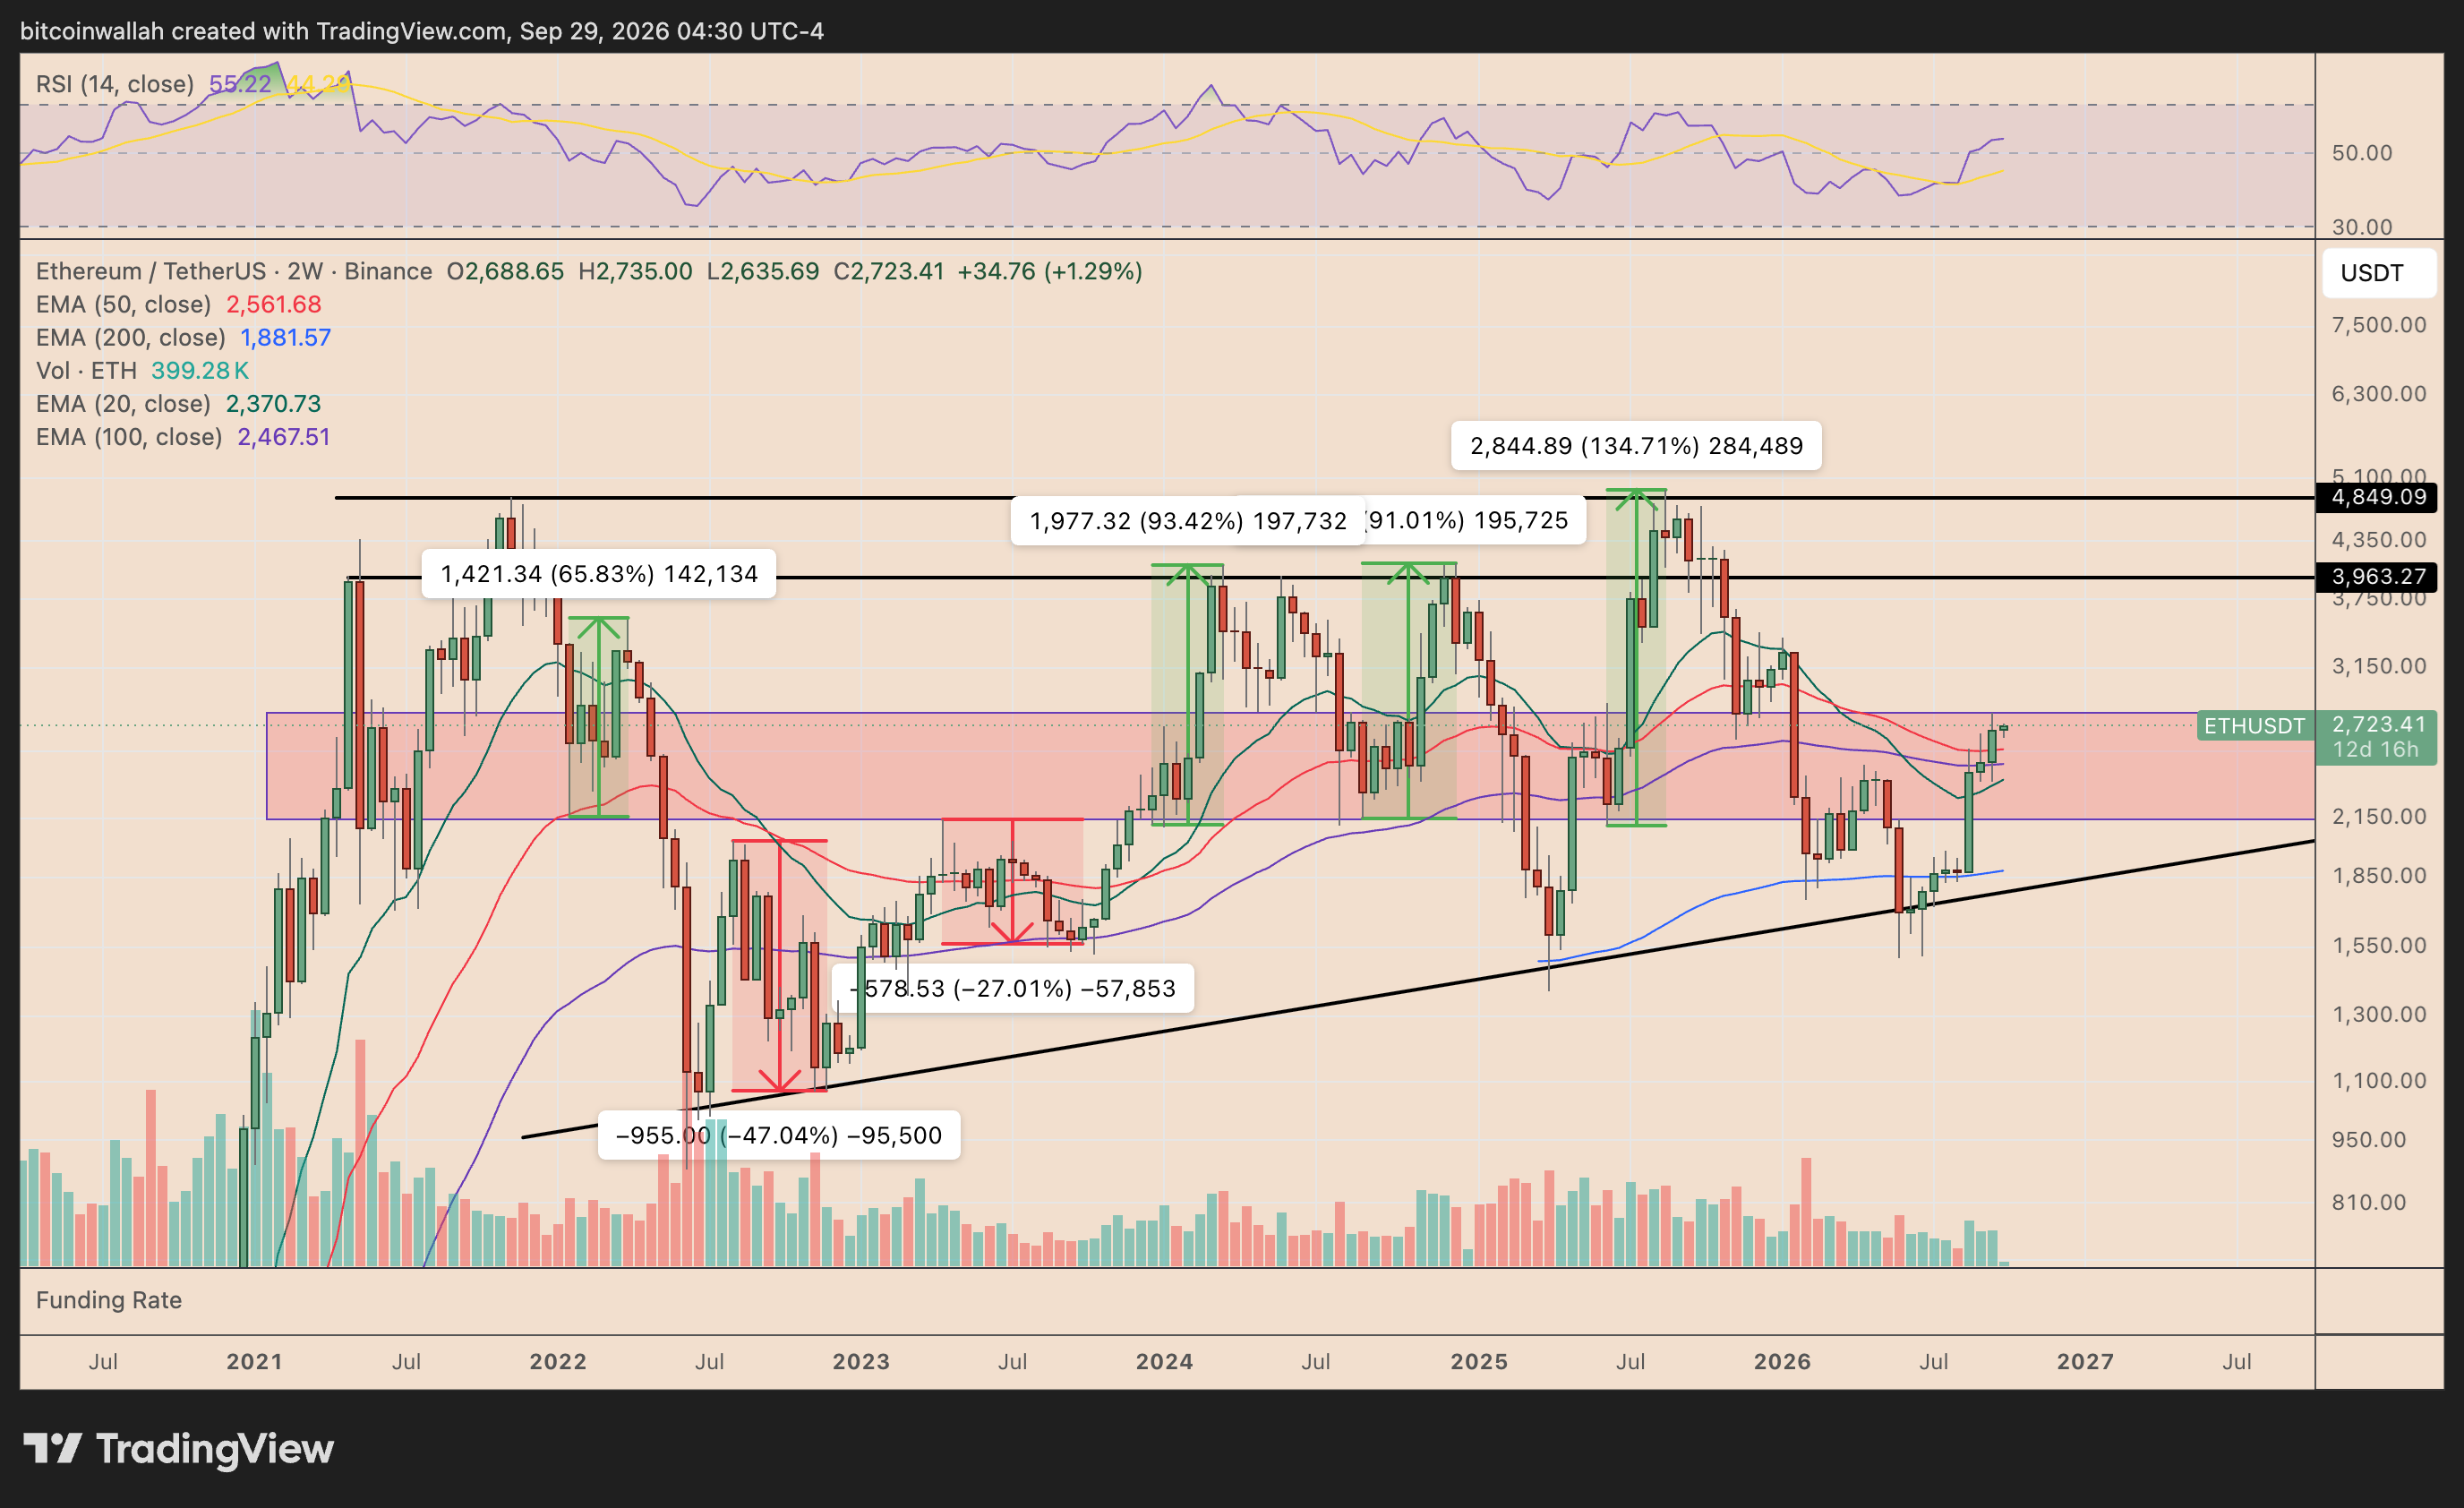
Ether has repeatedly used the same broad price area as a transition zone between consolidation and expansion.
In four previous instances highlighted on the chart, bullish breaks from around this region preceded advances of approximately 65.8%, 93.4%, 91.0%, and 134.7%.
ETH is now again testing the range ceiling near $2,750-$2,800.
A sustained move above the $2,750-$2,800 area may trigger a rally toward $3,963, approximately 45% above current prices. This level comes around the previous cycle tops.
Above $3,963, the previous record-high region near $4,850 would become the next major technical level, representing roughly 80% upside from $2,723.
Ethereum’s exponential moving averages (EMAs) also show an improving structure. ETH is trading above its 50-period EMA (red) near $2,562, 100-period EMA (purple) around $2,468, and 20-period (green) EMA near $2,371 on the two-week timeframe.
The two-week RSI is near 55, above the neutral 50 level but below overbought territory.
Ethereum Price Forecast
Every new Ethereum analysis as it publishes, today's technical signal and key levels, live price — on one page.
See all Ethereum forecastsWhat If The Bullish ETH Setup is Wrong
The historical pattern has not always resolved higher.
Previous bearish breaks from the broader range were followed by declines of approximately 27% and 47%.
That makes $2,150 the key downside level in the current structure.
A sustained breakdown below it would expose the 200-period EMA (blue) near $1,882. Applying the previous drawdowns to the same area points toward approximately $1,570-$1,140 under deeper bearish scenarios.
The bearish case also aligns with current macro risks, including renewed Federal Reserve rate-hike expectations, the ongoing US-Iran conflict, and elevated oil prices that are reviving inflation concerns and keeping Treasury yields high.


