Bitcoin (BTC) fell on Monday, moving away from the $98,000 target I projected in last week’s analysis.

Stalled US–Iran Negotiation Saps Risk Appetite
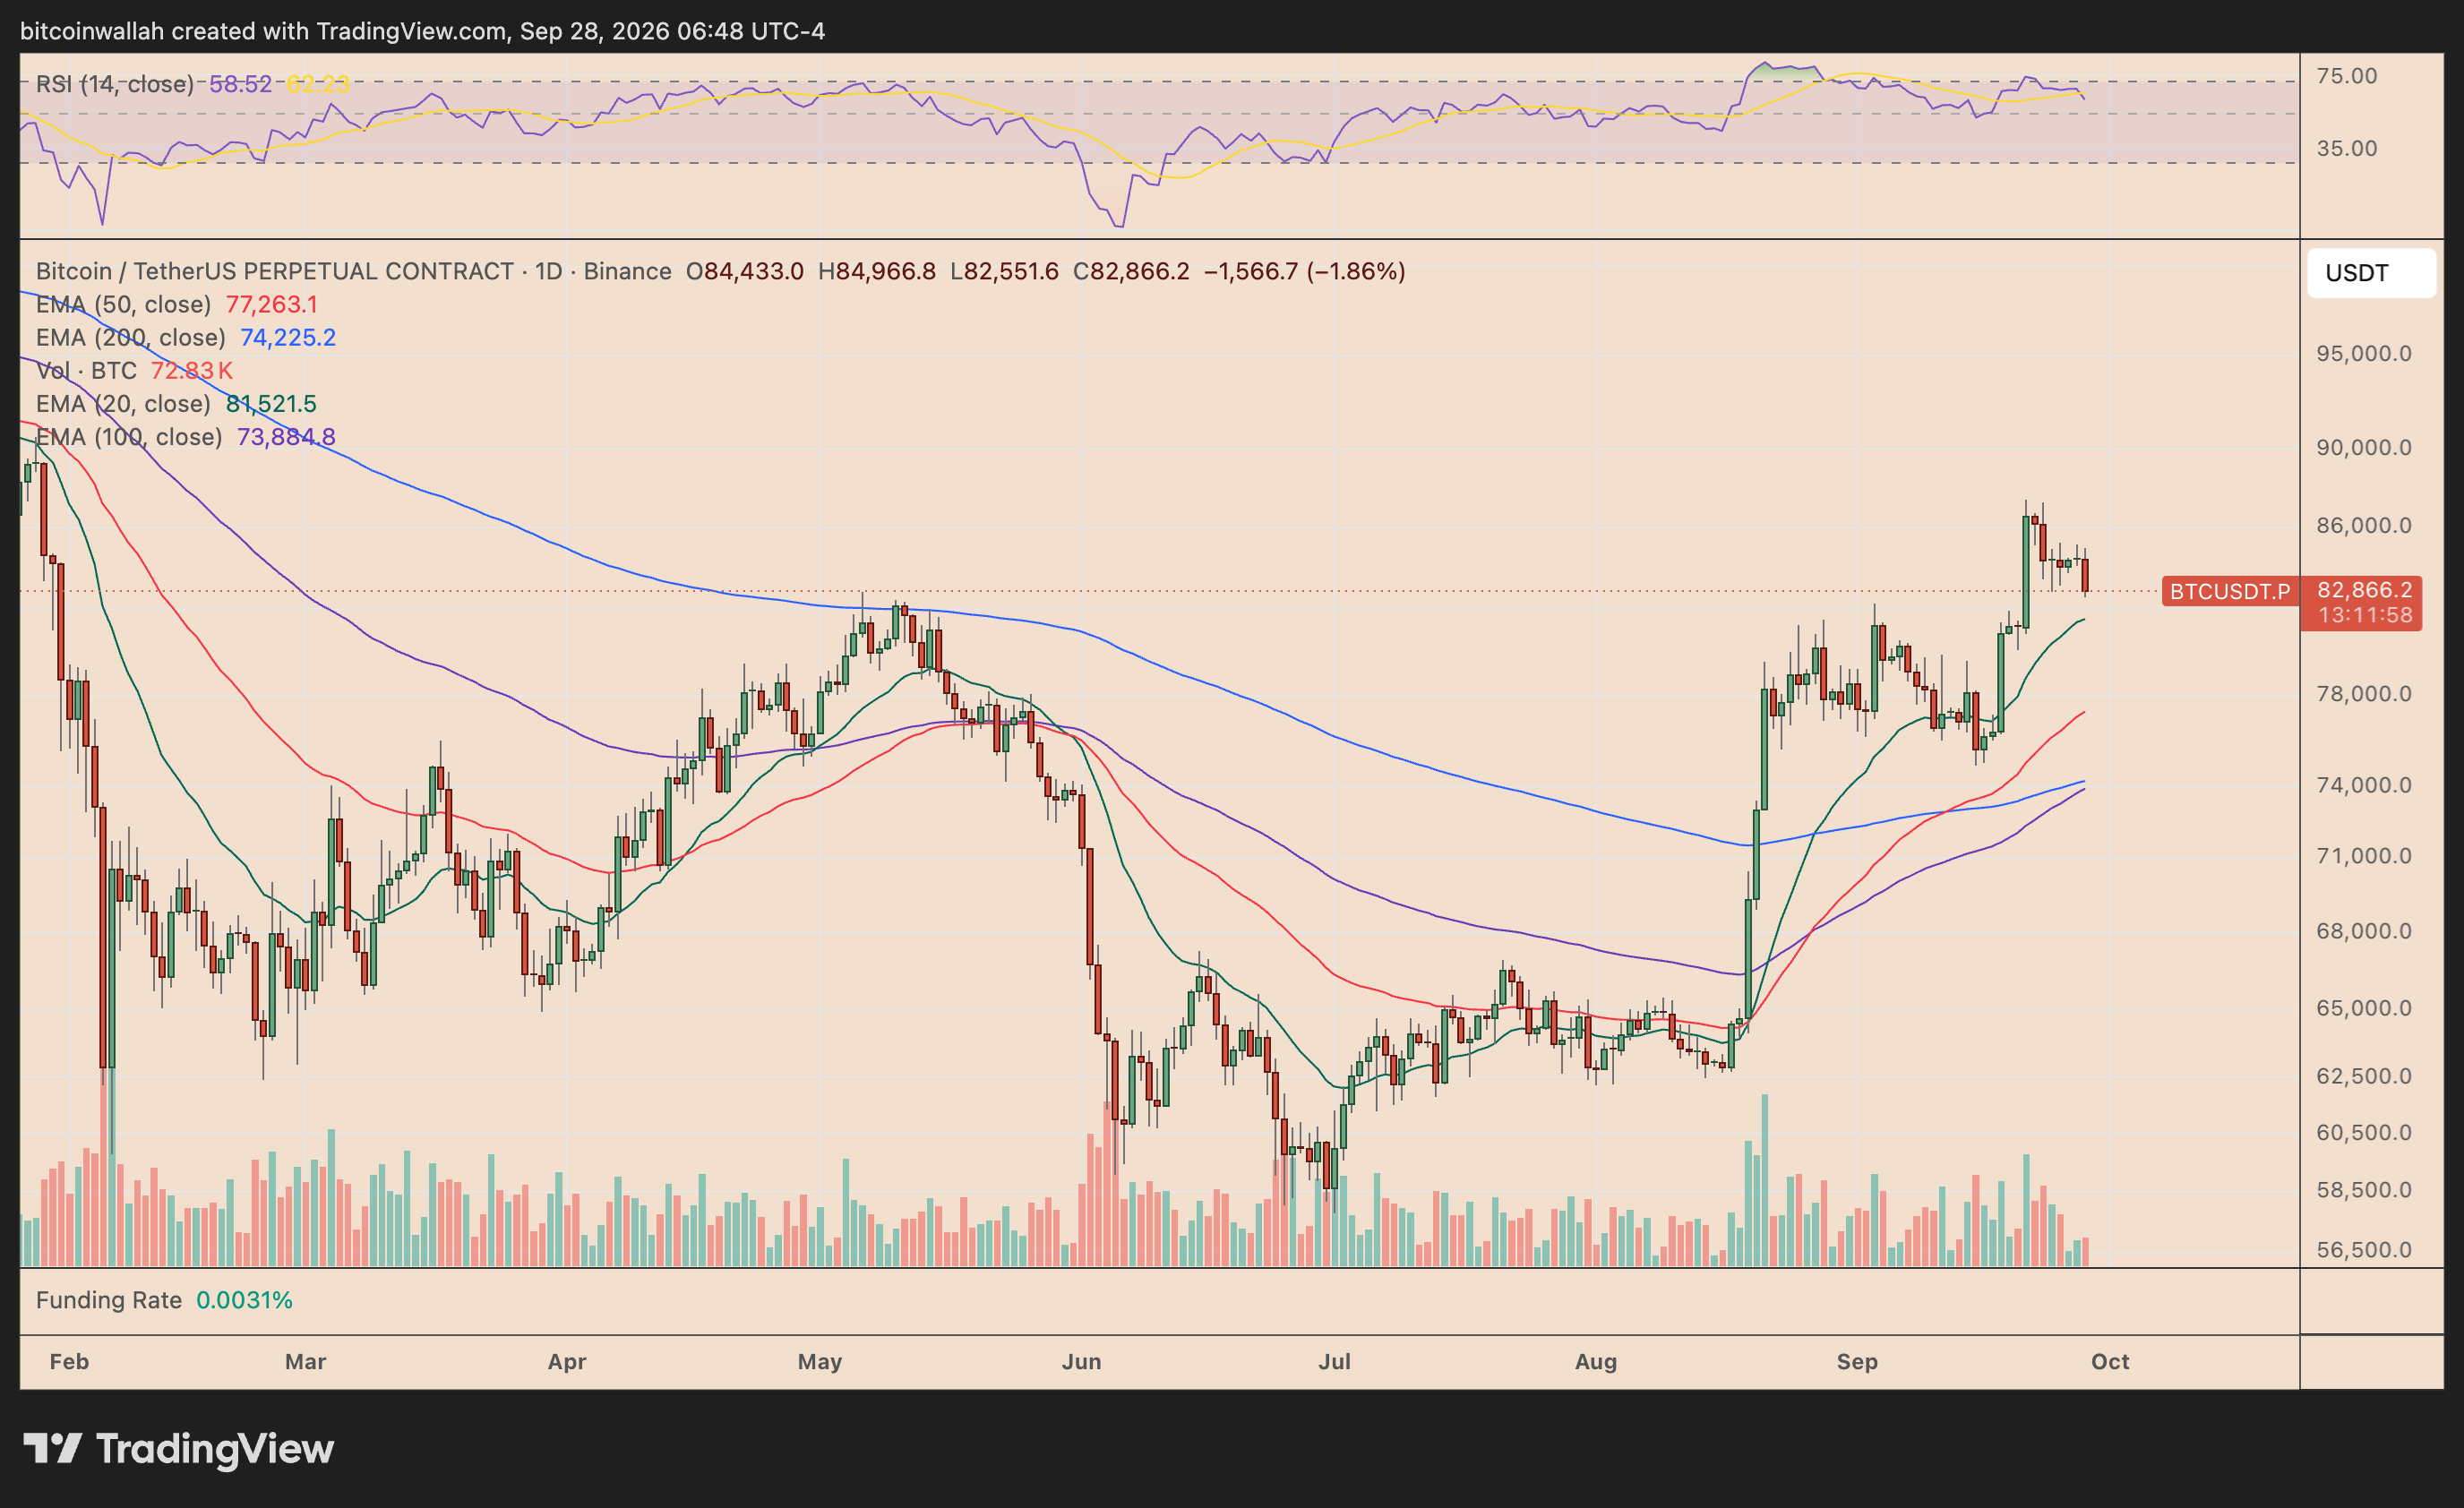
As of Sept. 28, BTC/USD was down about 2.25% at $82,550, its lowest level in a week, as a stronger US dollar and renewed geopolitical tensions weighed on risk appetite.
Over the weekend, US President Donald Trump rejected an Iranian proposal aimed at reopening the Strait of Hormuz and ending the conflict, while saying negotiations could resume this week.
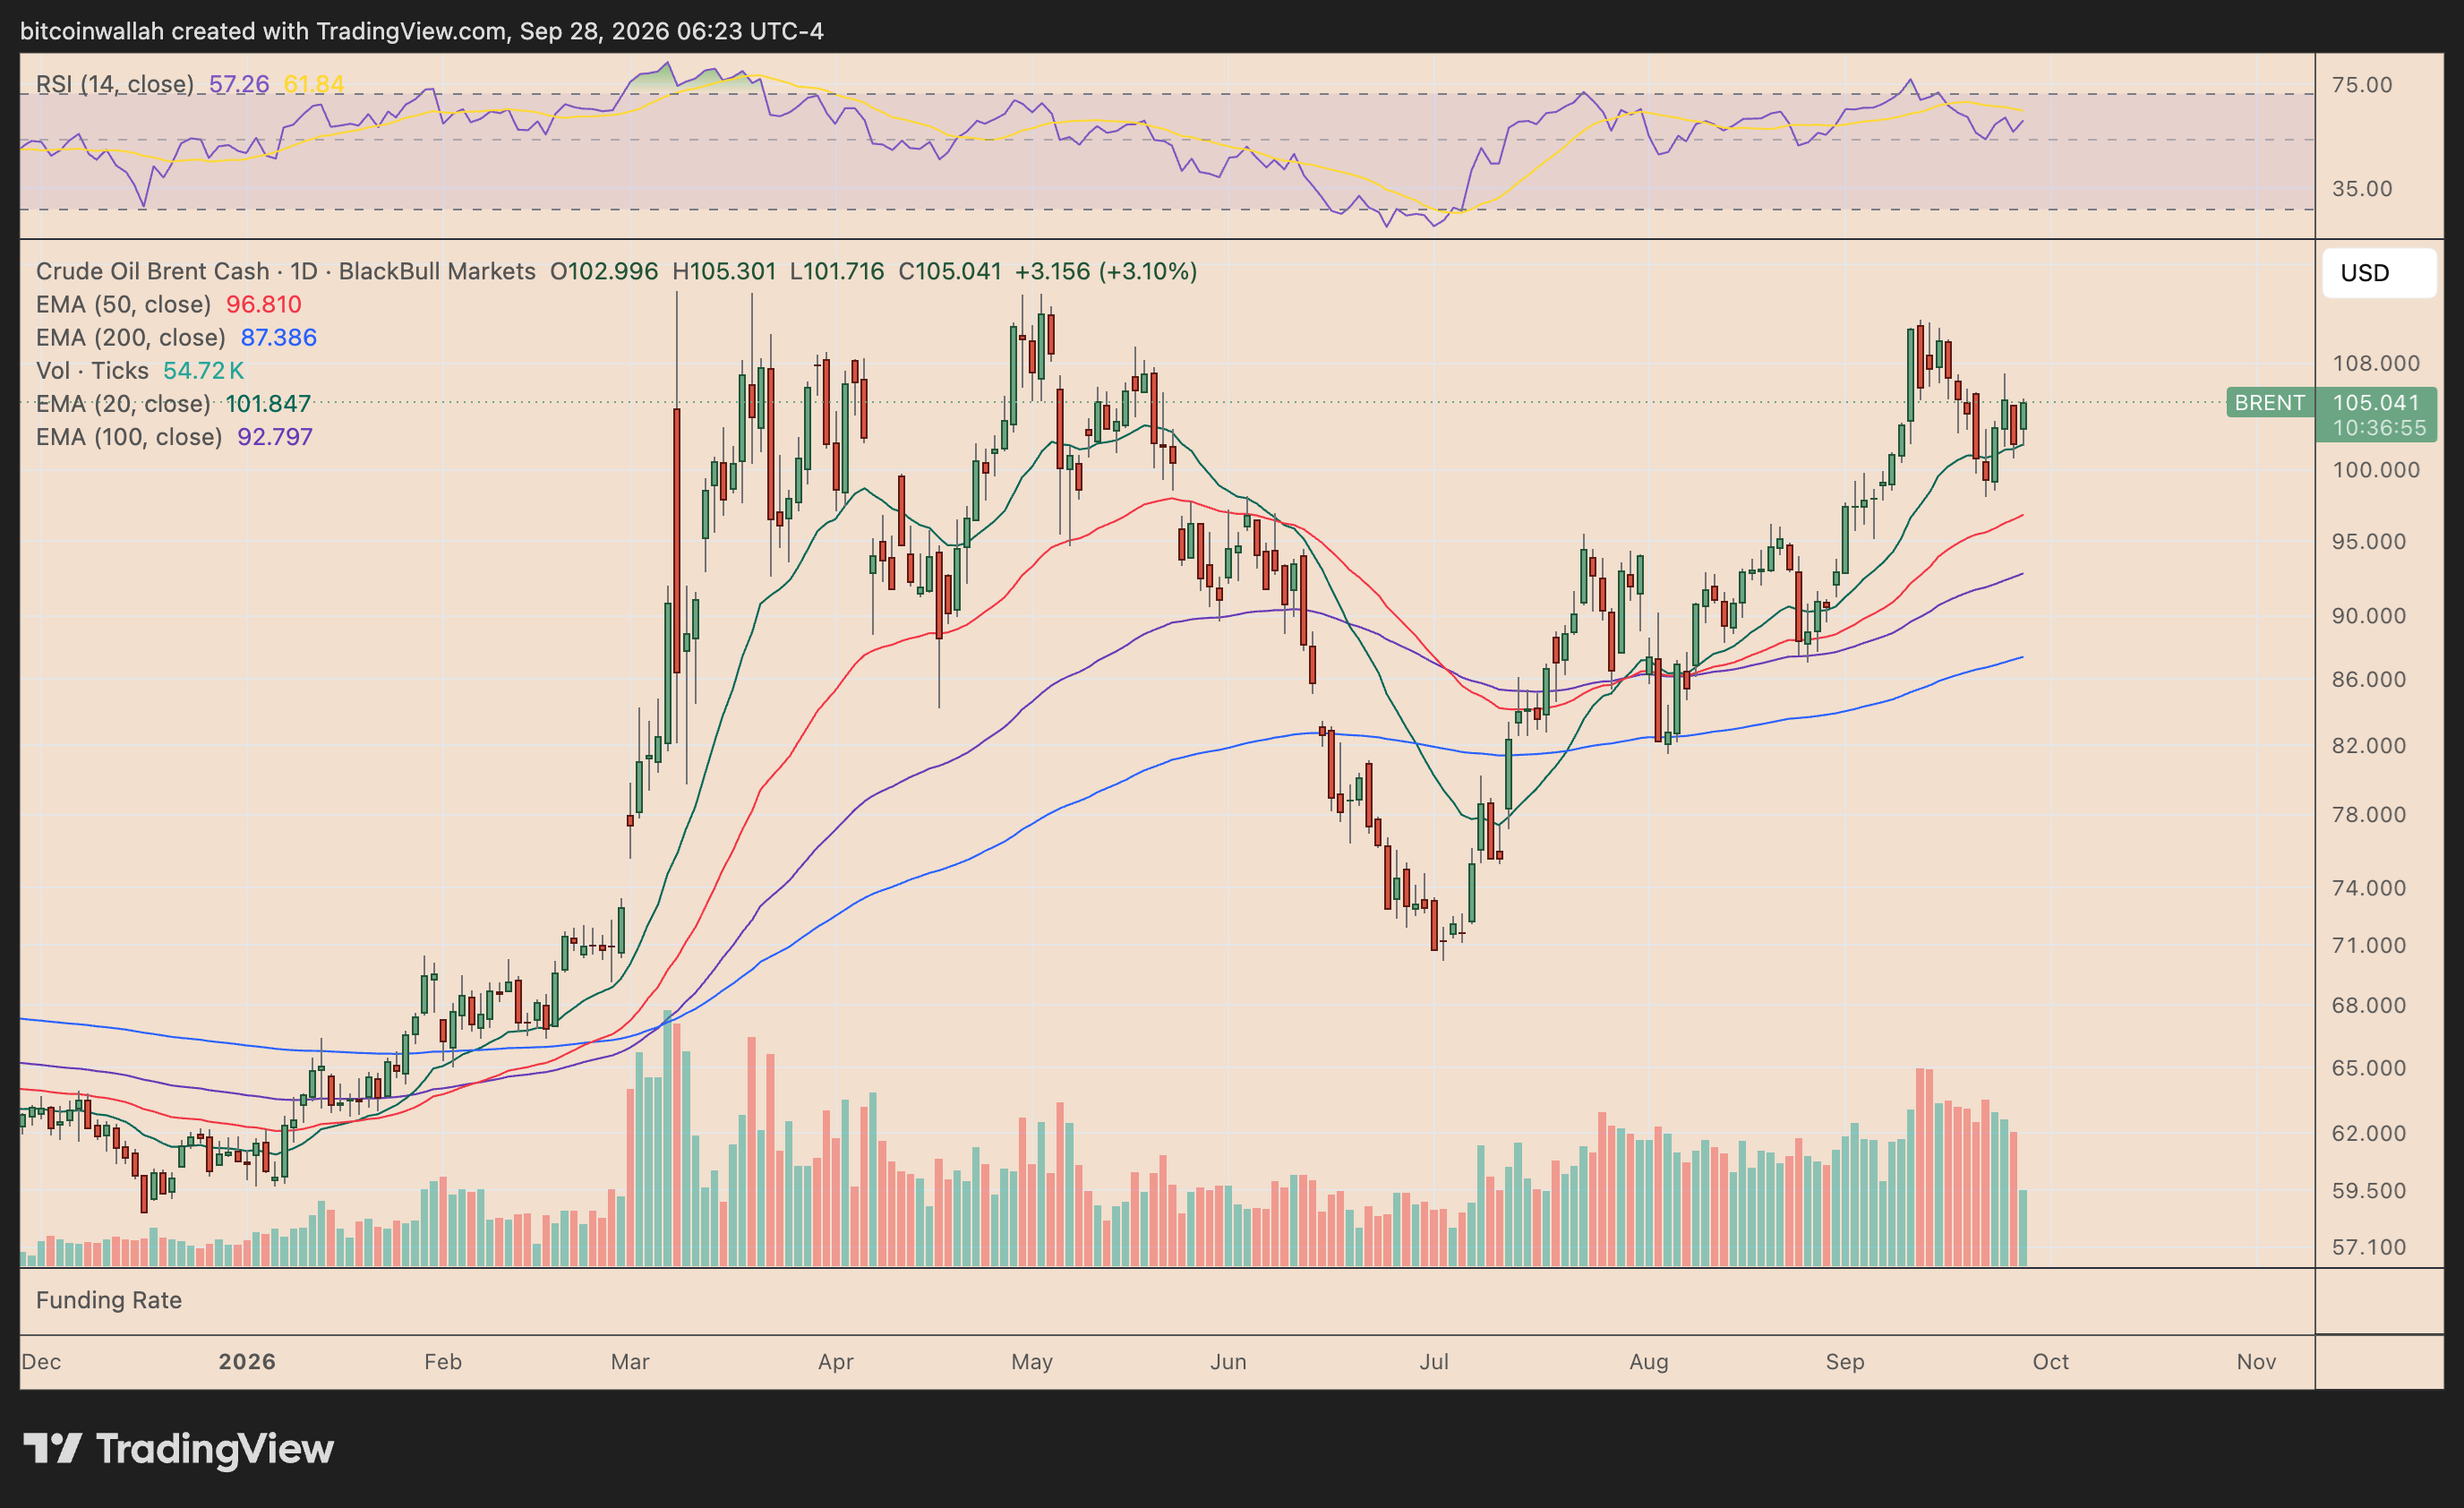
Higher oil prices added to inflation and bond-yield concerns, reinforcing demand for the dollar and hurting appetite for risk assets like Bitcoin.
Bitcoin Price Forecast
Every new Bitcoin analysis as it publishes, today's technical signal and key levels, live price — on one page.
See all Bitcoin forecastsBitcoin May Slip Under the $80,000 Support
Bitcoin appears to be heading toward its 200-4H exponential moving average (200-4H EMA, the blue wave) at around $79,000, a level that has repeatedly acted as dynamic support during prior corrections on the four-hour chart.
Earlier declines in late August and mid-September saw BTC retreat through the faster 20- and 50-period EMAs before stabilizing closer to the 100- or 200-period averages.
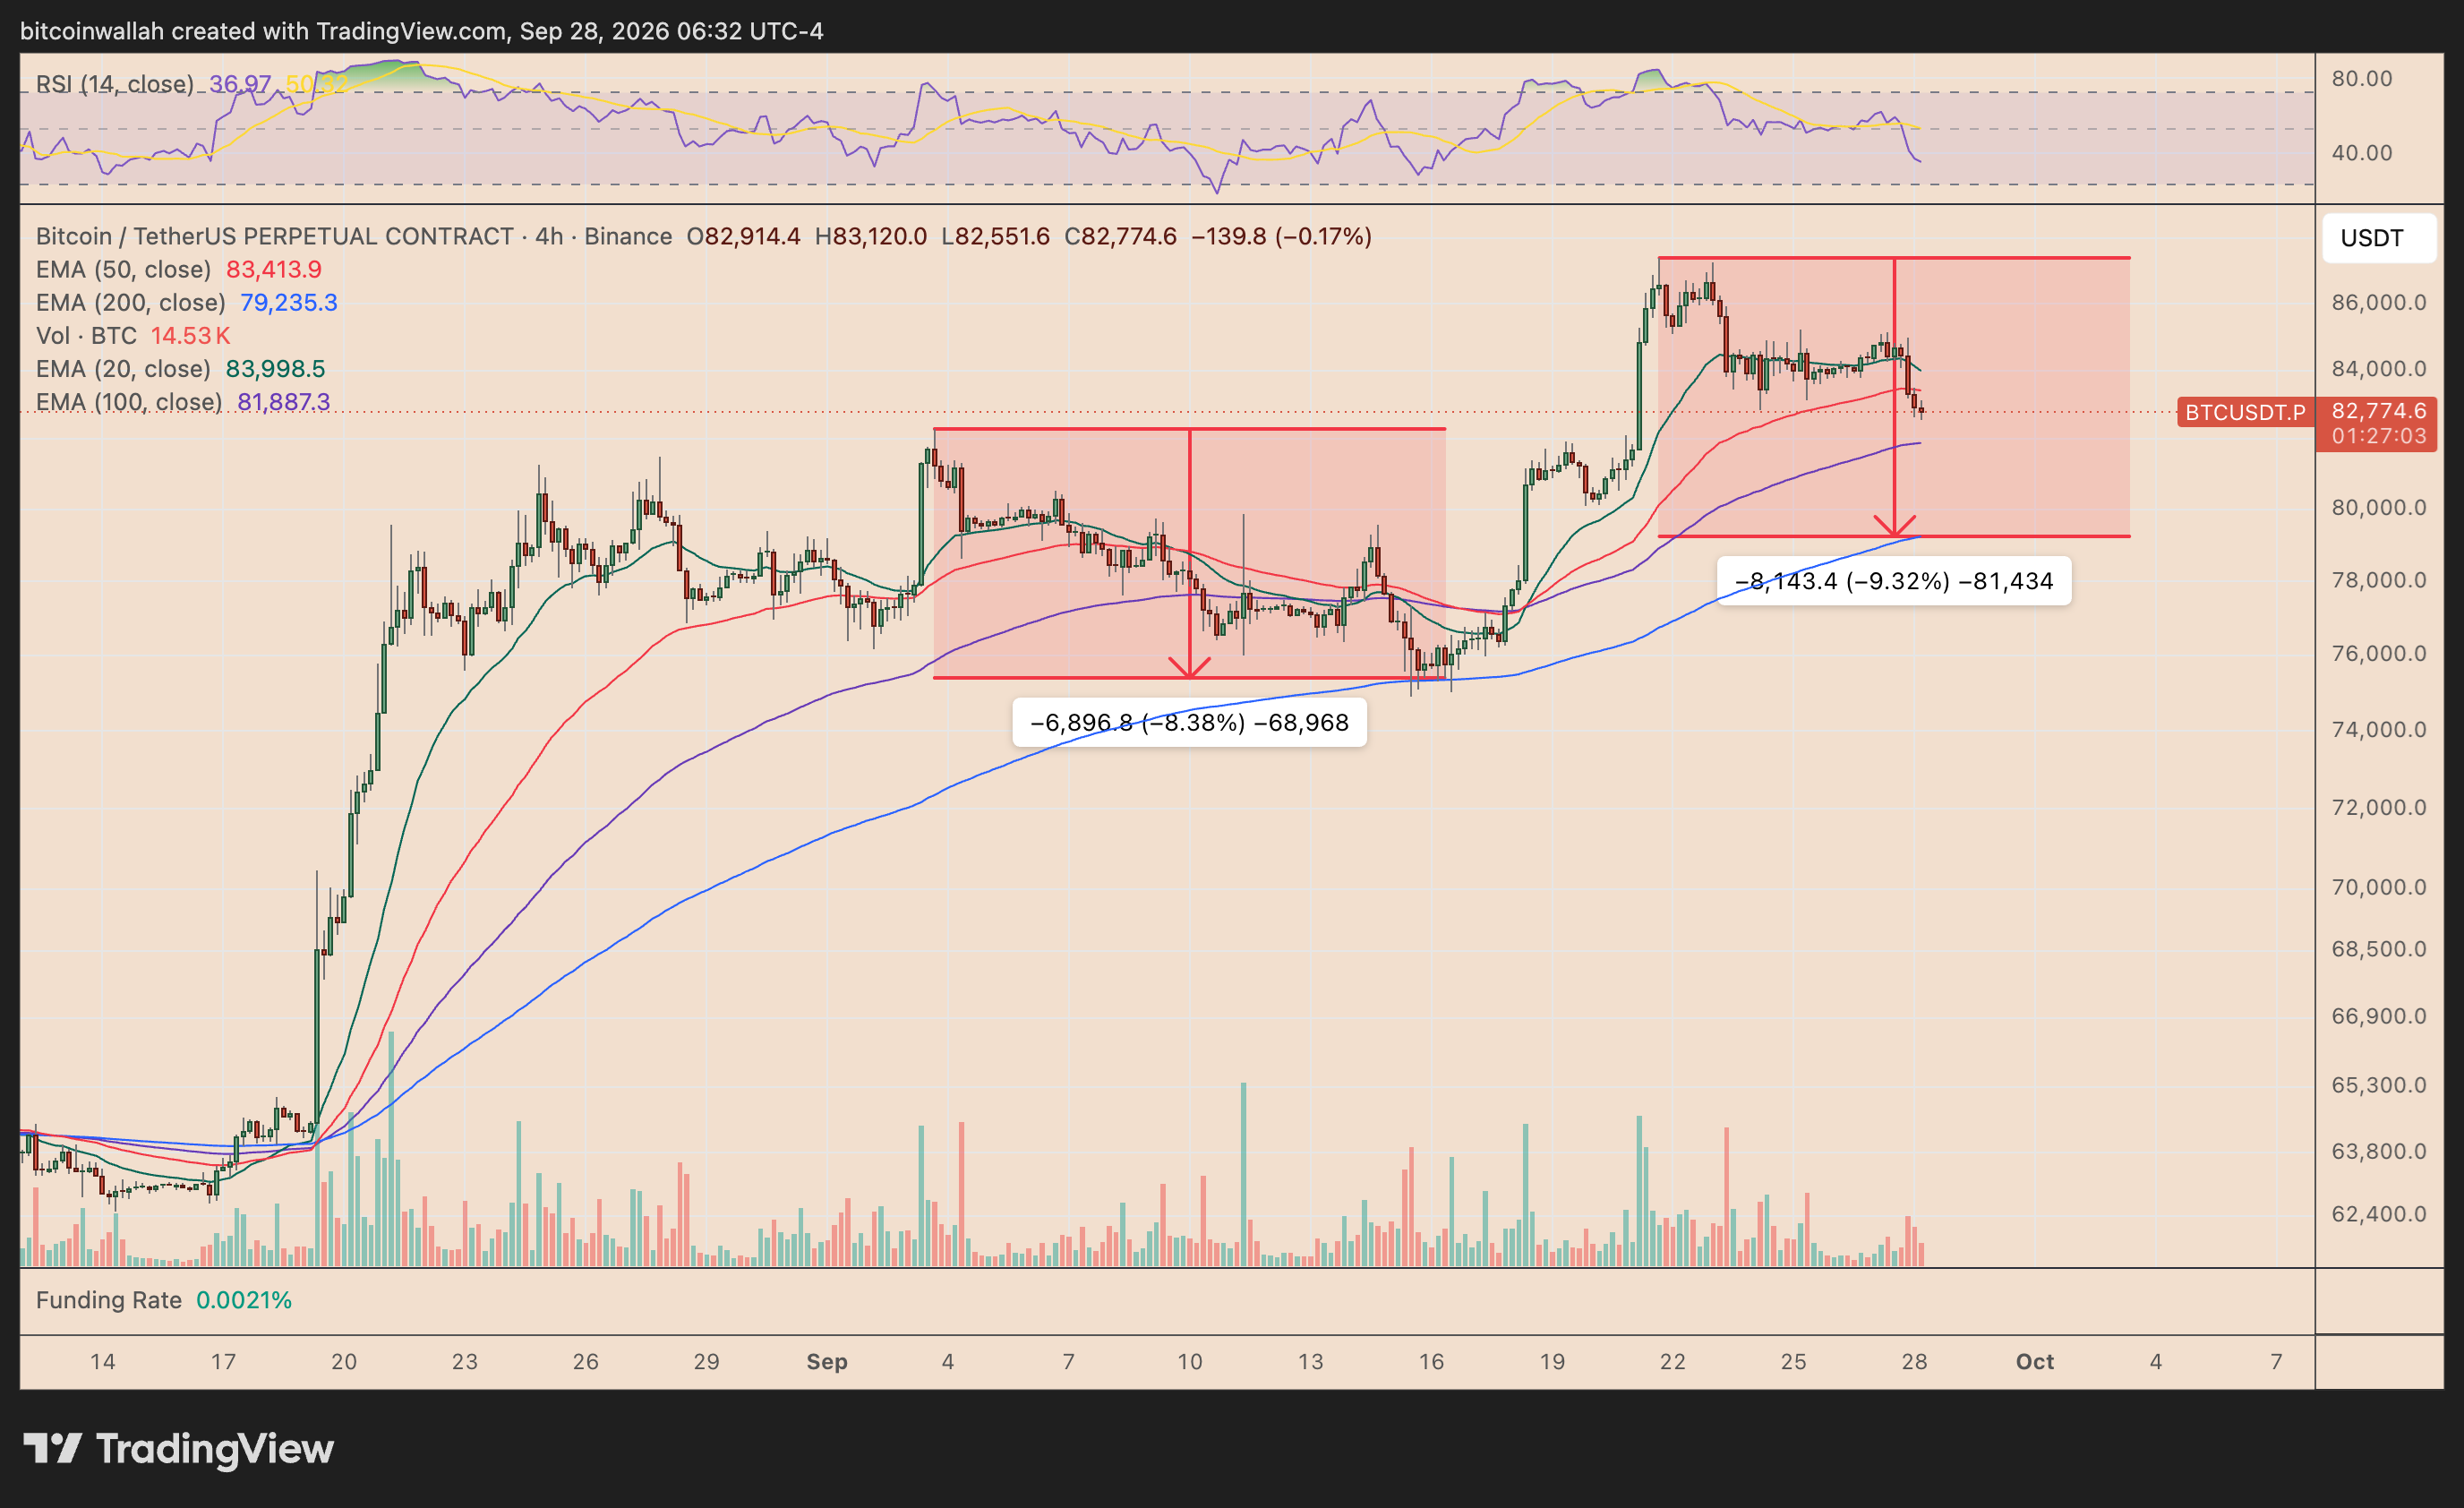
The current setup looks similar: price has slipped below the 20-period (green) and 50-period (red) EMAs, while the relative strength index (RSI) has fallen toward 37, signaling weakening momentum.
Unless BTC quickly reclaims the $83,400-$84,000 area, the 200-period EMA may become the next downside magnet.
I Stand By My $98,000 BTC Price Thesis: Here’s Why
Despite the latest pullback, Bitcoin’s broader bullish structure remains intact, keeping my $98,000 price target in play.
BTC recently broke above the upper trendline of a daily bull flag, a continuation setup that developed after its sharp rebound from the August lows. The current decline toward the $78,000-$80,000 region would not necessarily invalidate that breakout.
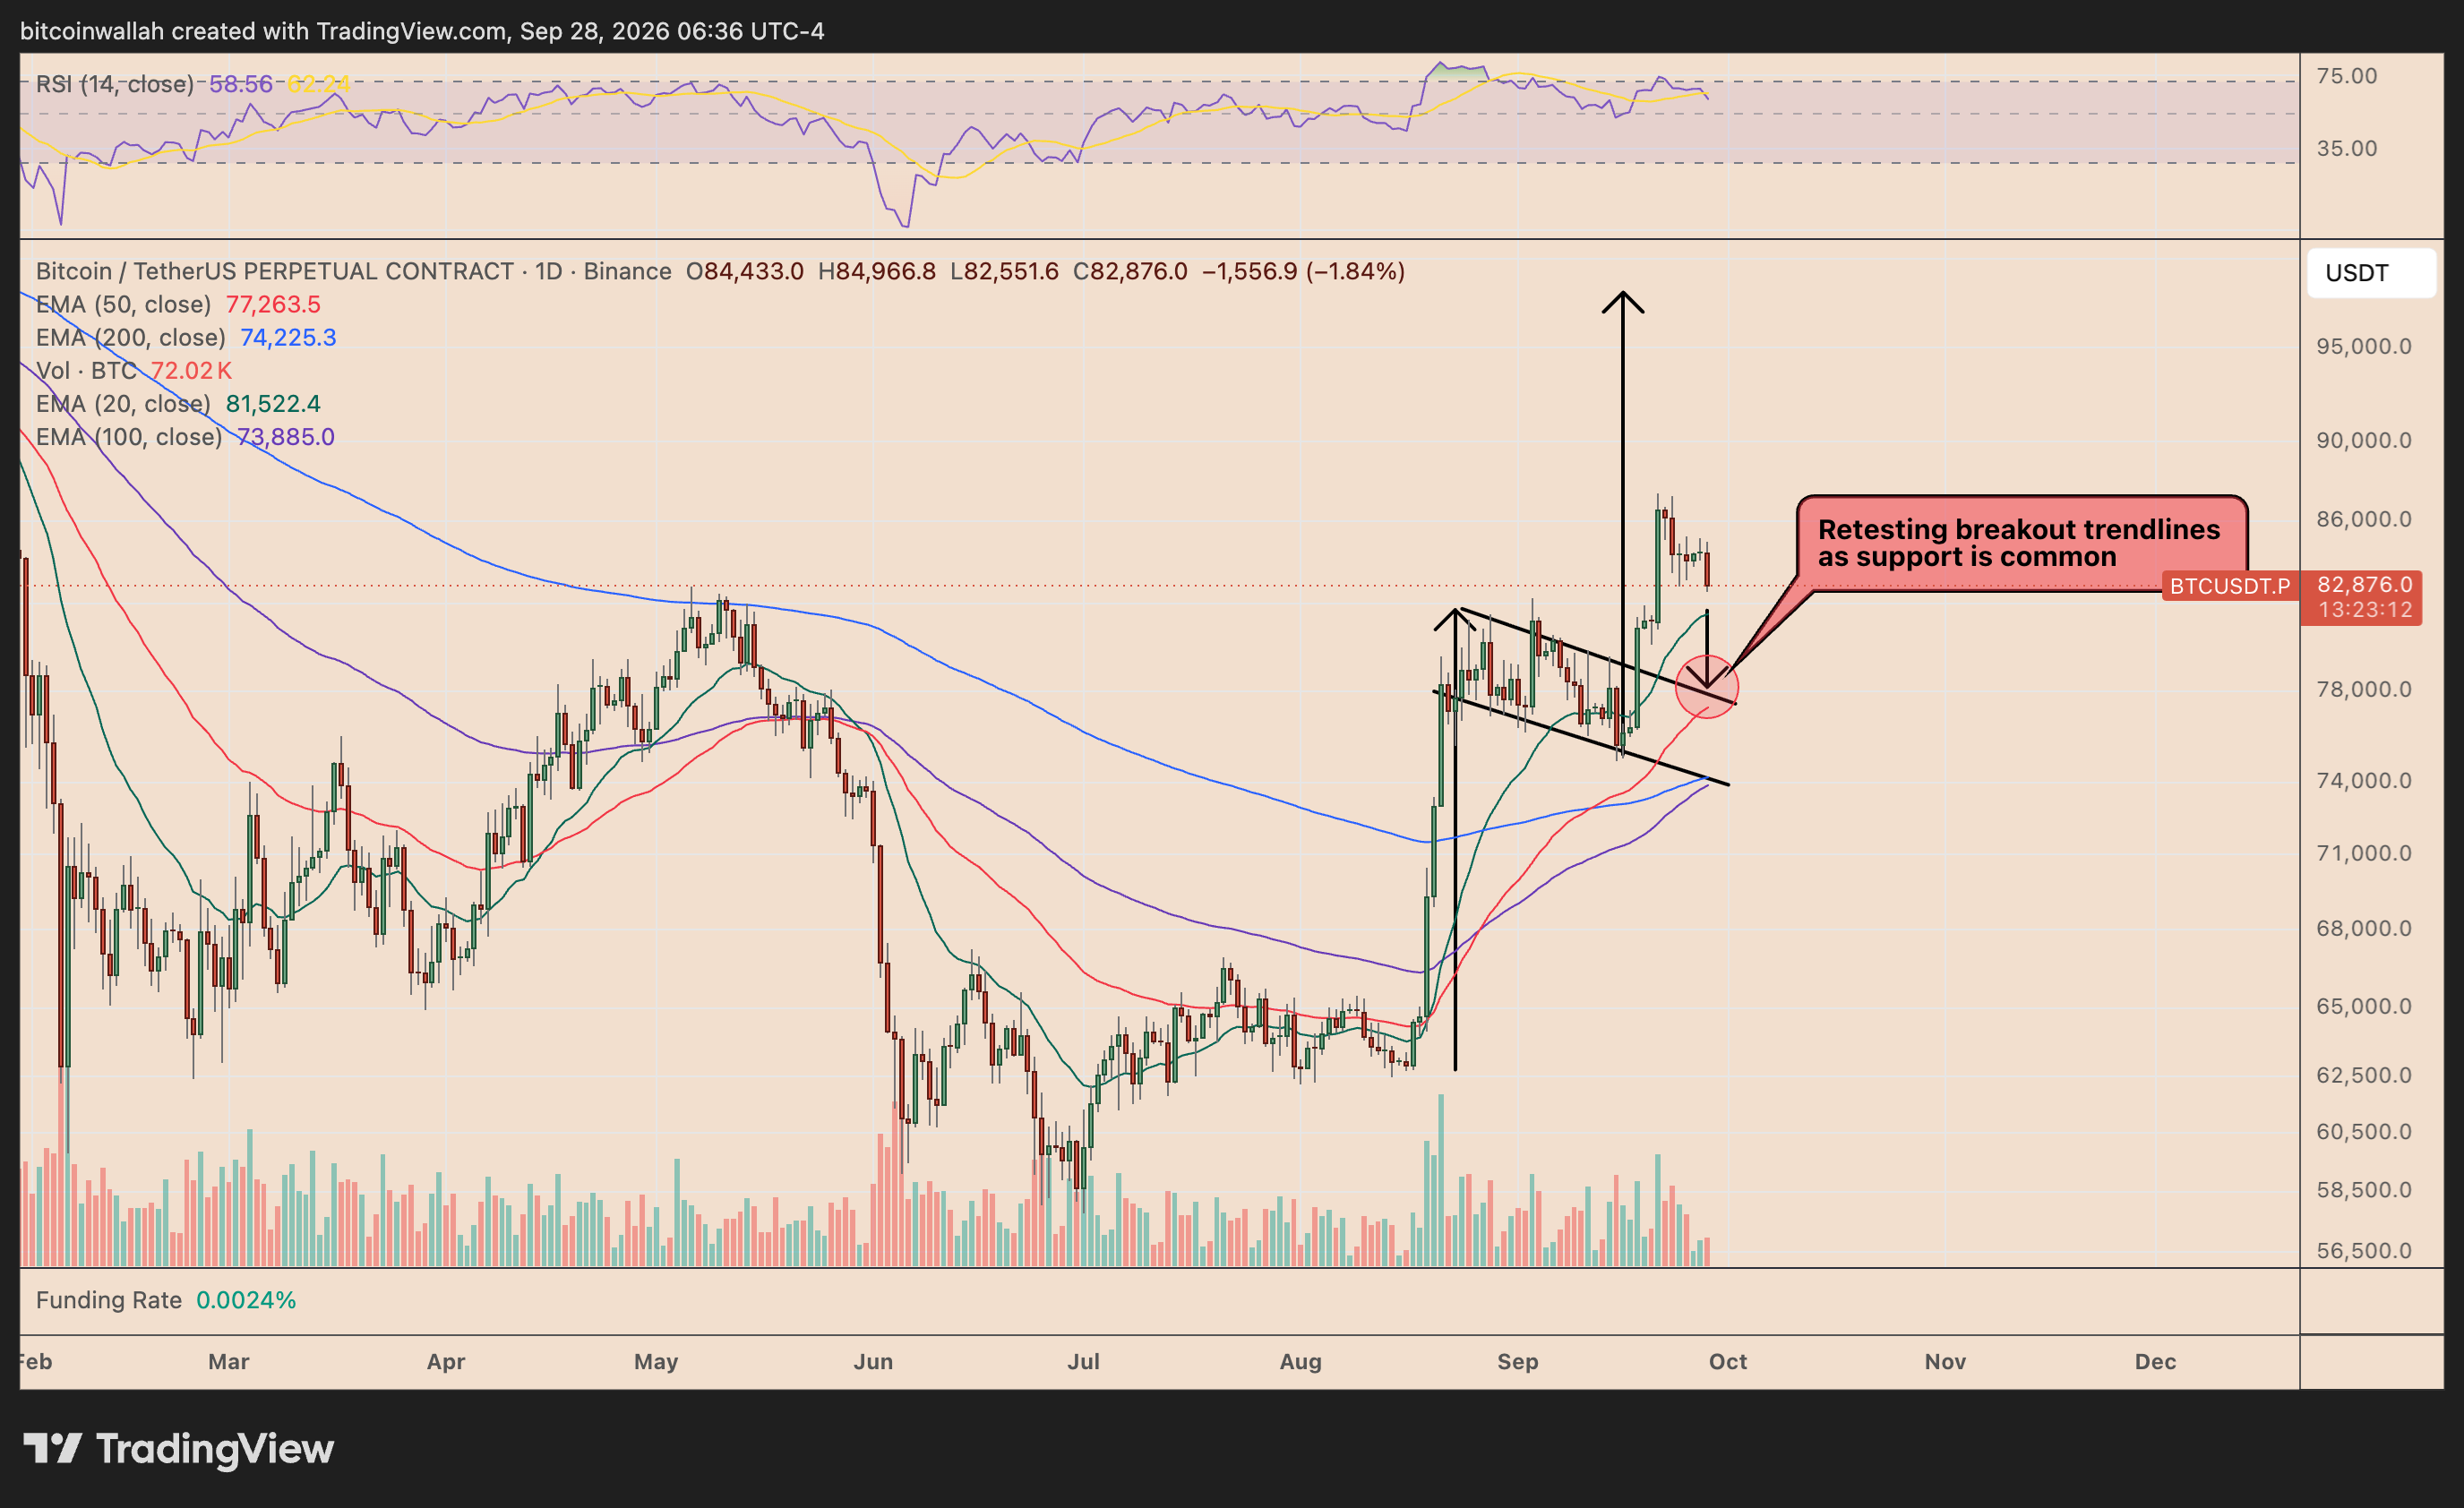
Instead, it could represent a conventional breakout retest, where former resistance flips into support before the next leg higher.
That retest zone also sits close to Bitcoin’s rising short-term moving averages, adding technical confluence. As long as BTC holds above the former flag resistance and avoids a sustained breakdown back inside the pattern, the bullish setup remains valid.
A successful rebound from this area would strengthen the case for another push toward the bull flag’s measured target near $98,000, roughly 18% above current levels.
A sustained move back beneath roughly $78,000-$79,000 would suggest the breakout has failed, increasing the risk of a deeper retracement toward the $74,000-$75,000 support area.
Short-Term Holder Profitability Supports the Bullish Case
Bitcoin’s on-chain structure also supports the broader bullish setup.
At around $84,500, BTC is trading above the estimated cost basis of its major short-term holder cohorts. The 1-4 week cohort sits near $78,300, while the 1-3 month and 3-6 month cohorts are positioned around $66,300 and $72,300, respectively, according to data resource CryptoQuant.
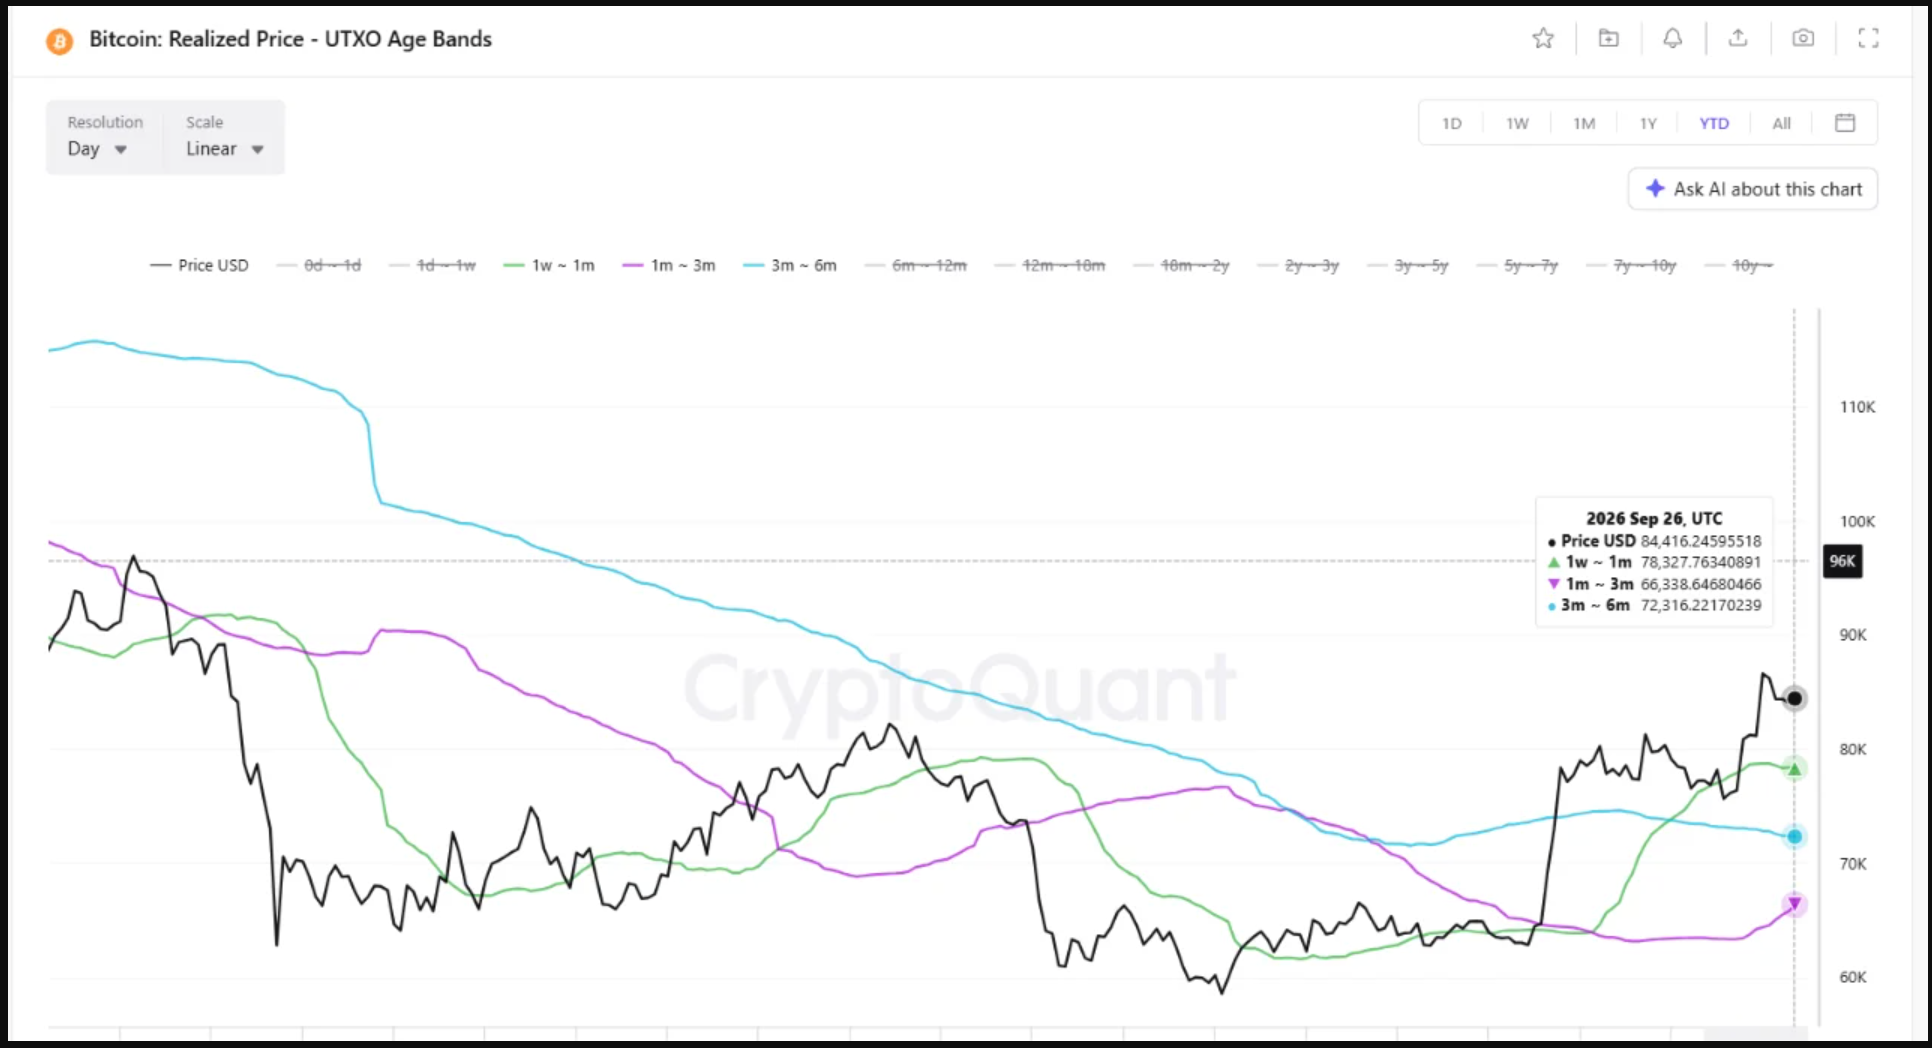
That means recent buyers are broadly back in profit, reducing the immediate risk of loss-driven selling during shallow pullbacks.
The strongest signal comes from the youngest cohort, whose cost basis is now above the older short-term groups, suggesting buyers have continued entering at progressively higher prices.
As long as Bitcoin holds above the $78,000-$82,000 support region, this improving holder profitability reinforces the case for another move toward $88,000-$90,000, with $98,000 still in play beyond that.