



Copper (XCU) dropped toward $6.60 on Monday as a strong US dollar and weaker data from China put buyers on the defensive. The drop in copper stocks and contract talks at Escondida mine in Chile could help limit the decline. Copper has gained ground against gold (XAU) and silver (XAG), but the price action in the short term shows pressure near the 50-day average. In my view, copper needs to hold $6.60 to keep a recovery toward $6.95 in sight. This article presents the forces behind the copper rally and the technical levels to understand the next move in copper.
Copper Fundamentals: China’s Slowdown Meets Escondida Supply Risk
Copper prices dropped on Monday and consolidated at an important support level as the US dollar index remains near the two-month high. The rebound in oil prices on Monday further added pressure to the copper price.
The data from China further support the correction in the copper market. The industrial profits rose 4.2% from a year earlier in August, down from 11.2% growth in July. The weakness was uneven. The profits in electronics remained strong, while profits in electrical equipment and car manufacturing declined over the first eight months.
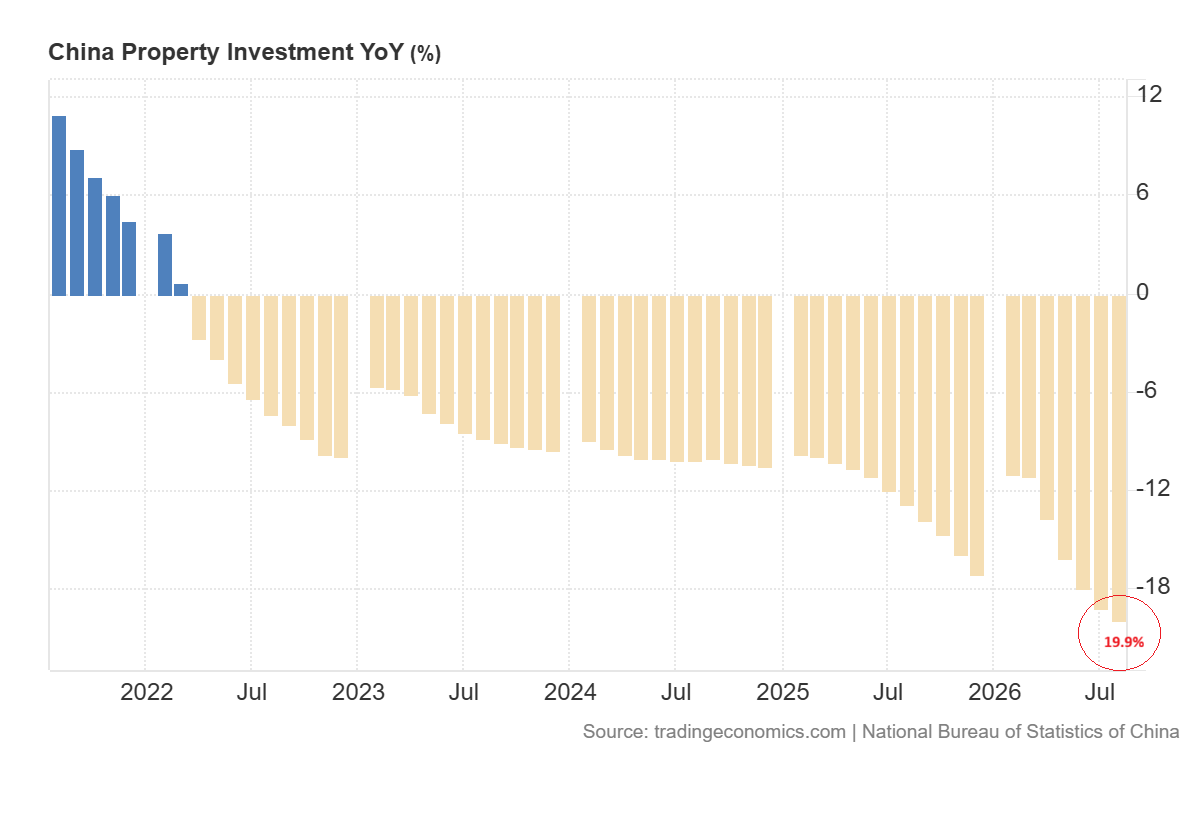
The property investment also dropped 19.9% from a year earlier in January-August. That leaves construction as a weak part of the copper demand outlook even as newer industries grow.
The supply offers some support. Shanghai Futures Exchange copper stocks fell 15.9% last week to 47,147 tonnes. Chinese manufacturers may buy more metal before the National Day holiday but high copper prices and spot premiums could hold back orders. The market now needs to see whether restocking continues at these prices.
Chile adds another uncertainty to the copper market. Escondida gradually resumed operations after the fatal accident last week. The supervisors are due to vote on contract offer from September 28 to 30. A rejected offer could lead to further talks and a strike. The risk of disruption may help copper resist the pressure from the dollar and softer data from China.
Copper Price Forecast
Every new Copper analysis as it publishes, today's technical signal and key levels, live price — on one page.
See all Copper forecastsCopper vs. the US Dollar, Gold and Silver: What the Charts Show
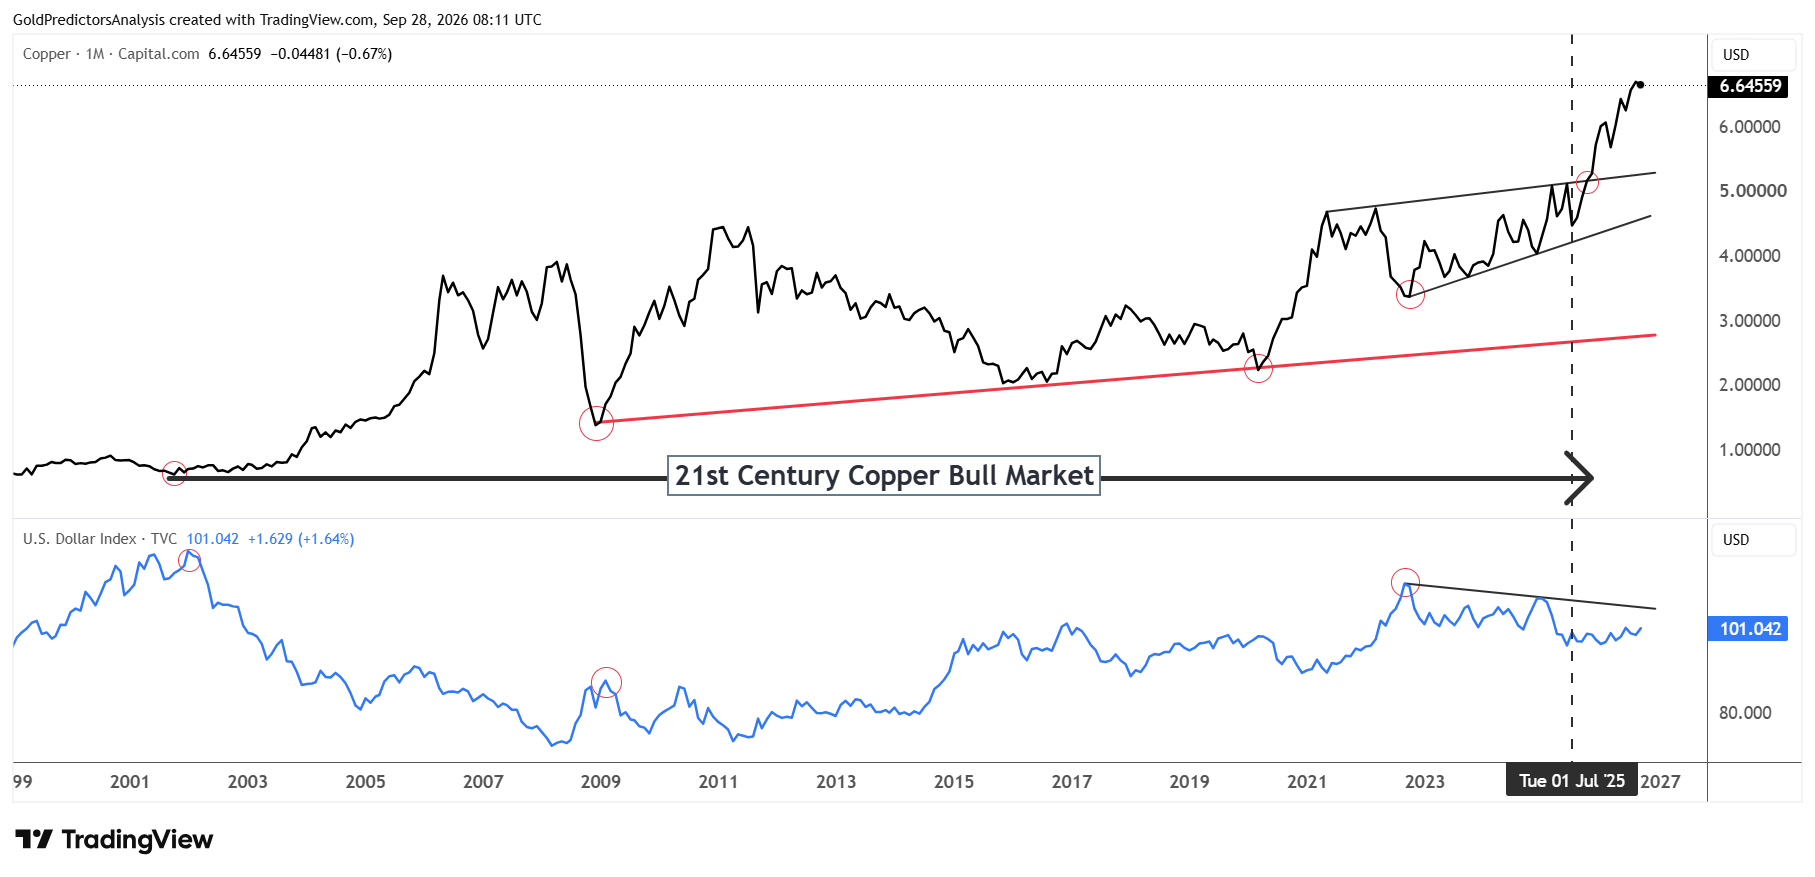
The chart below shows that the copper price trades near $6.65 and the US dollar index near 101. Copper has climbed above the upper line of the rising pattern in the long term despite the strength in the US dollar. The copper and US dollar can not always move in opposite directions, as the supply conditions of copper can still support the price.
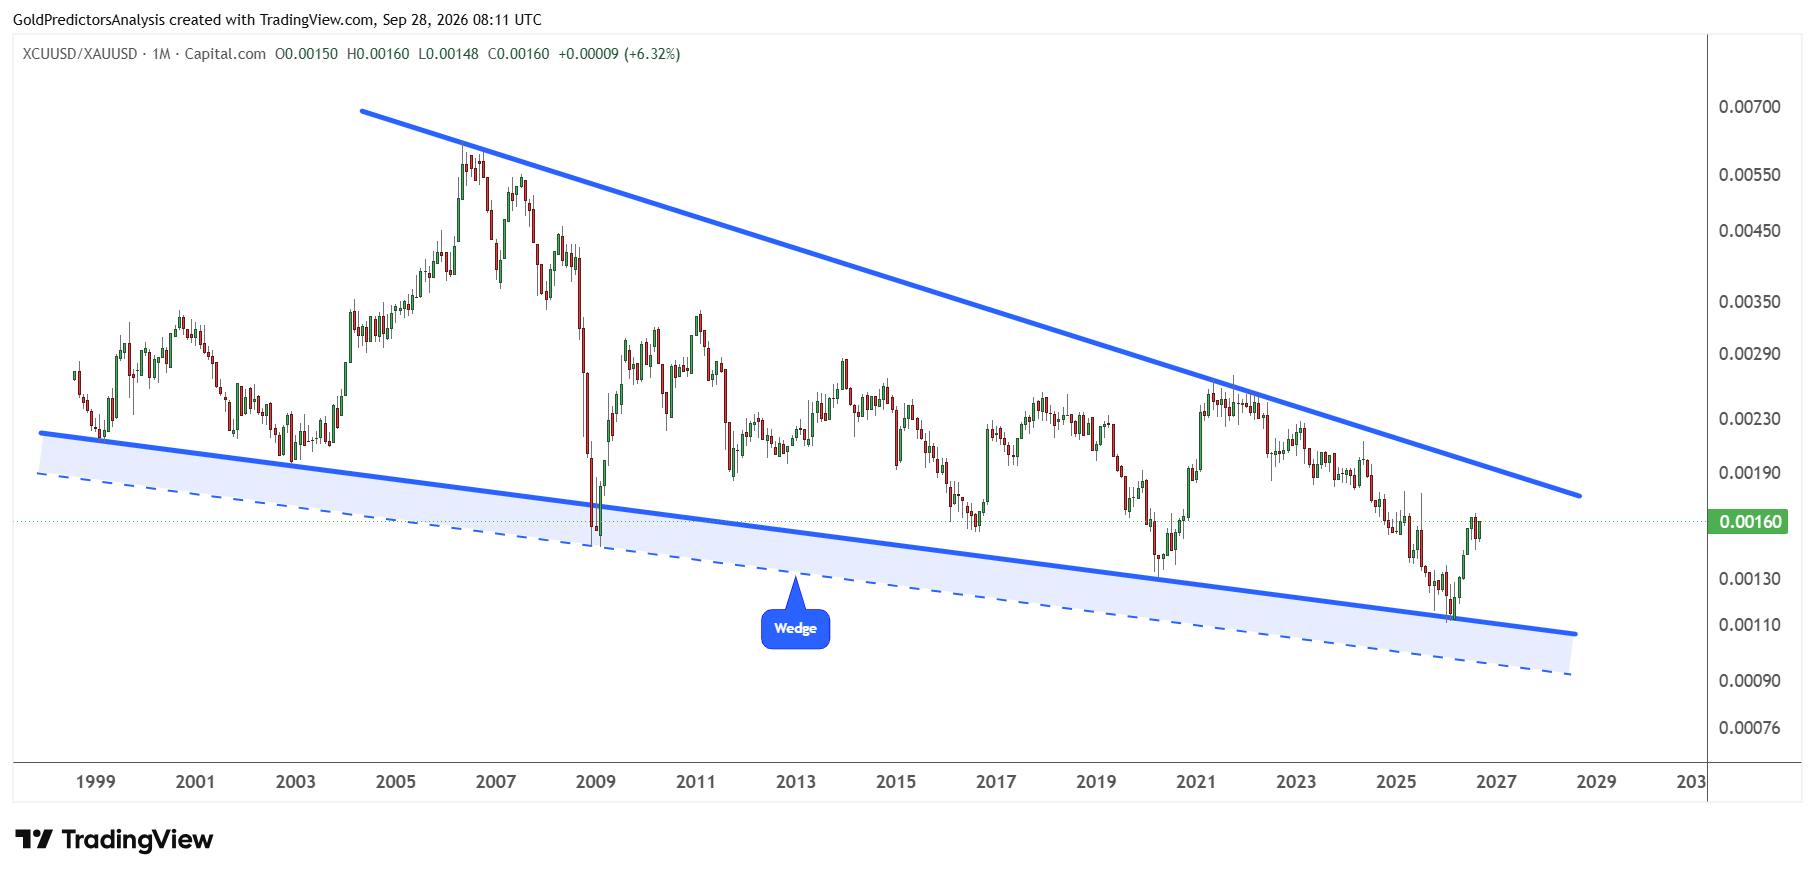
The copper to gold ratio has rebounded from support near 0.00110 to around 0.00160. Copper has gained ground against gold in September. The ratio still shows the resistance at the descending trend line near 0.0017-0.0018. A break above that area would give the recovery more force. But a break below 0.0014 would leave the pattern in place in the long term.
The copper to silver ratio tells a similar story. The ratio has recovered from channel support near 0.064 to about 0.109. It is now testing the 0.107 area, which mattered in earlier years. The monthly candle of September has not yet closed. A close above 0.107 would suggest a positive move in the copper market.
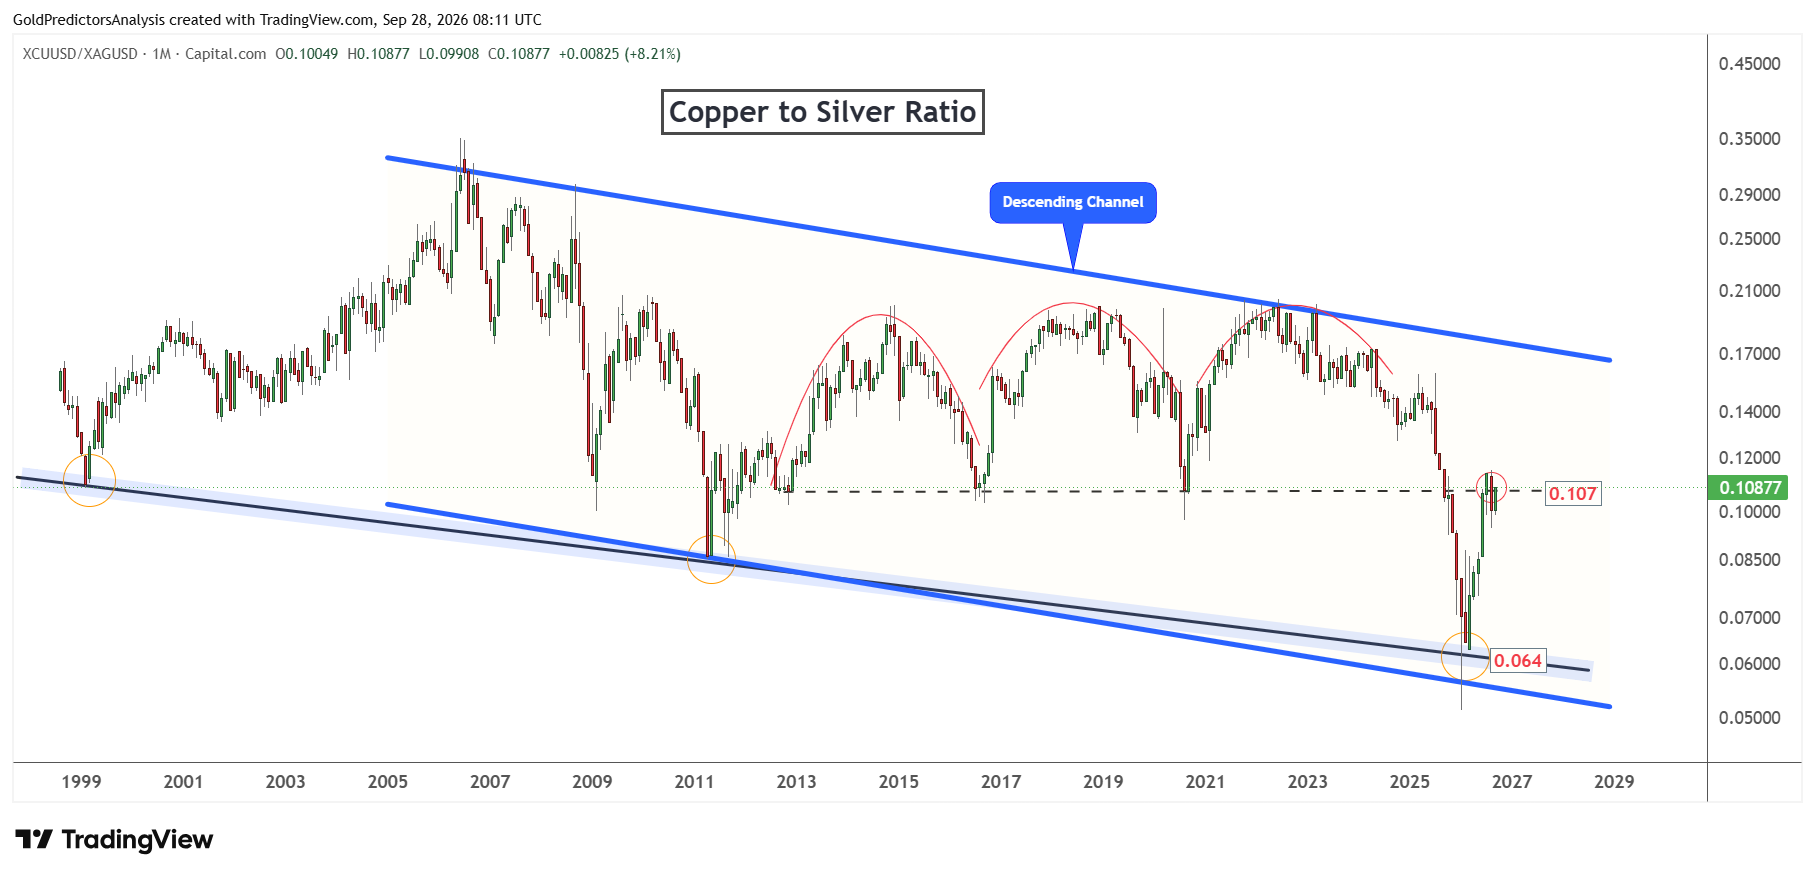
These ratios show relative performance in price, rather than a measured statistical correlation. They can rise because gold or silver falls, even when copper struggles.
Copper Price Forecast: $6.60 Support Faces a Test
Daily Chart Shows Copper Testing Its 50-Day Average
From a technical perspective, copper prices have been consolidating between $6.90 and $6.50 through August and September. The price reached a high of $6.95 on September 22 and then dropped sharply. The price has dropped 2.58% so far on Monday and is consolidating around the 50-day SMA. A daily close below $6.60 will extend the decline to $6.50.
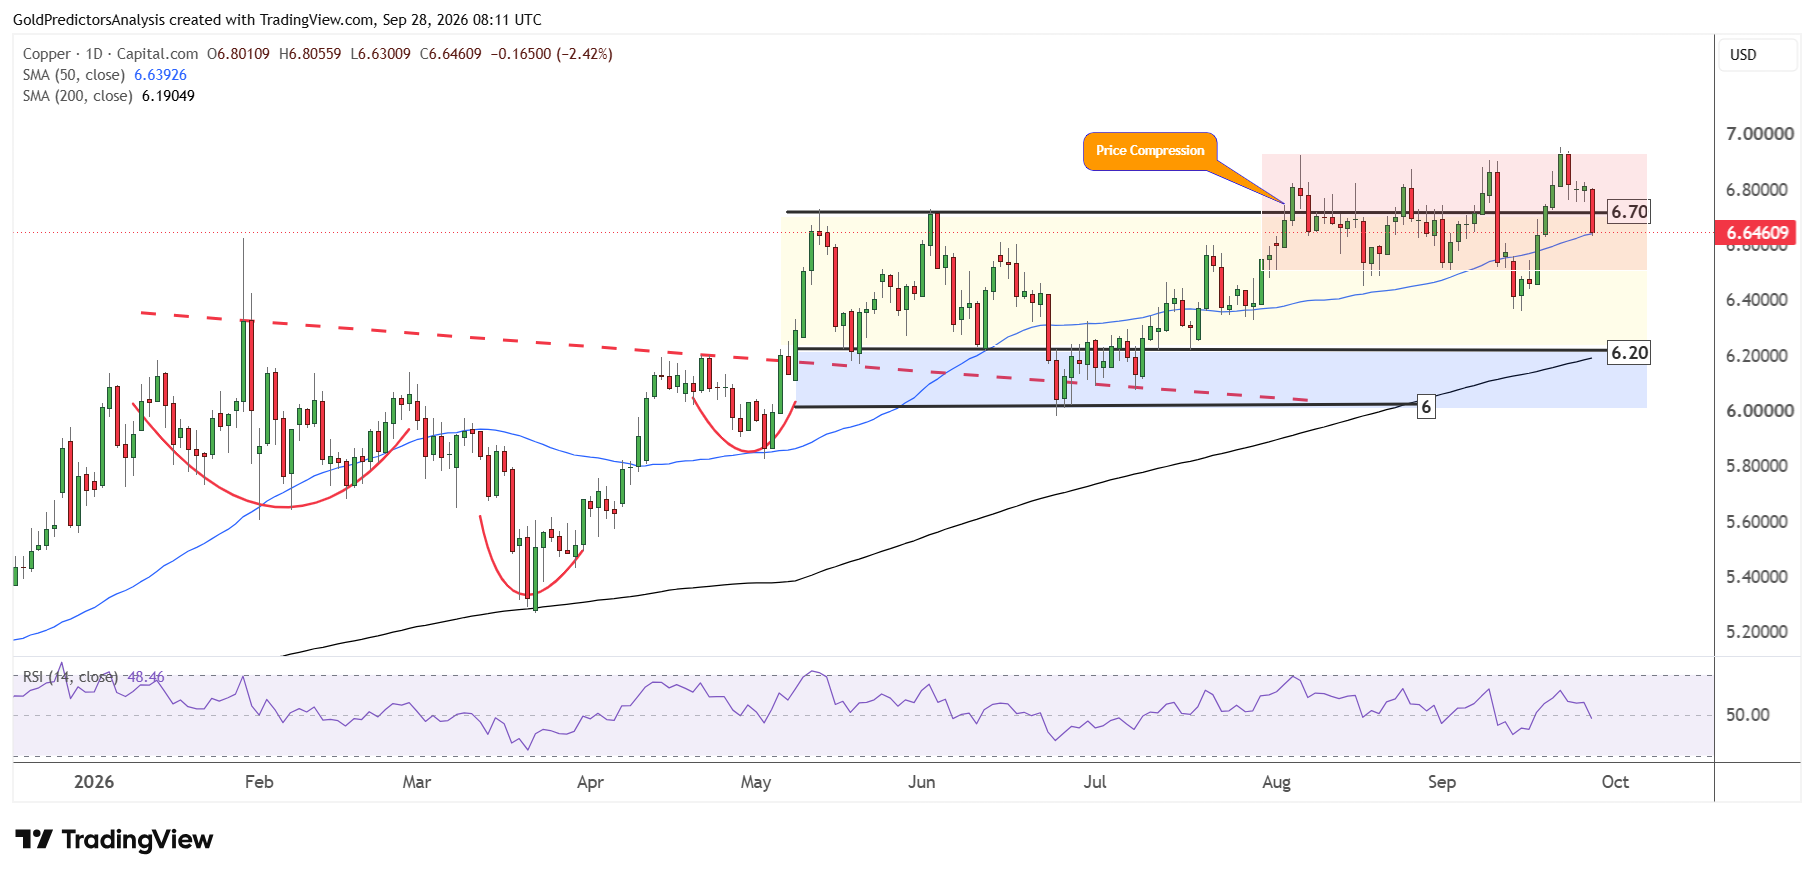
If the price breaks below $6.60 this time, the likelihood of a drop toward $6.20 will increase. This level is the strong support seen by the 200-day SMA. The support zone between $6.00 and $6.20 levels remains a key in the short term for the copper market.
A break below $6.00 will likely open the way for a strong drop toward $5.00. The RSI remains around the midline as copper prices drop toward the 50-day SMA on Monday.
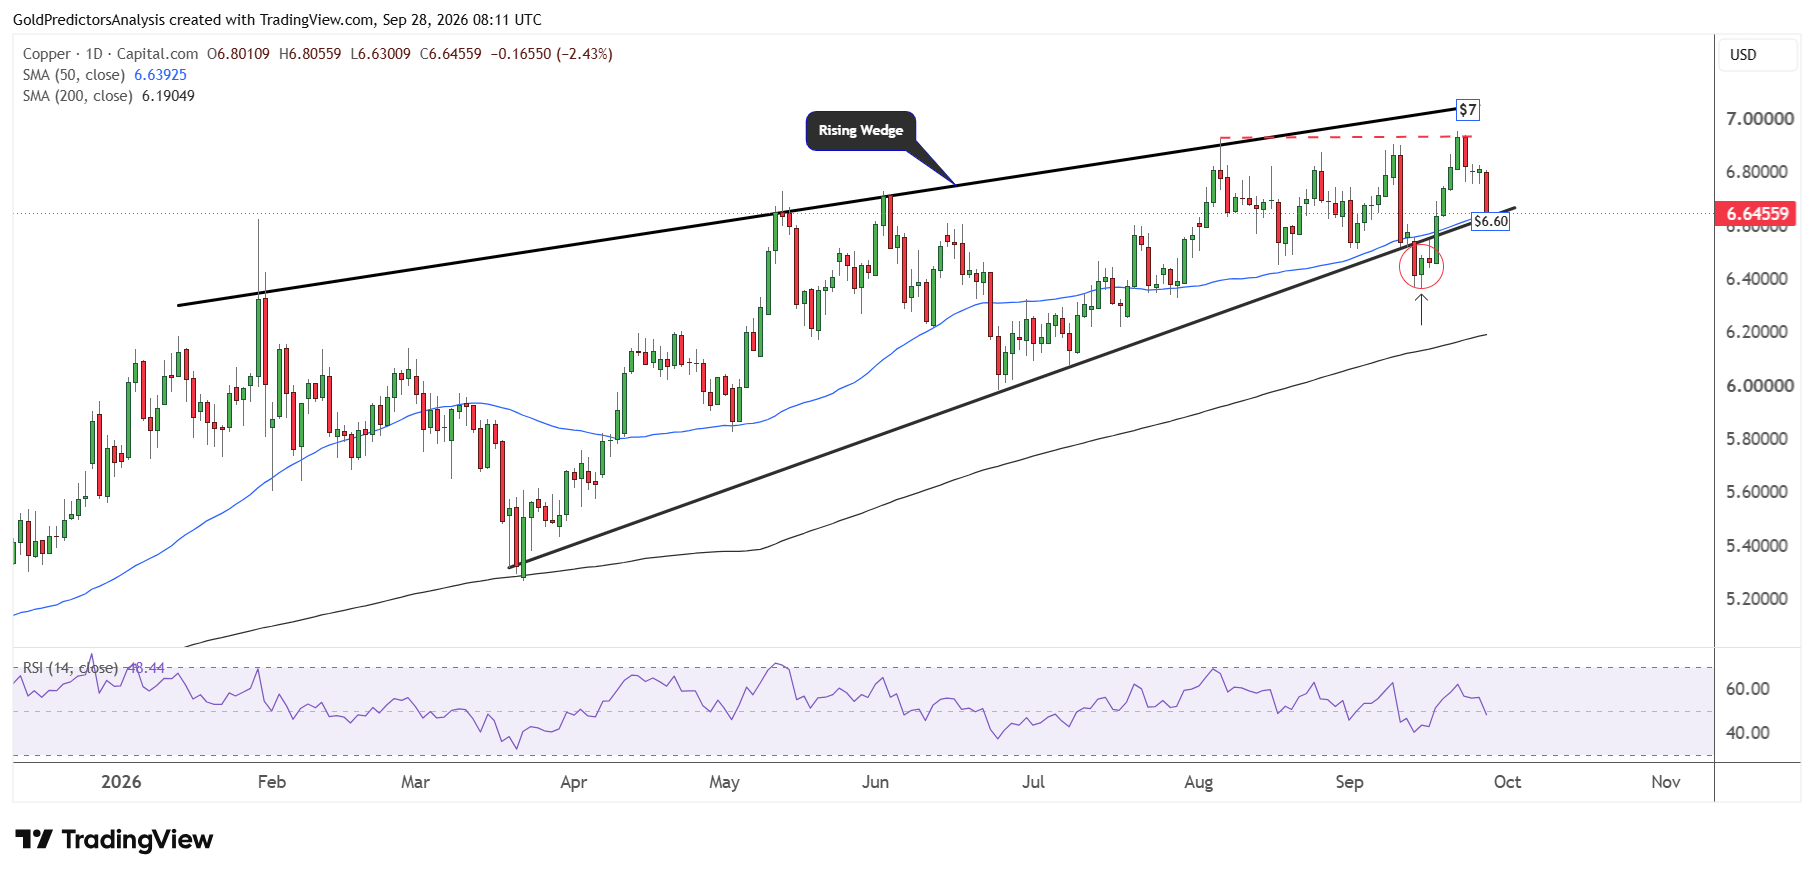
The importance of $6.60 is also seen in the daily chart below, which shows a rising wedge pattern from the lows of March 2026. The price has been consolidating within this wedge pattern and is looking for the next move.
Weekly Chart Shows the Risk of a Deeper Pullback
However, the copper price remains elevated on the weekly chart, as seen below. The chart shows that the price remains in the expensive zone, as it remains above $6.00. If the price continues to trade higher without correcting toward $5.00, it will likely increase the risk of a deeper correction later in the year. Therefore, the price correction now will likely strengthen the next move in the copper market.
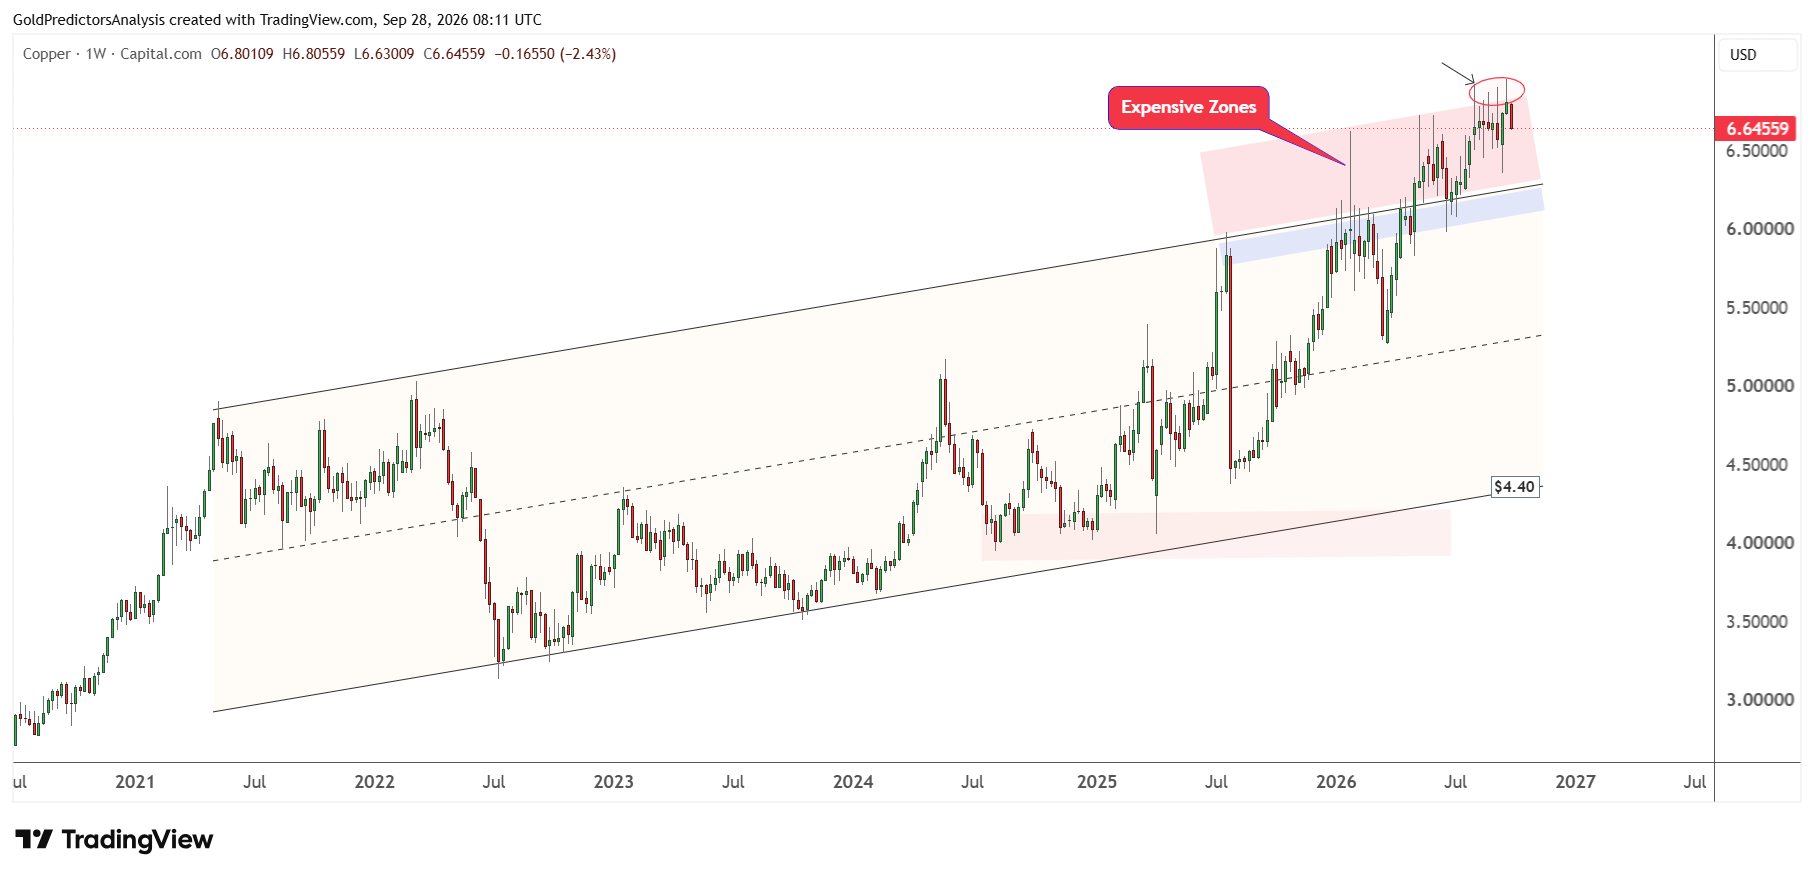
The candles with long shadows on the weekly chart in August and September suggest that the market is poised to start a correction in the short term. Therefore, a break below $6.00 will increase the possibility of further downside toward $5.00. As long as copper prices remain above $4.40, they will likely remain in a strong bullish trend. This support level is defined by the ascending channel on the weekly chart.
What to Watch Next in Copper
The factory report for September in China arrives on Wednesday just before the National Day holiday on October 1-7. The market watches new orders for signs that manufacturers still need copper at current prices. Escondida supervisors are also voting on contract offer through September 30.
The US data could move copper through the dollar. Job openings are due Tuesday, followed by August PCE inflation on Wednesday and the September jobs report on Friday. The strong data could push Treasury yields and the US dollar higher and make the recovery in copper harder. But the softer readings could ease that pressure.
The key level to watch for copper is $6.60. If copper holds above this level, prices may rally back to test $6.95. But a close below $6.50 would increase the risk of a strong drop to $6.20. In my view, the copper trend still remains strong in the long term, but the copper demand may continue to decline in the short term to find new buyers.
Read more: 5% Yields Weigh on Metals