Quant (QNT) has emerged as one of the crypto market’s strongest performers, surging more than 430% in just four days and dramatically outperforming Bitcoin, Ethereum, and the broader market.
Let’s examine the reasons Quant is rallying lately and whether it can hold its gains in the coming days.

Why is QNT Price Up 430%?
QNT’s price soared after The Clearing House selected Quant to support its On-Chain Money Initiative, a new network designed to clear and settle tokenized bank deposits.
Quant will provide the interoperability, orchestration, and transaction-management infrastructure connecting the initiative with existing US payment rails, including RTP and CHIPS, according to the official Sept. 24 press release.
The network is expected to become available to participating financial institutions in the first half of 2027.
The announcement gives Quant significant institutional validation because The Clearing House operates US payment networks that clear and settle more than $2 trillion each day.
$QNT has been chosen by as the official technology provider for The Clearing House’s new tokenized payments network.
The Clearing House powers MORE THAN HALF of all ACH and wire transfers in the United States.
$2 trillion per day.
Yes, trillion, with a T.
Keep sleeping. pic.twitter.com/pSjL1S234W
— Greg Lunt (@GregLuntX) September 24, 2026
QNT has benefited from similar institutional narratives before.
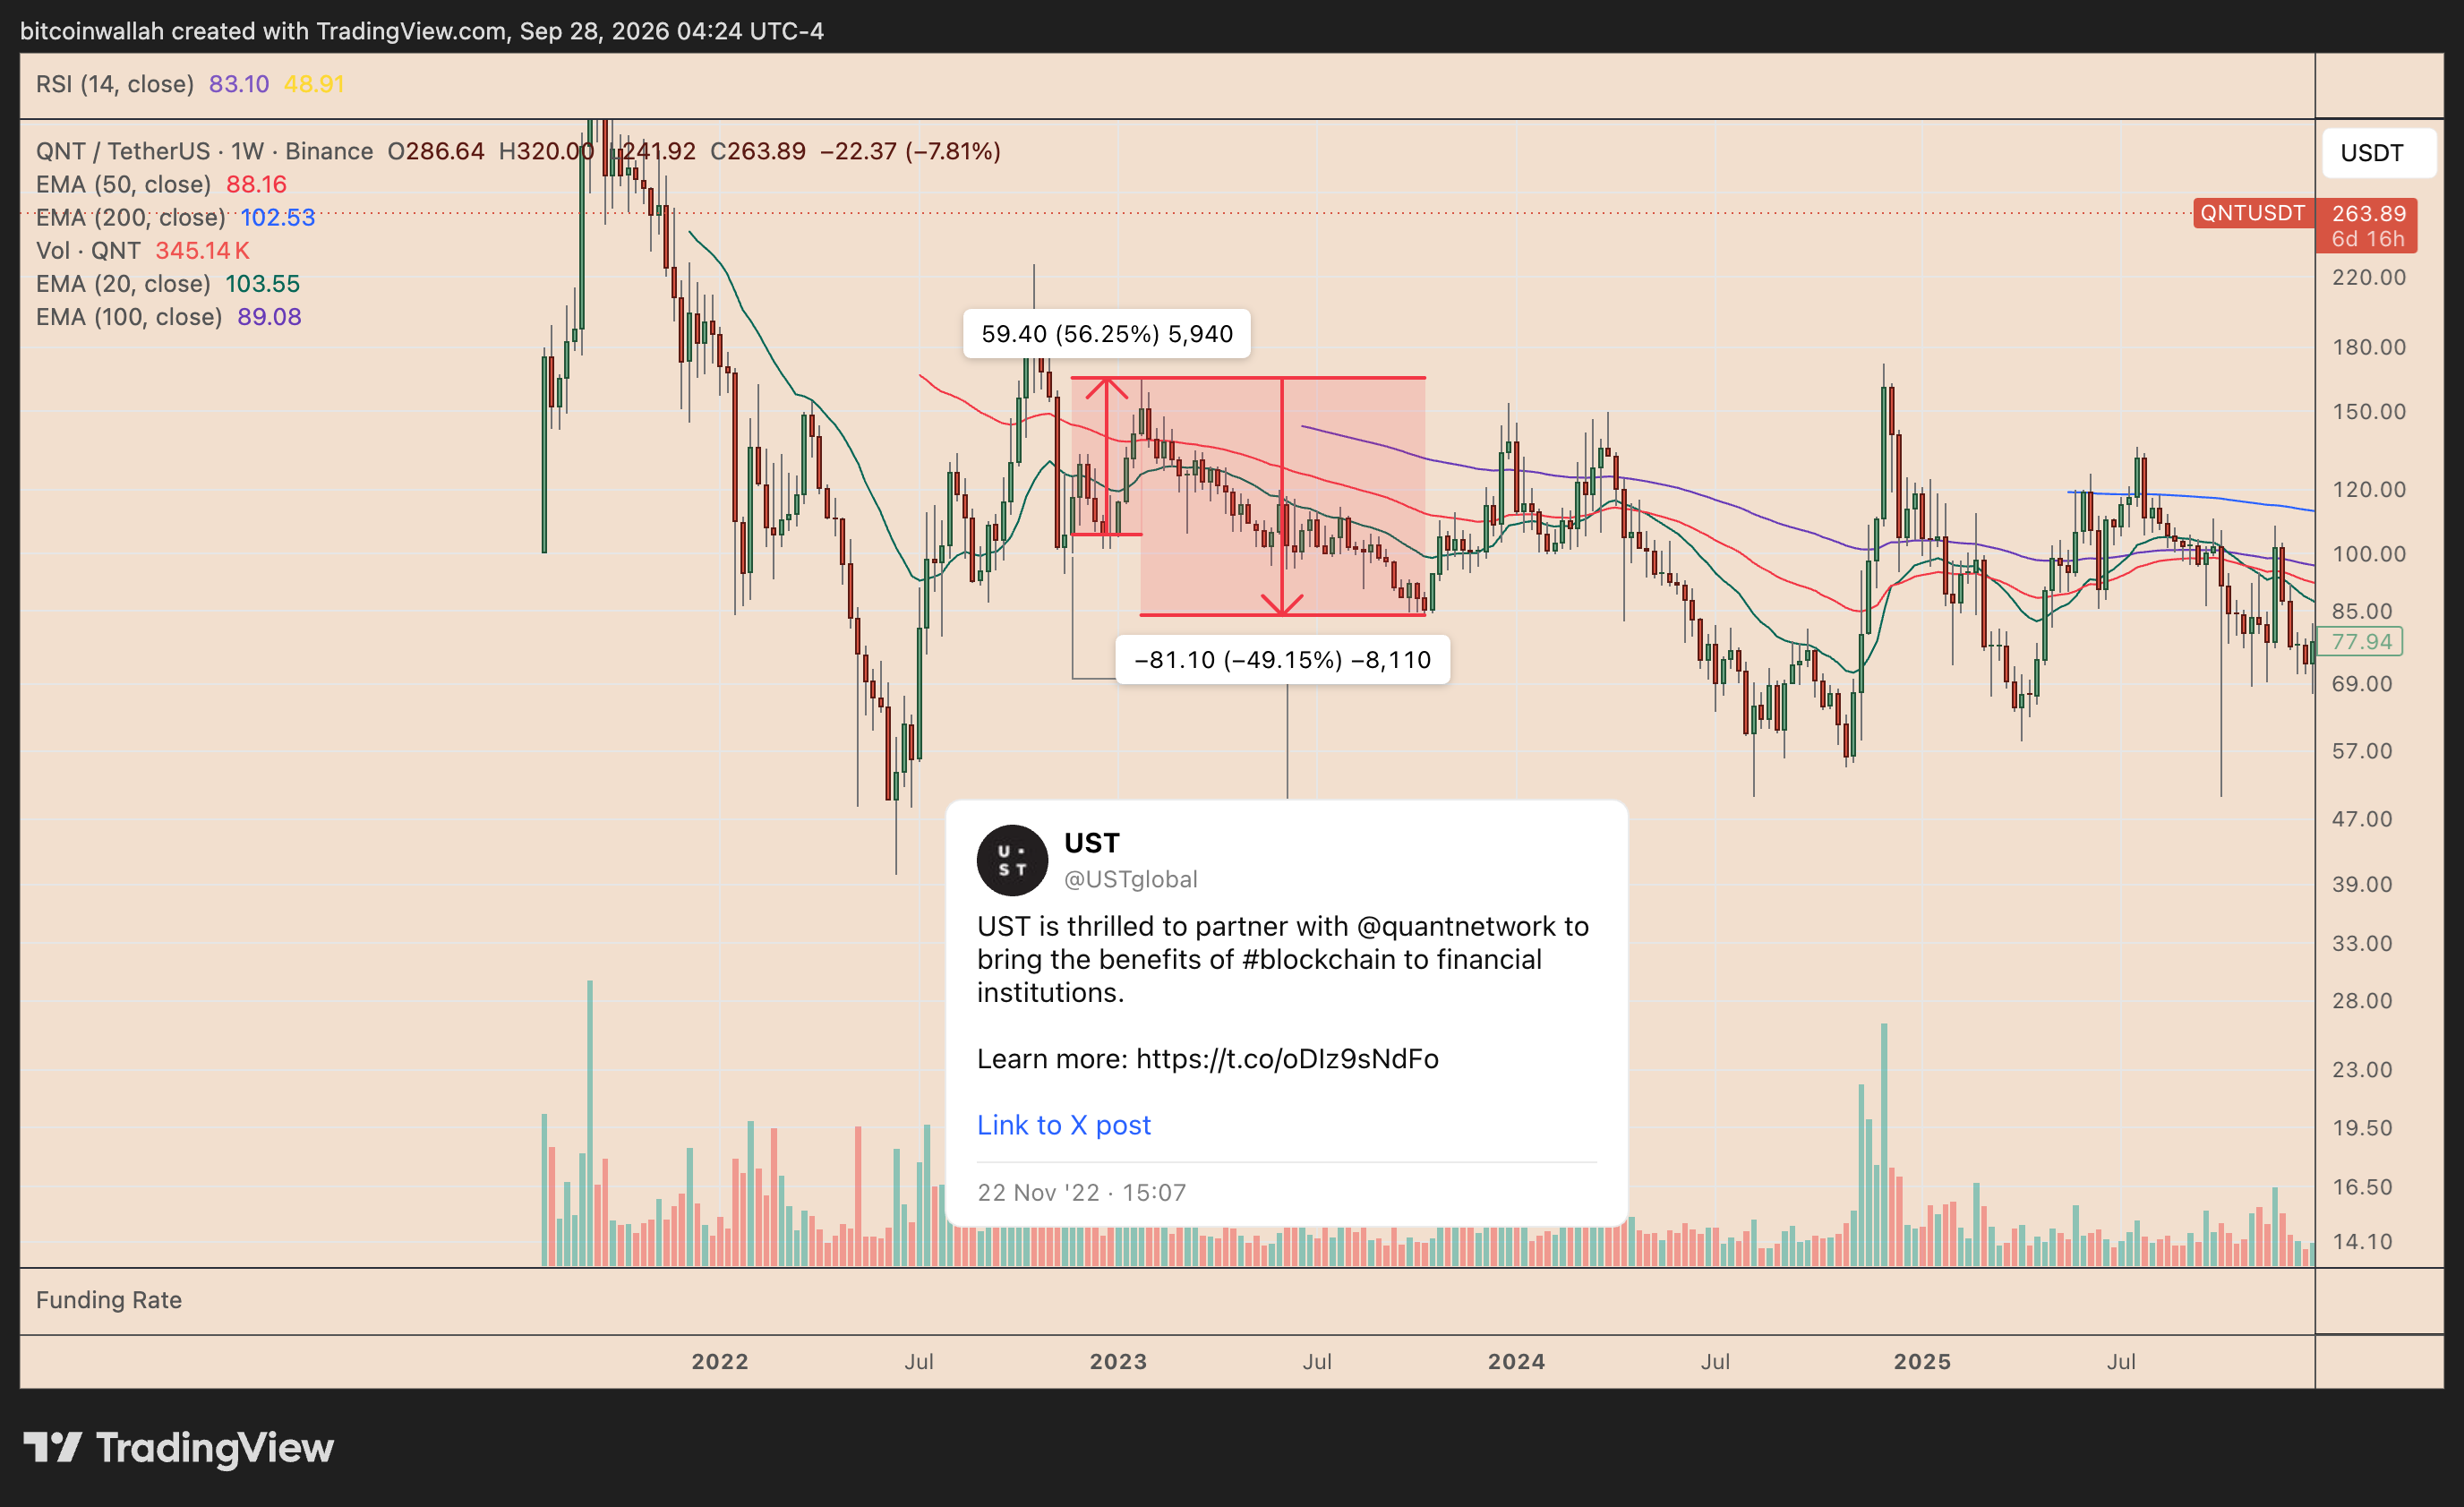
The gains did not last, however. QNT later fell from around $165 to roughly $84, a decline of about 49%, effectively giving back the entire partnership-driven advance.
But the rally did not hold. QNT subsequently fell back toward $104 by Dec. 22, erasing almost all of the post-announcement advance, before ending the year near $108.
It is a useful reminder that institutional announcements can produce strong speculative rallies in QNT as traders price in future adoption. But when an announcement does not create immediate, measurable demand for the token itself, those gains can also unwind once the initial excitement fades.
That’s a major reason why I am skeptical about QNT’s upside prospects from current rates.
QNT Technical Outlook: Fibonacci Setup Warns of 30% Pullback
QNT is already correcting sharply from its local high near $375, suggesting its parabolic rally may be entering a broader profit-taking phase.
The Quant token has since fallen toward $260, putting it roughly 31% below the recent peak. Its latest weekly candle was also down around 9% at the time of the chart.
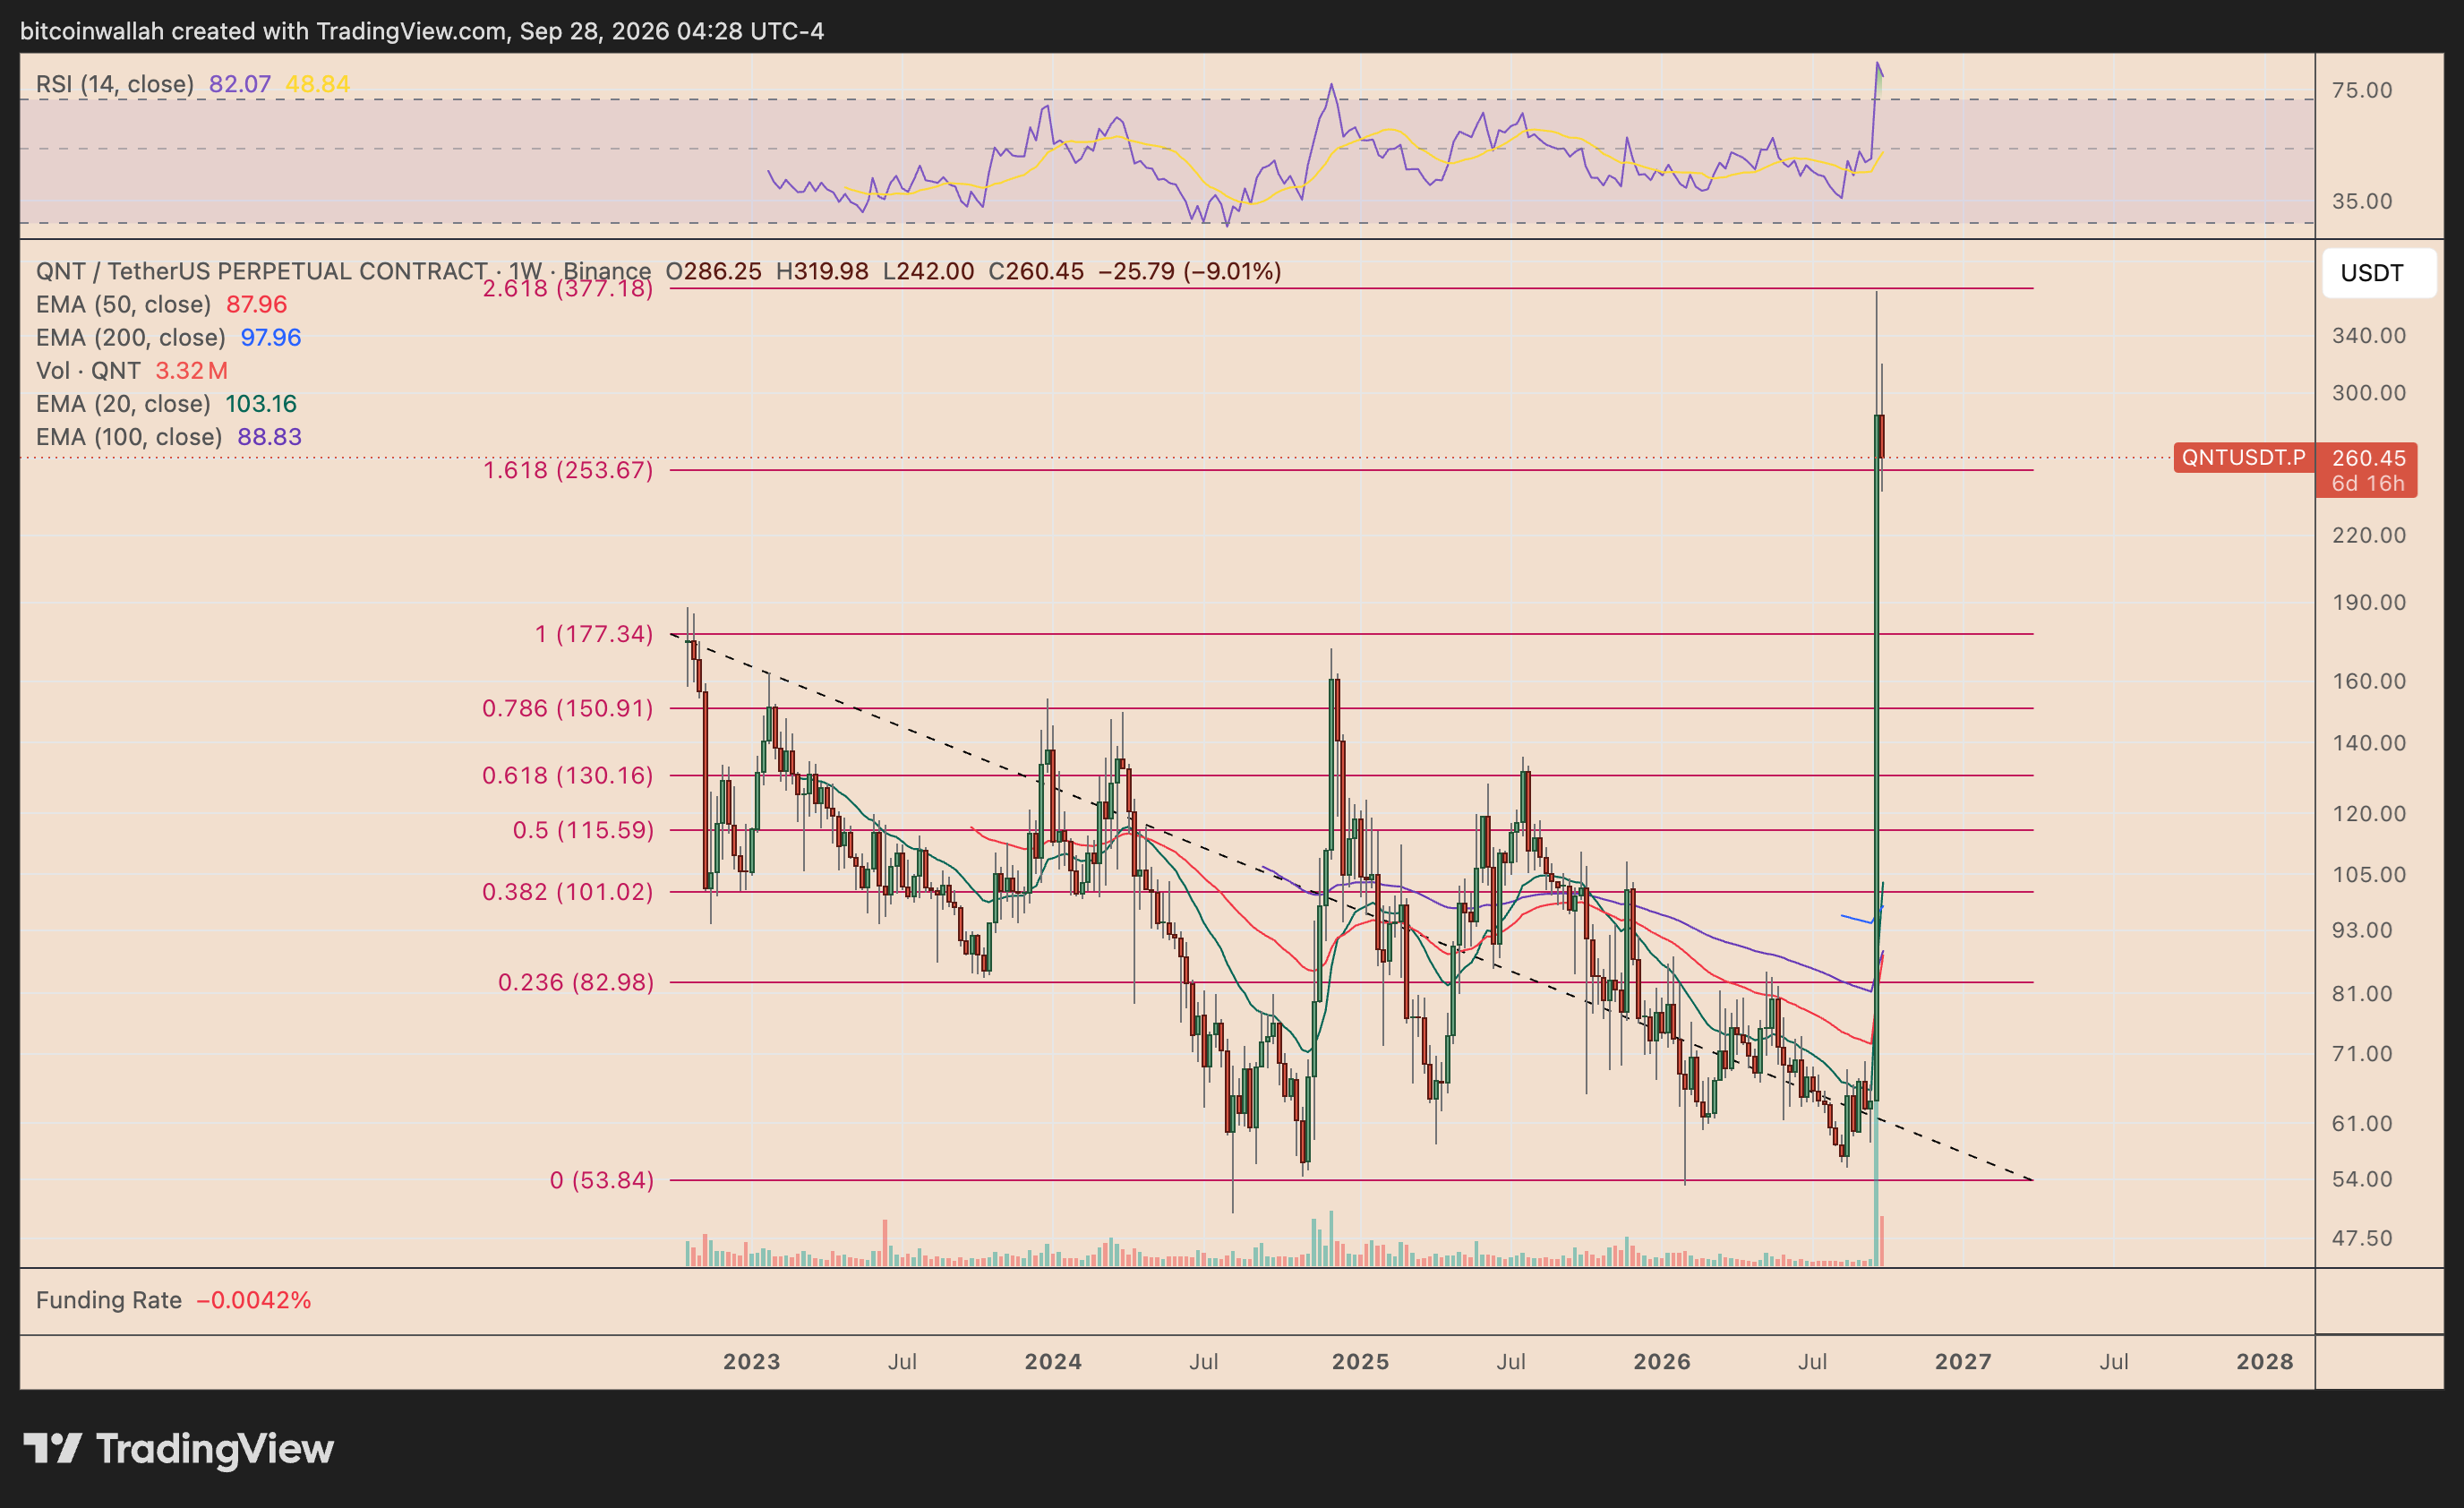
The pullback brings the 1.618 Fibonacci extension near $254 into focus as the next major support. Holding this level could allow QNT to stabilize after its 430% four-day rally.
However, a decisive breakdown below $254 could expose the 1.0 Fib level near $177. That would imply another roughly 30% decline from the 1.618 support and a drawdown of about 53% from the $375 local high.
Meanwhile, QNT’s weekly relative strength index (RSI) remains above 82, signaling extremely overbought conditions. Combined with the ongoing 30%-plus correction, that raises the risk that the rally is undergoing a deeper reset rather than a routine pullback.
Conversely, $254 holds as support and QNT rebounds. In that case, a rebound from the $254-support could put the 2.618 Fib level near $377 back in focus. A clean move above that resistance would invalidate the immediate bearish retracement thesis and reopen the door to price discovery.