
Dollar and Yields Keep Gold Buyers on the Defensive
Spot Gold (XAUUSD) is bouncing shortly after the New York opening Tuesday, but none of the levels lost in Monday’s break are back in buyers’ hands. The dollar is firm and Treasury yields are sitting near their highs, with traders still pricing a strong chance of another Federal Reserve rate hike in October.
This looks like buyers testing the water after a hard drop. Gold is still trading well under the broken 61.8% retracement level. There’s a lot of damaged support stacked above it.
At 13:55 GMT, Spot Gold is trading at $4,161.59, up $46.61 or +1.13%. It has traded from $4,113.49 to $4,164.50.

Yields and the Dollar Haven’t Given Gold Any Room
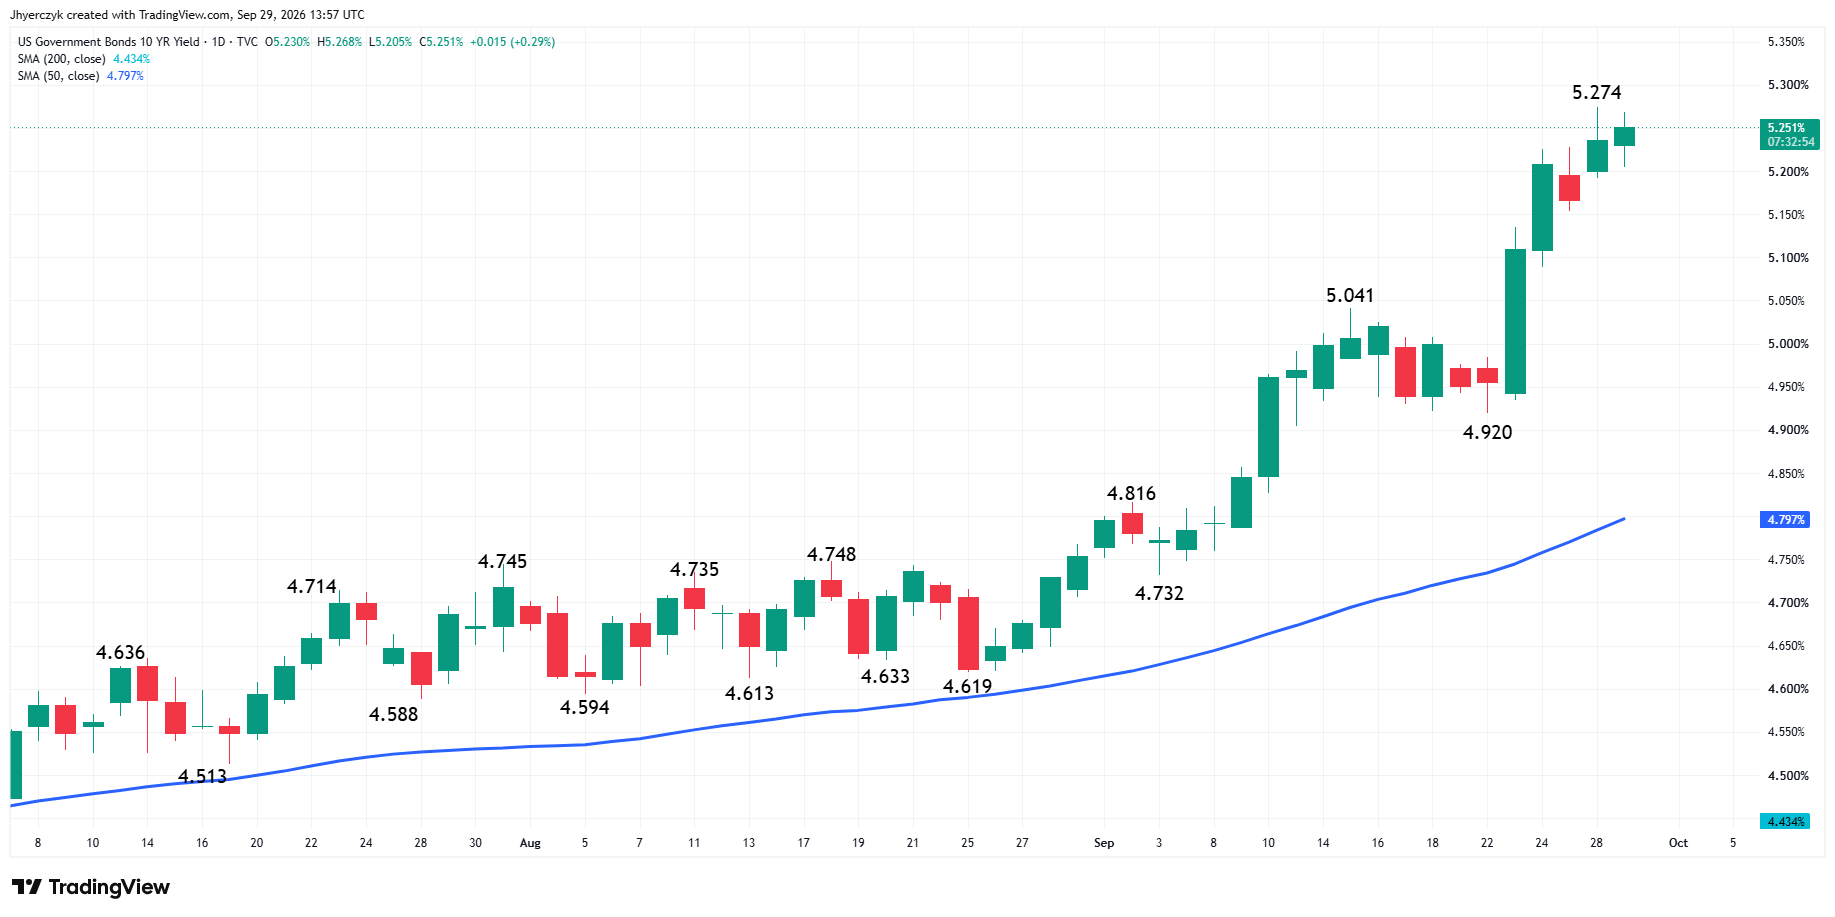
Bond traders aren’t giving gold anything Tuesday. The 10-Year U.S. Treasury yield touched 5.27% earlier in the session and is holding near 5.25%. The 2-Year is near 4.94%. Both are sitting close to their recent highs, and gold is trying to bounce straight into that.
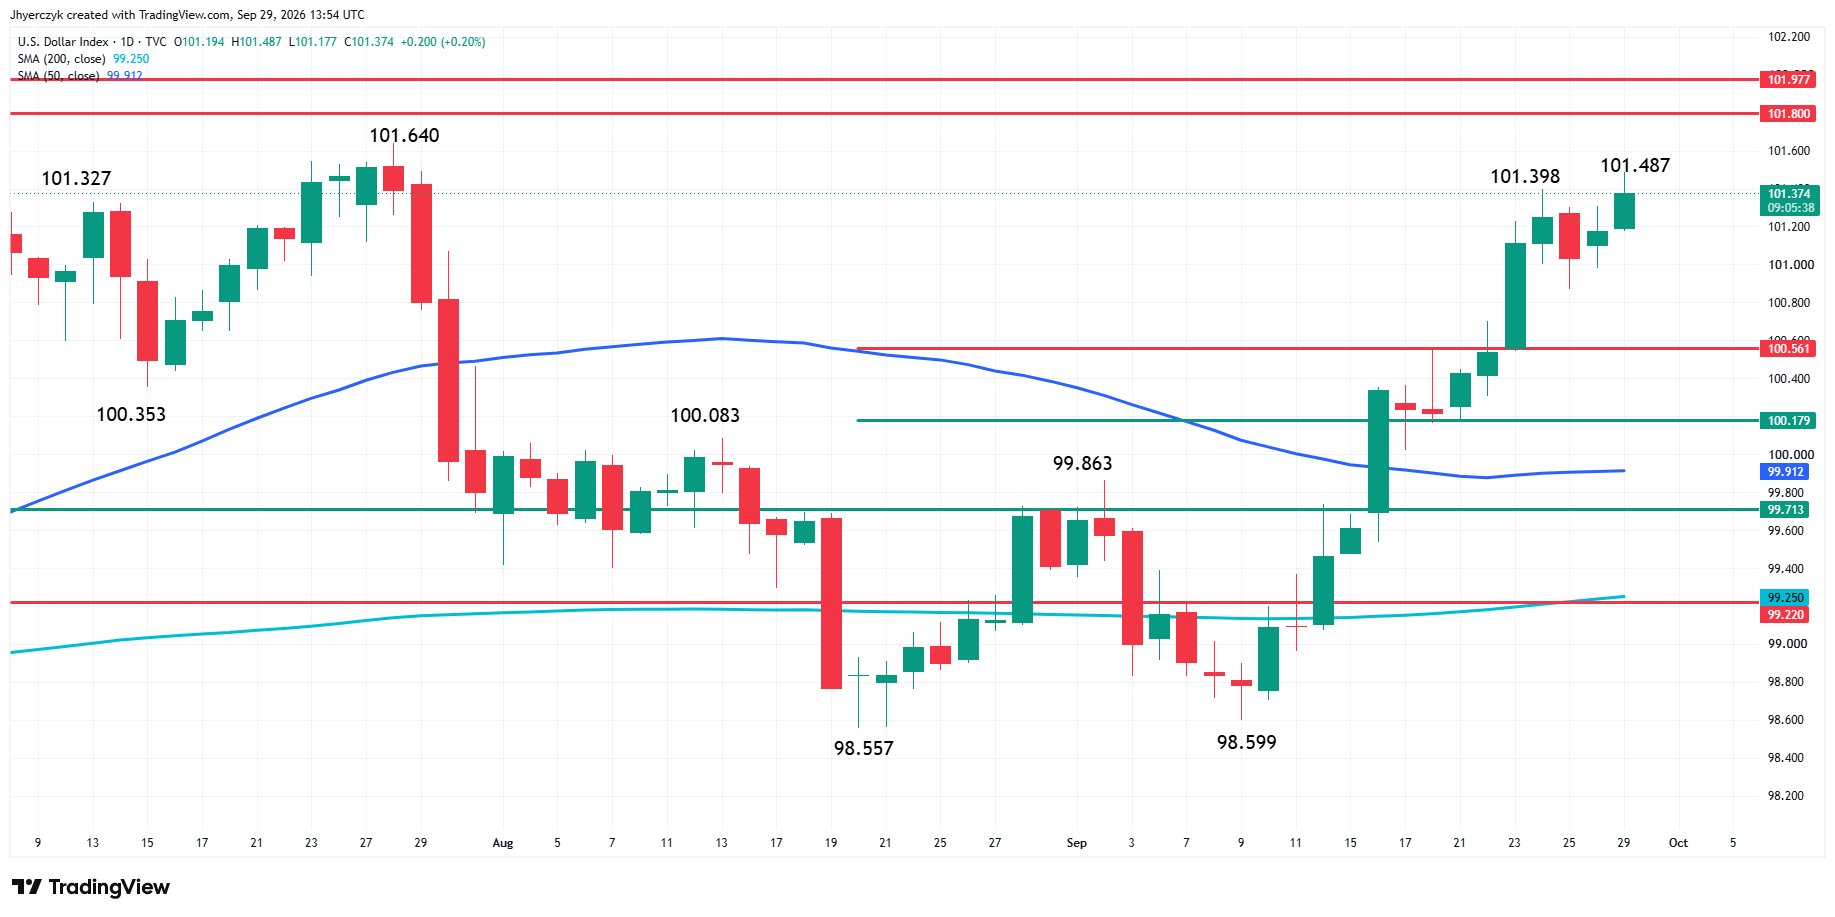
The Dollar Index tested 101.49 earlier Tuesday and is trading near 101.37. It’s holding most of that move. Dollar buyers are working off the same rate outlook that is weighing on gold.
The CME FedWatch reading for October shows a 68.1% probability of a quarter-point hike. That’s down from the 70% area on Monday. It’s still a rate-hike market. Until those odds cool, gold isn’t going to get more than a short-covering bounce.
Higher Oil Is Working Against Gold Through Inflation
The Middle East conflict isn’t helping gold much. Traders are reading higher energy prices as an inflation problem. That sends them straight back to the Fed.
Gold Price Forecast
Every new Gold analysis as it publishes, today's technical signal and key levels, live price — on one page.
See all Gold forecastsAs long as yields keep climbing, the inflation side of the story has the upper hand over anything geopolitical.
Softer JOLTS Didn’t Settle the October Hike Question
Job openings slipped to 7.079 million in August from a revised 7.335 million in July, according to the Job Openings and Labor Turnover Survey (JOLTS). Hires came in at 5.192 million. Quits, layoffs and discharges barely changed.
The Bureau of Labor Statistics called openings little changed. Traders got a softer labor number out of it. A drop of 256,000 openings from July still wasn’t enough to take the rate-hike trade off the table.
Wednesday’s Personal Consumption Expenditures (PCE) reports and Friday’s Non-Farm Payrolls report carry more weight for gold. Soft readings from either one could bring profit-taking into the dollar and Treasury yields. That’s the opening gold buyers are waiting for.
Tuesday’s Bounce Looks Like Profit-Taking by Monday’s Sellers
Tuesday’s gain looks like Monday’s sellers booking profits after the washout. I don’t see aggressive new buying in it. Tuesday’s high is only about $54 above Monday’s low. Gold hasn’t cleared any resistance, and shorts haven’t been forced to cover.
That leaves the market exposed to another leg down if PCE or payrolls keeps the rate-hike trade intact. Buyers have to take offers above broken support before anyone can call this more than a pause.
Daily Spot Gold (XAUUSD) Technical Analysis
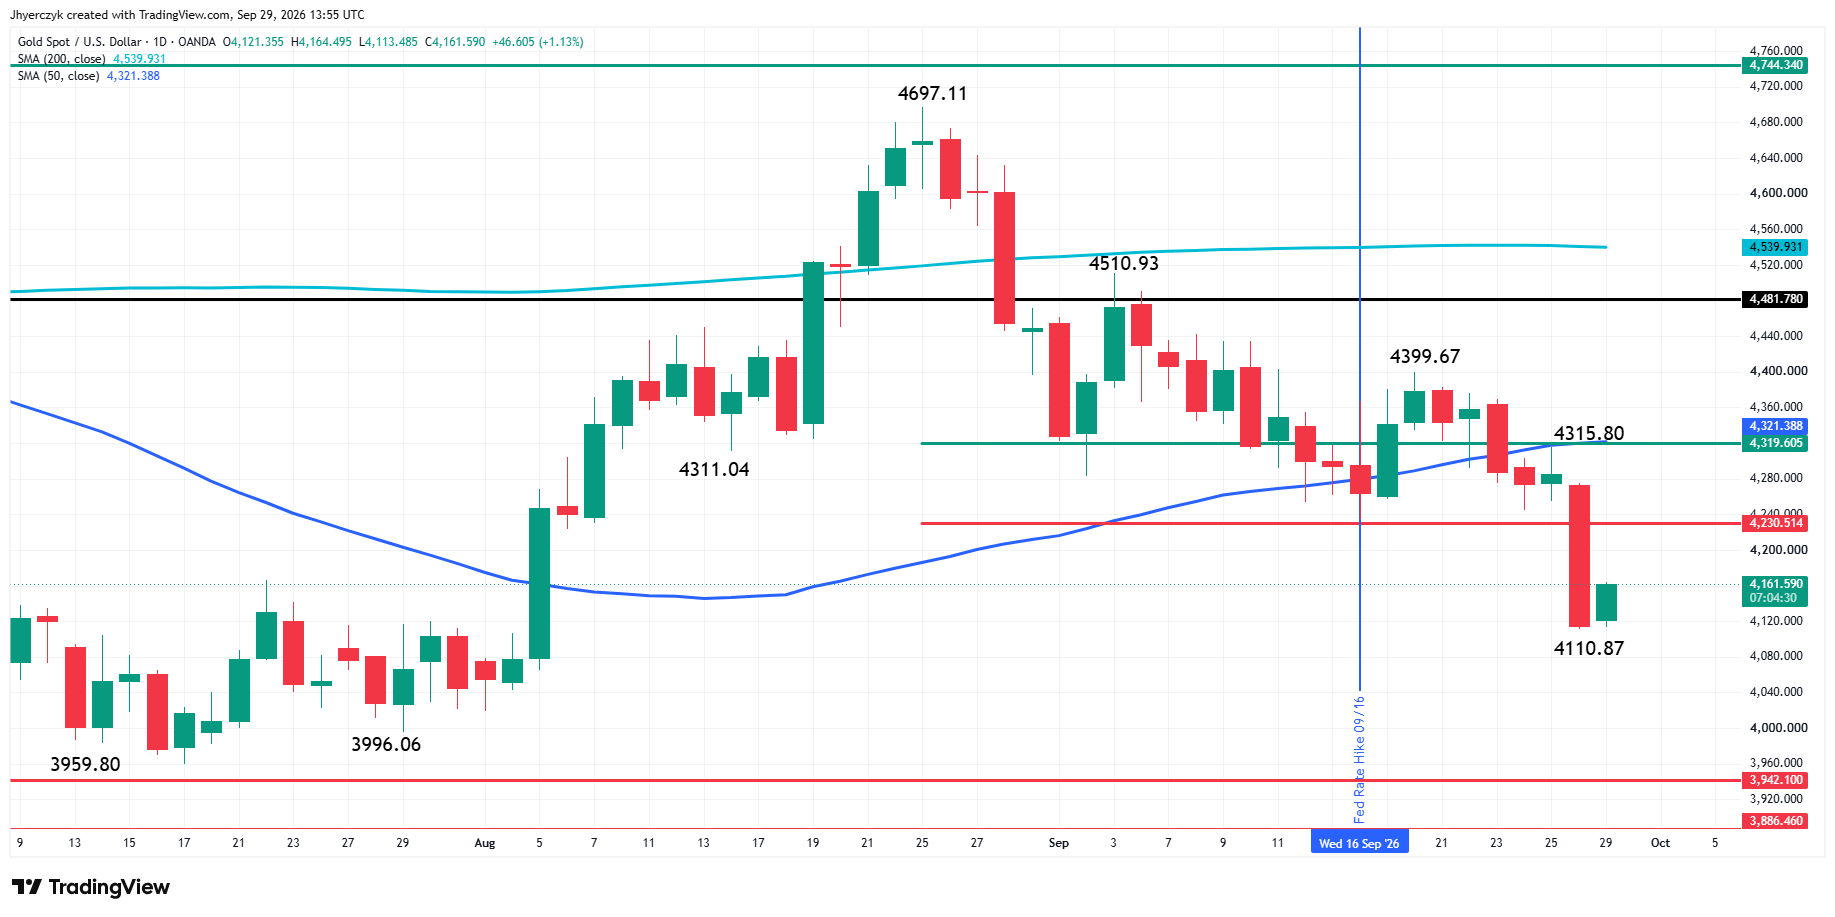
Spot Gold’s main trend is down according to the daily swing chart. A trade through the lower top at $4,399.67 will change the main trend to up. Monday’s low at $4,110.87 is the immediate downside trigger. A trade through that price will signal a resumption of the downtrend.
The long-term retracement zone is $4,319.61 to $4,230.51. Gold broke through the lower boundary Monday, turning the zone into resistance. The 50-day moving average at $4,321.39 is also nearby.
The 200-day moving average at $4,539.93 is providing long-term resistance and trend direction. Gold is trading below both moving averages.
The next major support is the August swing bottom at $3,996.06, followed by the main bottom at $3,942.10. Tuesday’s high at $4,164.50 is only a high at this point. It does not establish a new top or change the swing-chart structure.
What to Watch
Wednesday’s PCE reports are the first real chance for the October hike odds to come down, with Friday’s payrolls right behind them. JOLTS gave buyers a softer number. It takes those two reports to change what the rate market is pricing.
The dollar and yields are the tell in between. Gold buyers need both backing off their highs before any recovery can gain traction.
Sellers are in control while gold stays under the broken 61.8% level at $4,230.51. That’s the first decision point for buyers. A recovery through it would show they’re taking offers. They’d still have to get through the $4,319.61 to $4,321.39 area, where the top of the retracement zone meets the 50-day moving average. That’s a difficult area for buyers to recover. On the downside, a break of Monday’s $4,110.87 low puts the August swing bottom at $3,996.06 back in play.
If you’d like to know more about how to trade gold, please visit our educational area.