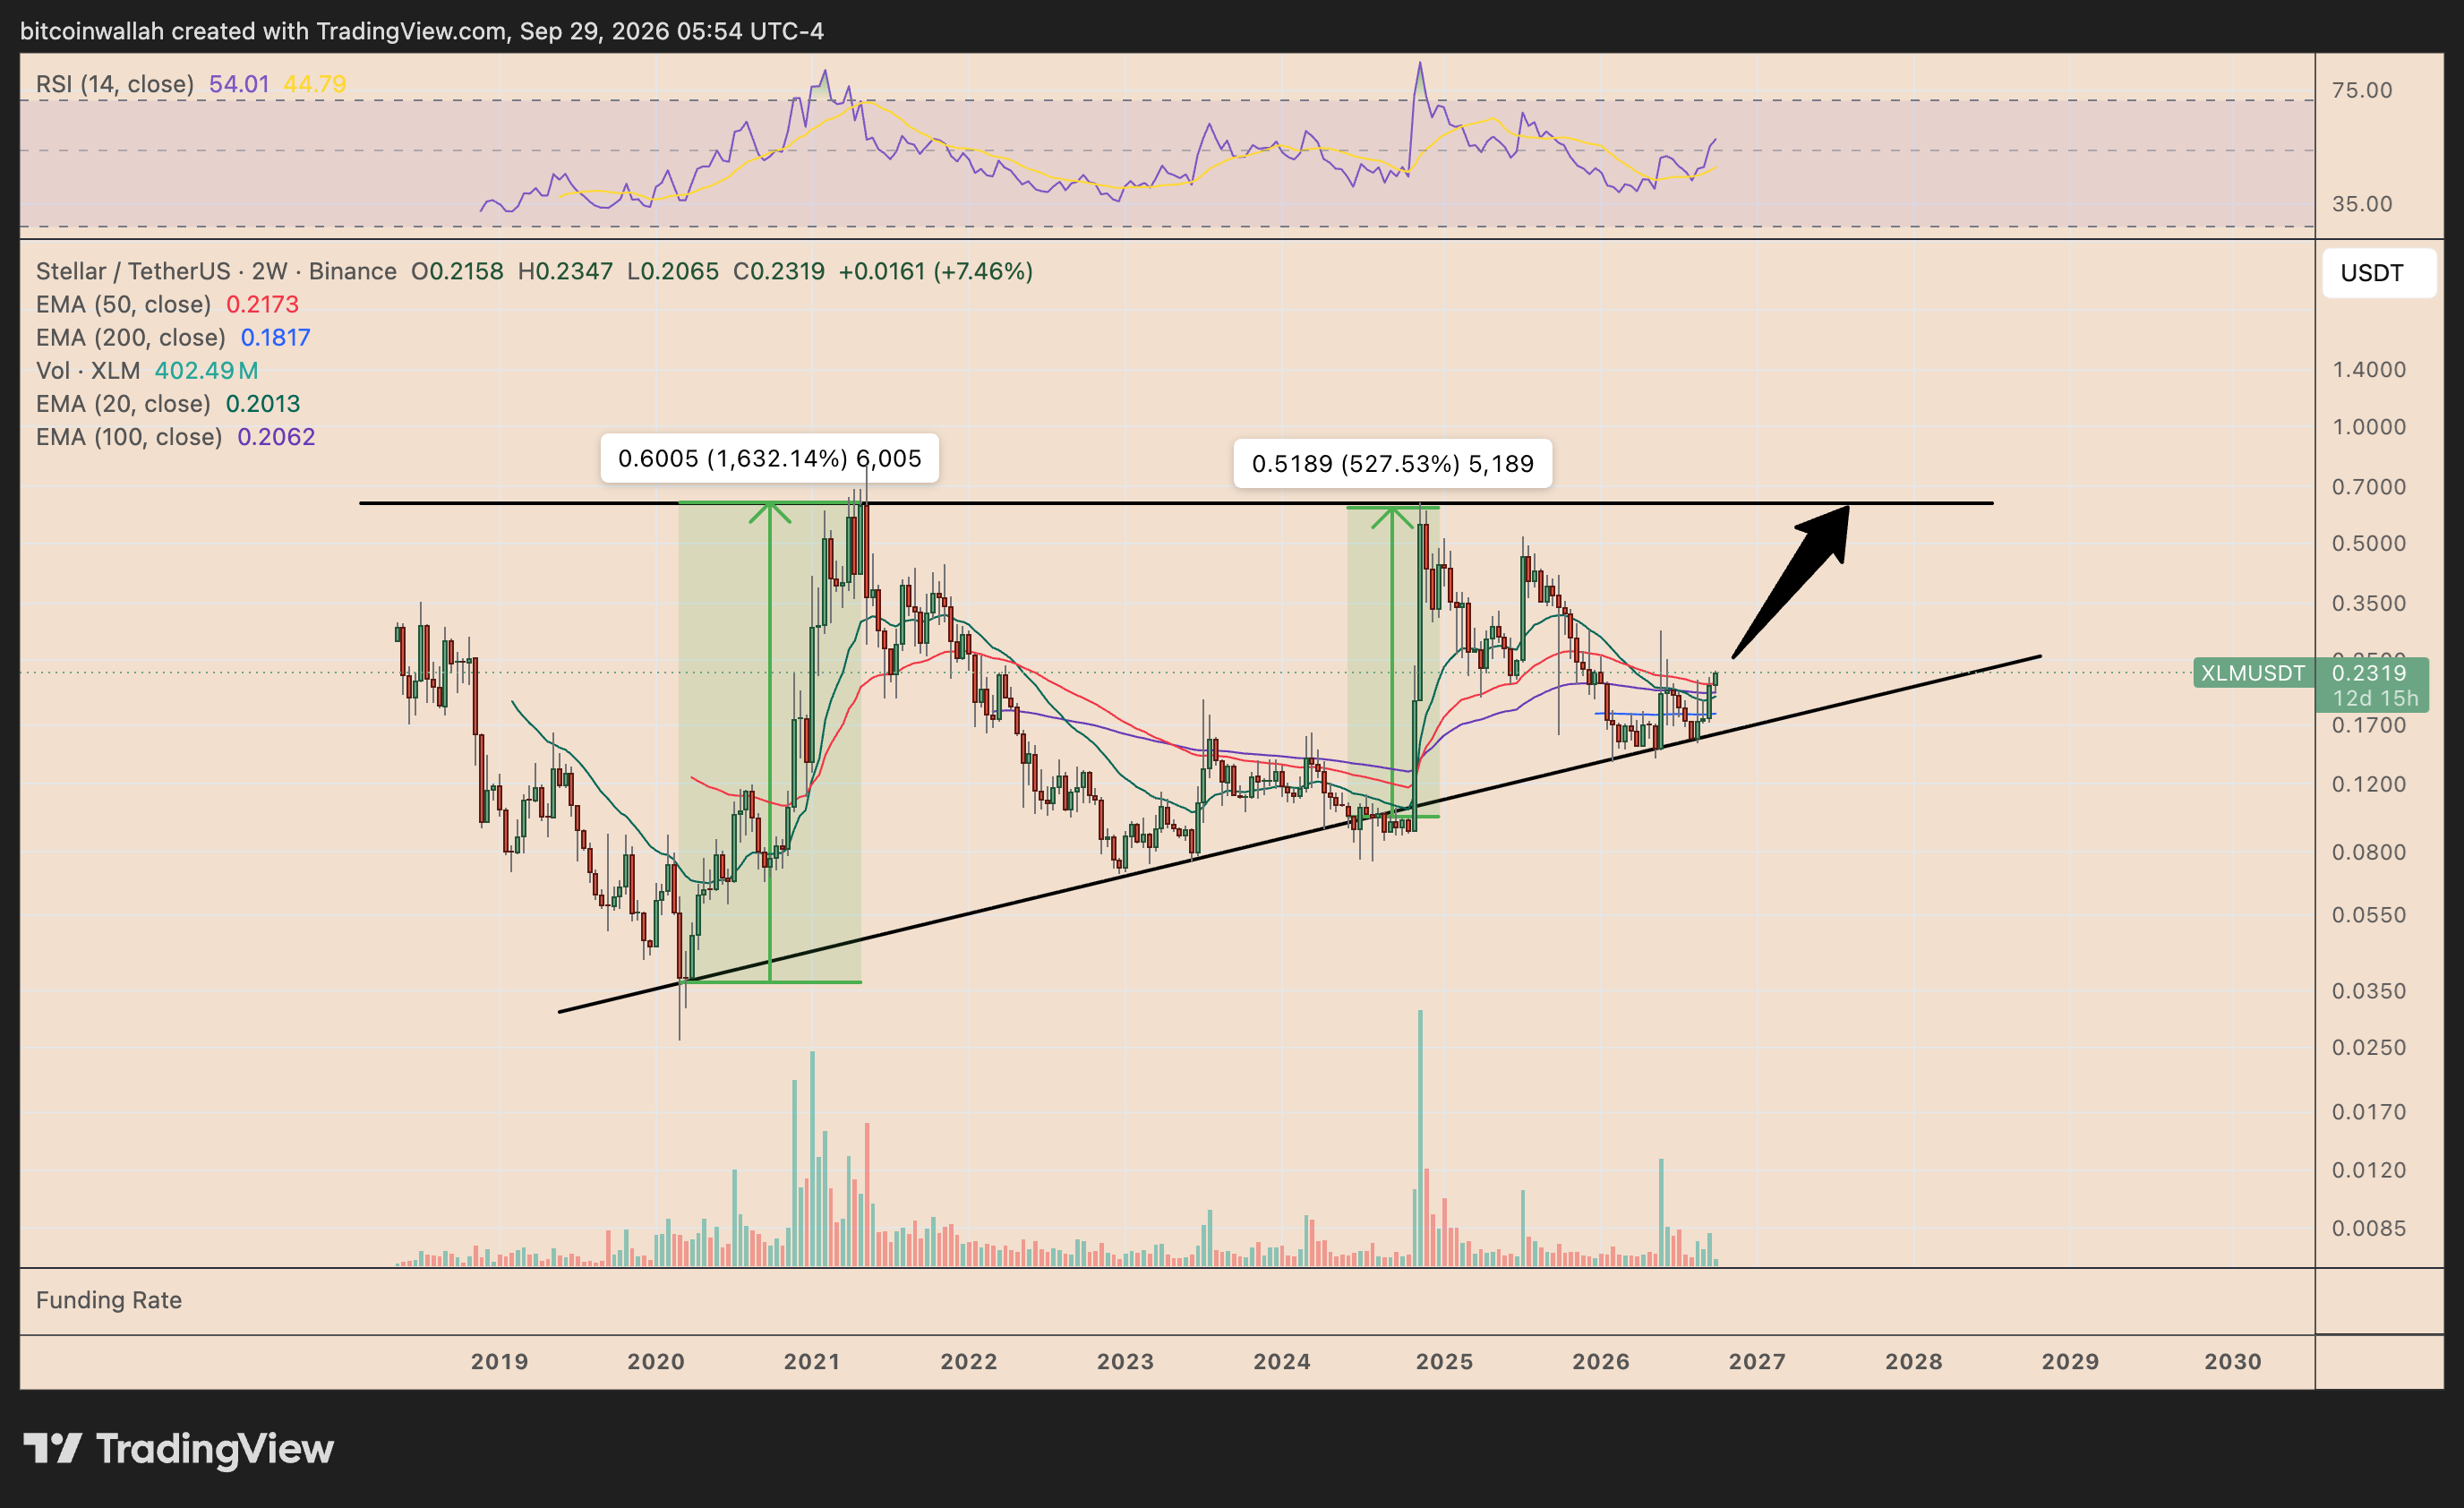
Stellar’s XLM is once again testing a long-term accumulation structure that preceded two of its biggest rallies, including gains of roughly 1,630% in 2020-2021 and 530% in late 2024.

XLM’s Previous Rallies Followed the Same Setup
XLM was trading near $0.232 on Sept. 29, holding above a long-term ascending support line that has underpinned the token’s broader recovery structure since 2020.
The same support region preceded XLM’s move from roughly $0.035 to above $0.60 during the 2020-2021 bull cycle.
That rally coincided with improving Stellar network activity, the rollout of USDC on Stellar, and Stellar’s agreement with Ukraine to help develop virtual-asset and CBDC infrastructure.
XLM also benefited from capital rotation out of XRP after the US Securities and Exchange Commission sued Ripple in December 2020. The two assets have historically traded under similar payments and cross-border settlement narratives.
The rally later accelerated during the broader 2021 altcoin boom, eventually pushing XLM toward its long-term resistance zone near $0.60-$0.70.
A similar setup emerged in late 2024.
XLM again rebounded from a prolonged accumulation phase near $0.09 before surging more than 500% toward $0.60. The rally followed Donald Trump’s US election victory, improving expectations for crypto regulation, and a sharp XRP rally that spilled into related payment-focused cryptocurrencies.
In both cases, XLM’s strongest gains occurred when long-term accumulation coincided with improving fundamentals and broad speculative liquidity.
Stellar Fundamentals Strengthen Ahead of Next Breakout Attempt
The current setup is notable because Stellar’s network fundamentals have continued improving.
In Q2 2026, Stellar reported more than $3 billion in real-world assets, while quarterly stablecoin transfer volume reached approximately $11.4 billion.
Recent developments also include USDT0 launching on Stellar, cross-border stablecoin pilots involving major financial institutions, including US Bank and BVNK.
Technically, XLM has also reclaimed several major two-week moving averages.
Its 20-period EMA sits near $0.201, while the 50-period, 100-period and 200-period EMAs are positioned around $0.217, $0.206 and $0.182, respectively.
Meanwhile, the two-week relative strength index has recovered to around 54, suggesting improving momentum without entering overbought territory.
A sustained breakout above the $0.30-$0.35 region, particularly alongside rising trading volume, could strengthen the comparison with previous XLM expansion cycles.
In that scenario, the $0.60-$0.70 area would emerge as the primary long-term resistance zone.