


USOIL, UKOil & Natural Gas Outlook: Iran Sanctions Standoff Revives Supply Risk as LNG Market Stays Tight
Oil prices strengthened on Wednesday as the risk of a disruption to Iranian oil supplies returned, after President Trump denied reports that said the U.S. is preparing to remove sanctions on Iran.
While an agreement between the U.S. and Iran is being mediated through Qatar, there has not been sufficient progress to allay the supply risk on either WTI or Brent. Iran has taken a more conciliatory stance to the U.S. and recently proposed at the U.N. to reopen the Strait of Hormuz and stop their attacks on international shipping to give Trump a face-saving opportunity. However, Trump has said that he is not considering any of Iran’s proposals and that he is not offering any sanctions relief.
While the U.S. has requested that countries buy more oil from them, and has authorized energy companies to draw down 40 million barrels from the U.S. Strategic Petroleum Reserve to help offset the loss of Iranian oil, the global supply of crude is beginning to improve. Gulf nations have been using shuttle and ship-to-ship crude transports to mitigate the supply disruptions from the Strait of Hormuz.
There is more of a fundamental case to be bullish for oil and less so for natural gas. Qatar has ramped up its LNG shipments in the last month or so, but exports are still greatly limited and could be disrupted again. Europe has very little protection from another gas disruption. With storage levels in Germany at 57% (for the first time ever in September) and natural gas prices in Europe more than doubling this year, the market is clearly tight. The U.S. is seeing a greater shift to LNG export infrastructure which should benefit Europe and Asia in the long-term. LNG export and midstream projects in the U.S. have more than $20B in annual private equity investment through 2026.
From a fundamental perspective, USOIL and UKOIL should continue to rise. Natural Gas should see an even greater increase over the long-term.

Natural Gas Technical Analysis: NG Holds $3.00 Support as $3.10 Becomes the First Recovery Hurdle
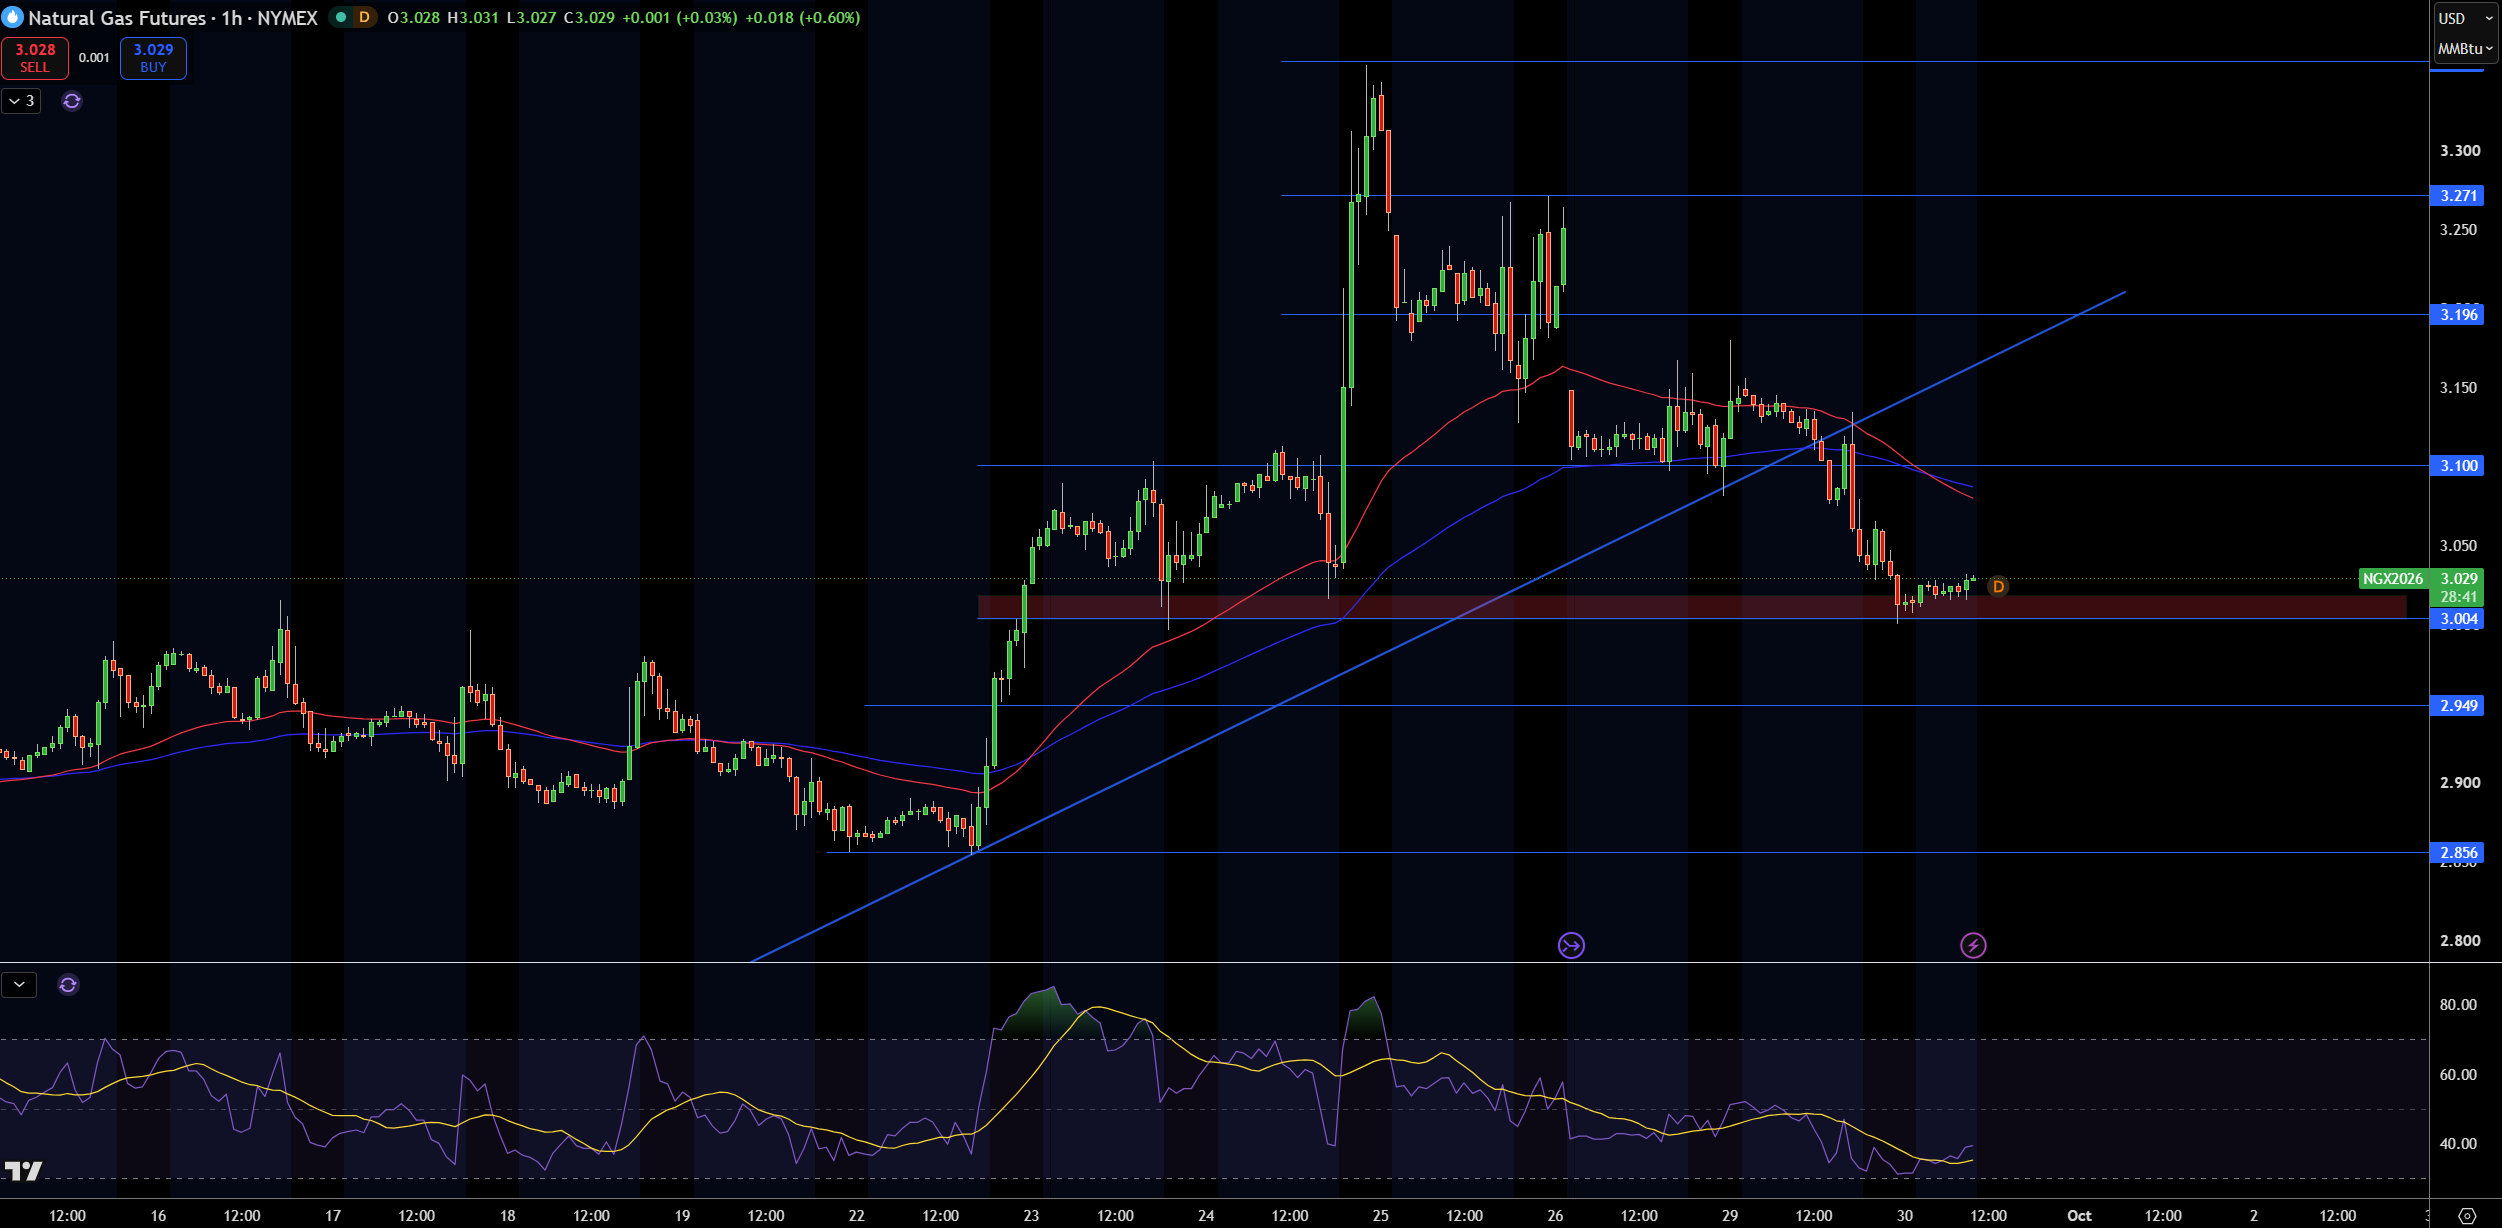
Natural Gas (NG) is currently trading at $3.03 on the 1-hour chart. It recently broke below a rising trendline and both the 50 and 100 hour moving averages, and is now trading below all three. Currently, NG is attempting to find support near the $3.00 level. However, as the rising trendline has recently been broken, the 100 hour moving average has crossed below the 50 hour moving average, and the 50 hour moving average is below the 200 hour moving average, the recent price action shows that the market structure is bearish and further work is needed by buyers to change the overall trend.
Initially, I would expect resistance to be found near the $3.10 level. Above $3.10, expect additional resistance to be found near the $3.20 and $3.27 levels. As mentioned previously, further support is found near the $3.00 level, with additional support expected near the $2.95 and $2.86 levels.
Rising timeframes of lower trading volume have been dominated by the bearish trend, and the RSI has recently been trending lower. Until $3.10 is reclaimed, I expect further bearish price action. I would expect resistance to be found near the $3.20 level and support to be found near the $3.00 level. A move below $3.00 would open further bearish price action near the $2.86 and $2.95 levels.
Natural Gas Price Forecast
Every new Natural Gas analysis as it publishes, today's technical signal and key levels, live price — on one page.
See all Natural Gas forecastsWTI Crude Oil Technical Analysis: USOIL Holds $88.71 as $92.97 Becomes the First Recovery Test
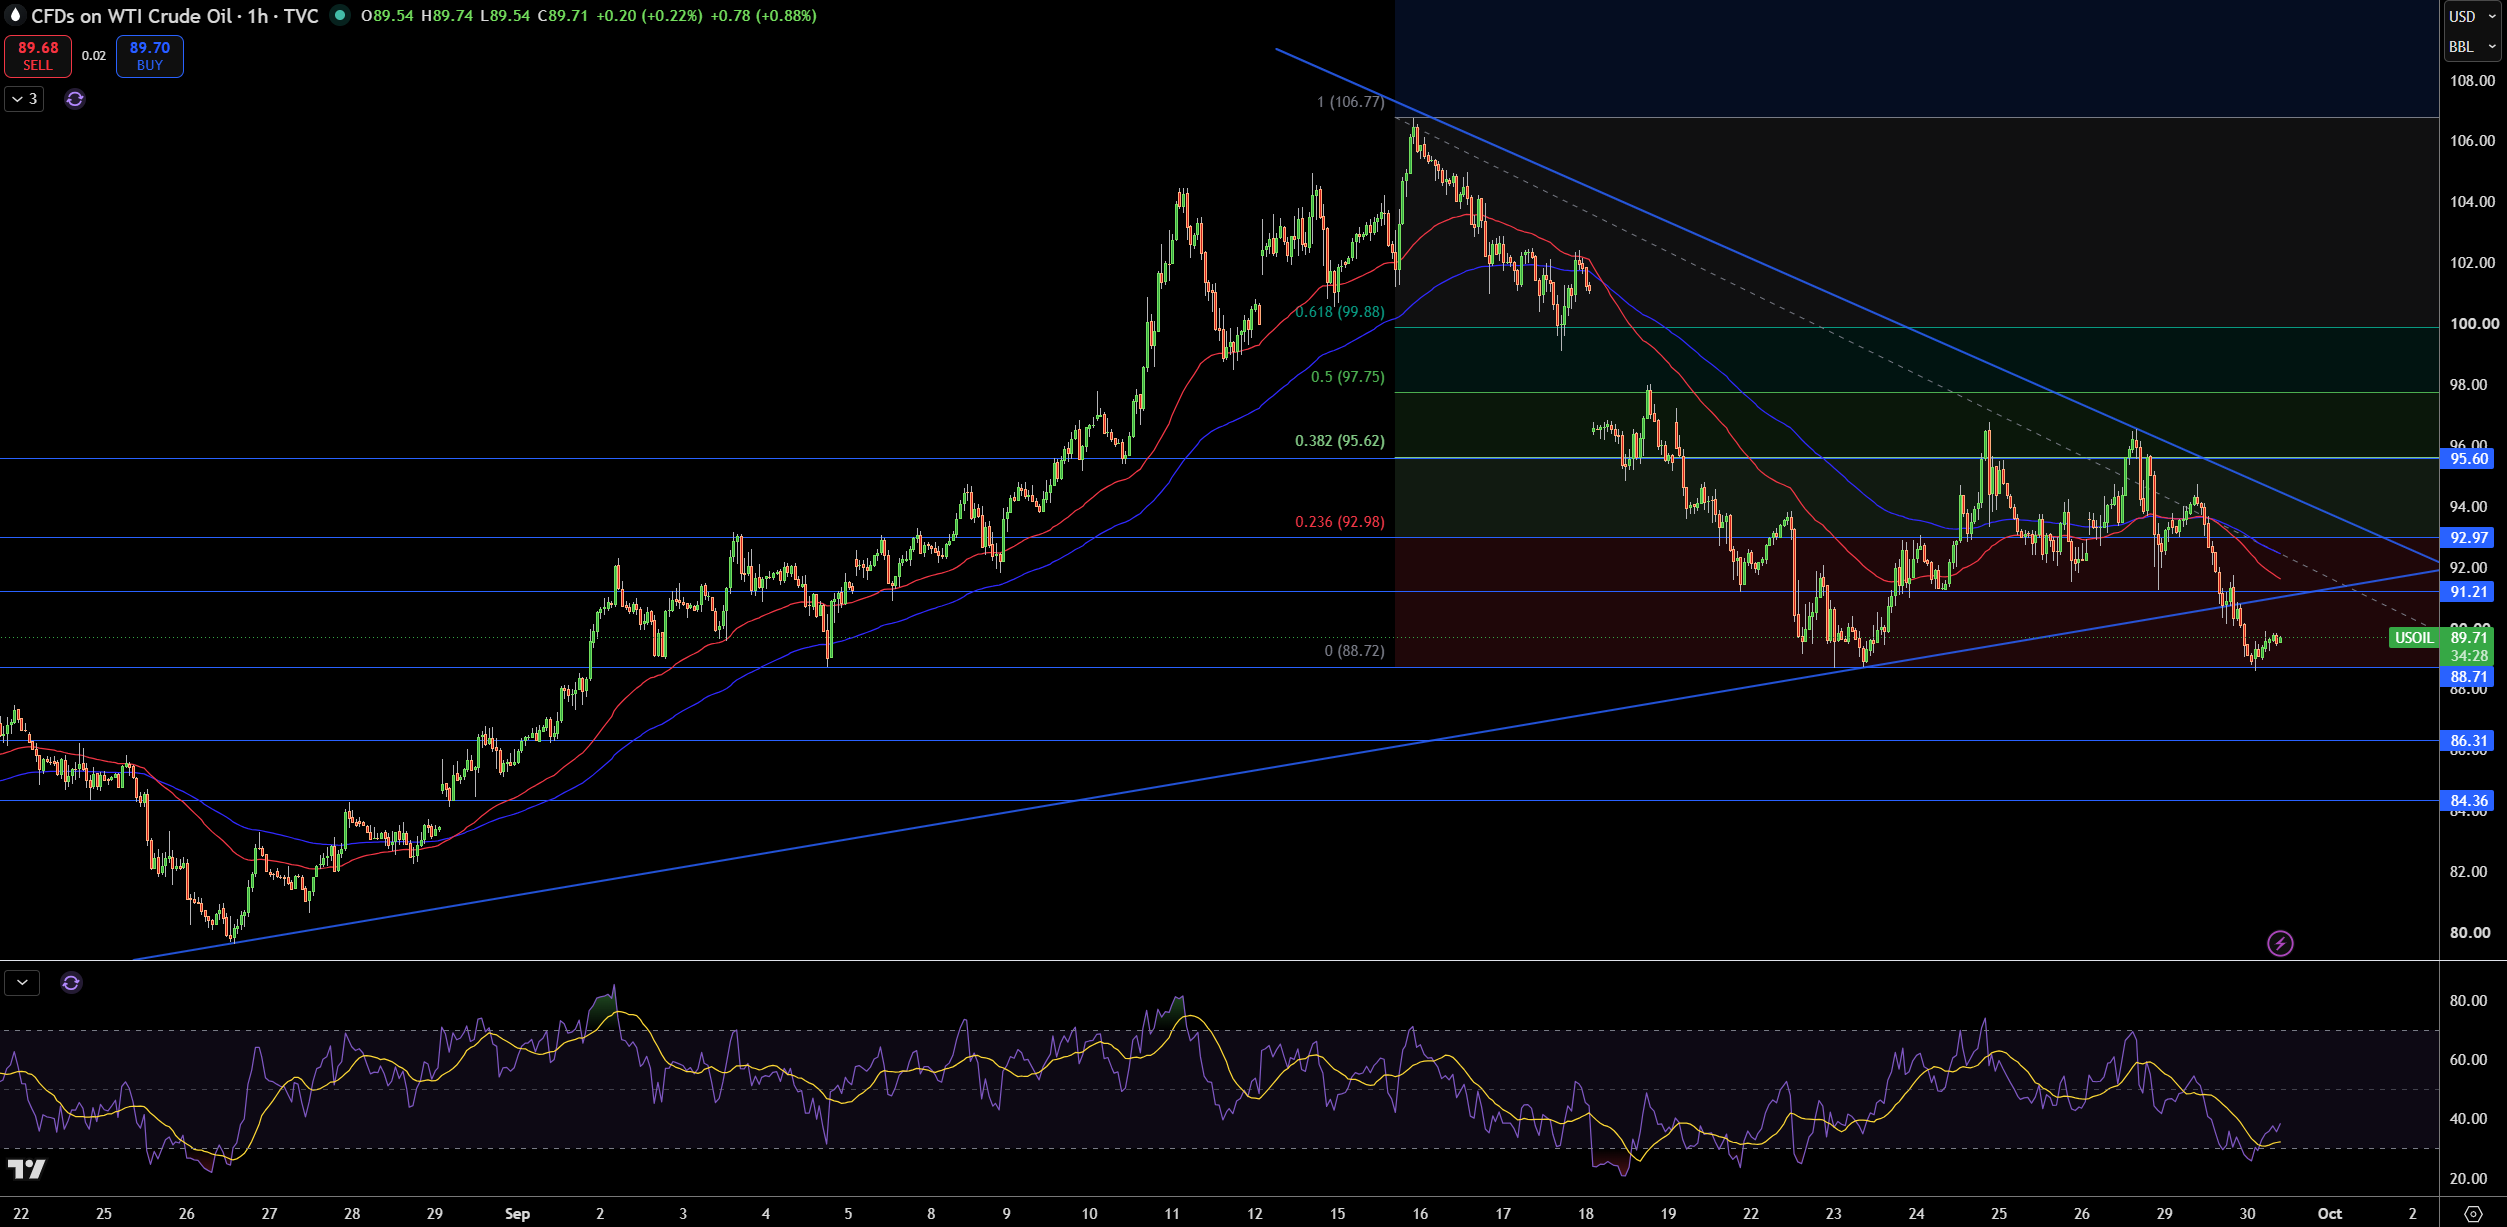
WTI Crude Oil is currently trending at $89.71. Recently, the price had broken down and touched the lower trendline of a descending channel. After briefly trading at the $88.71 support, the price has begun to recover. This recovery will remain bearing a main trend in a channel with a 200 and 100 moving average below it.
Current resistance levels begin at $92.97. Breaking this level will potentially lead to a further upward trend with resistance levels at $95.60, $97.75, and $99.88. If the trend continues to break lower, then support will be at $88.71, $86.31, and $84.36.
Rising the price of WTI crude oil to $92.97 will test bullish momentum. Currently, I am expecting another test of the lower support of the channel. If the price of oil breaks through $95.60, then I will be expecting further rally. On the other hand, breaking through support at $88.71 will open a further bearish trend with potential support at $86.31.
Brent Crude Oil Technical Analysis: UKOIL Holds $95.56 as $96.68 Resistance Caps the Bounce
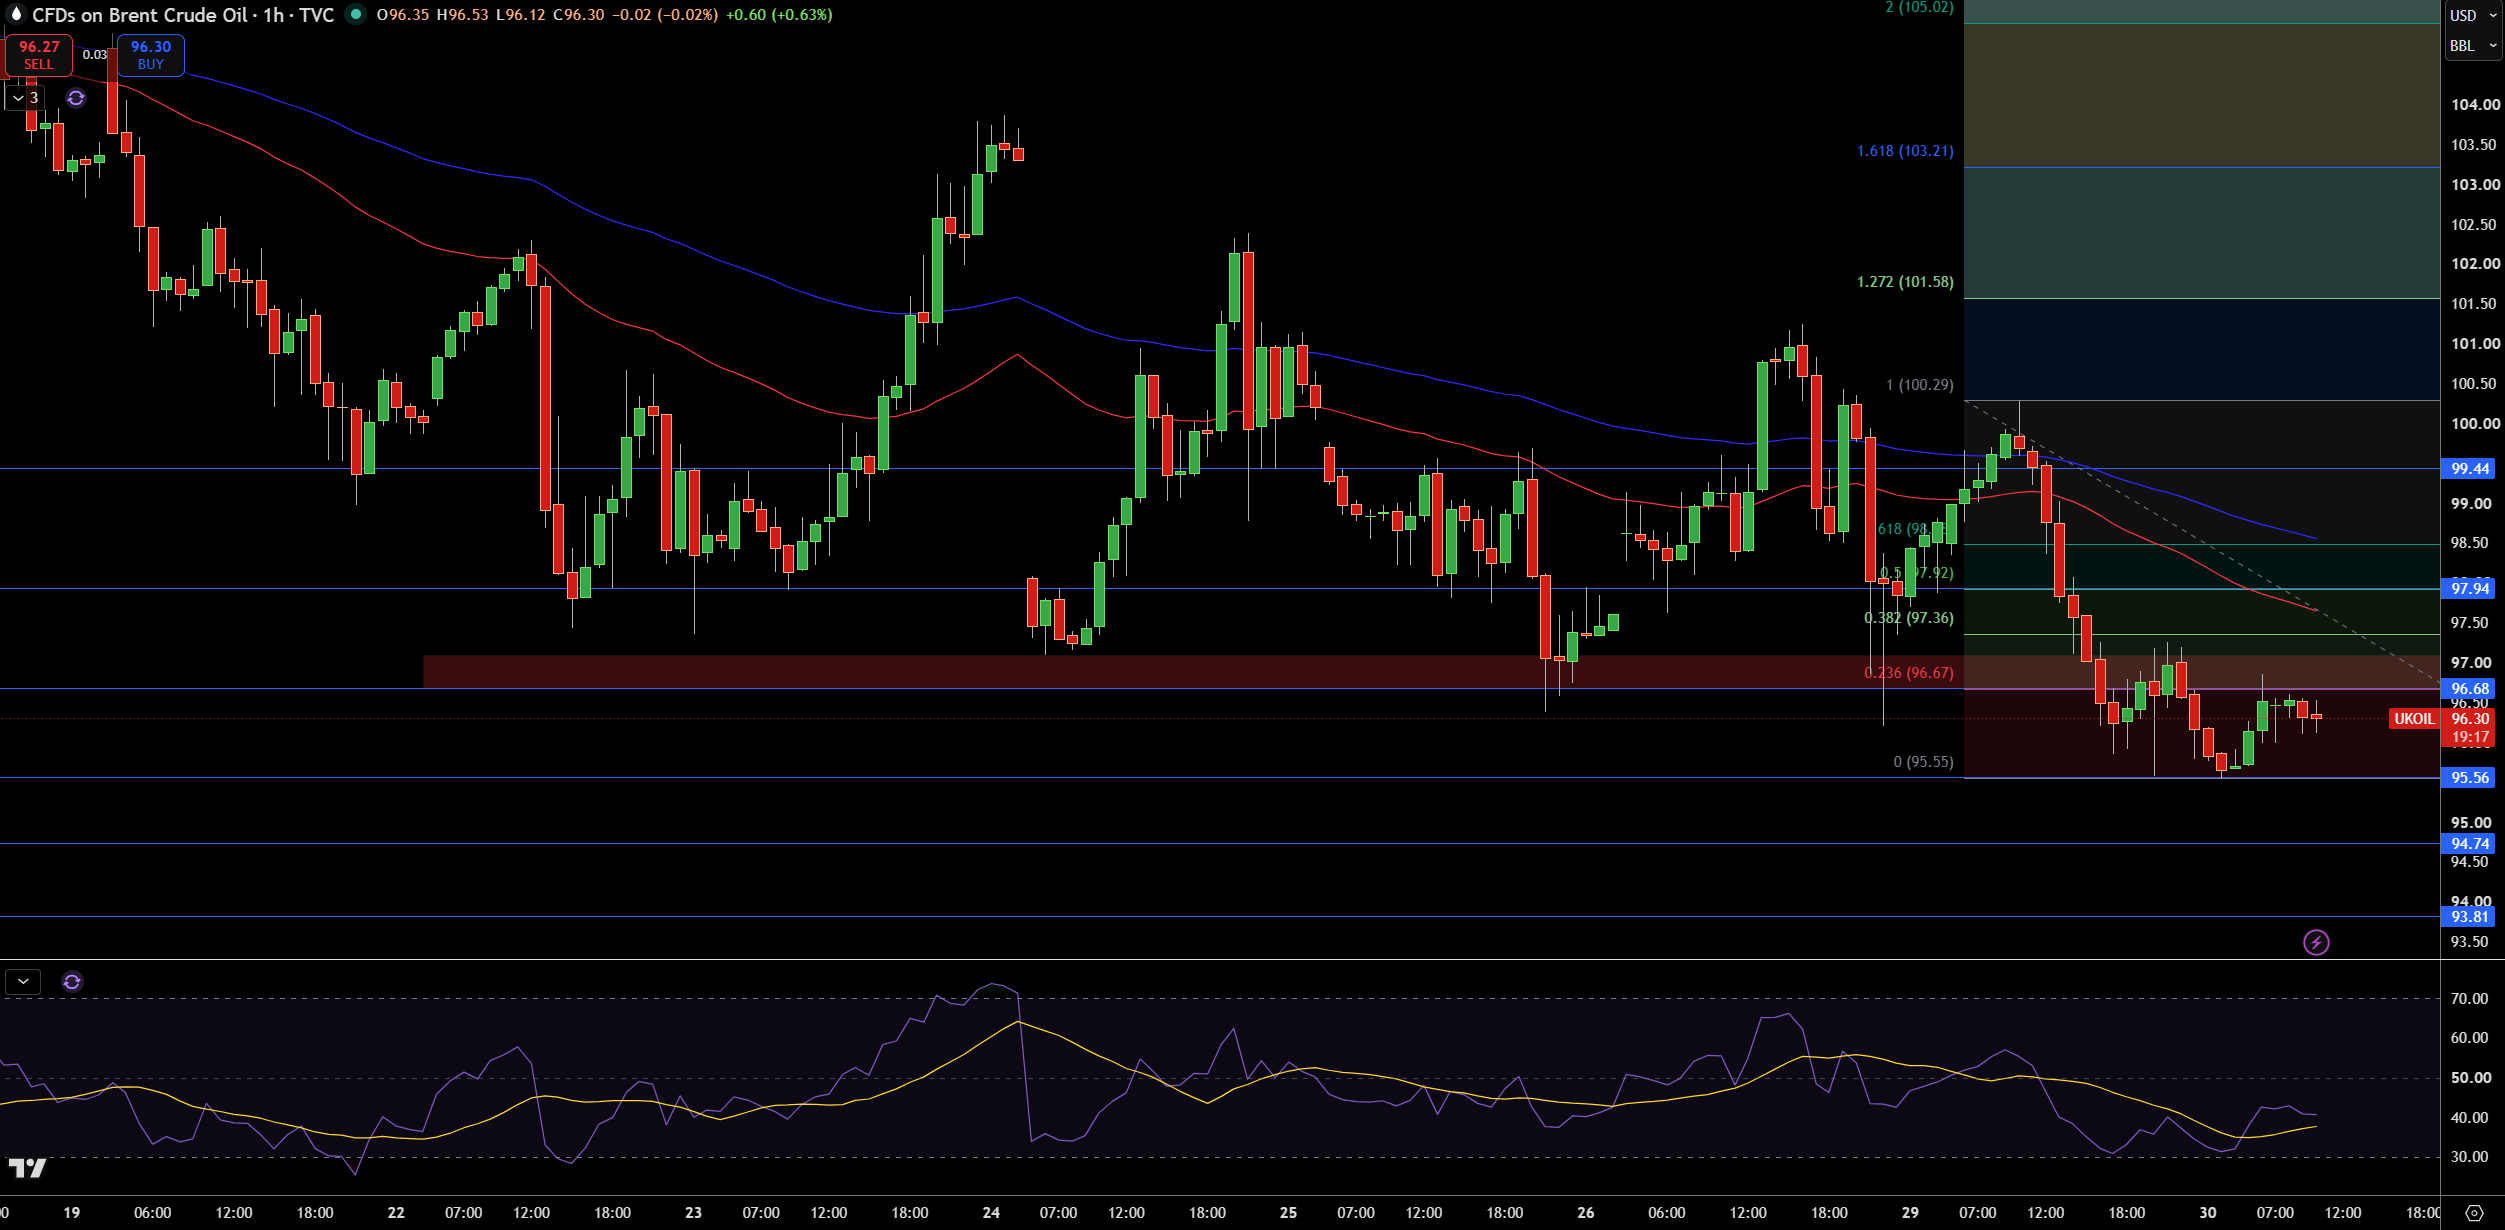
Brent crude is currently trading at approximately $96.30 according to the 1-hour chart. It is encountering selling pressure around the $96.68-$97.36 resistance zone and is currently trading below both the 100 and 200 hour moving averages. The bearish trend remains intact until the reversal below the $95.56 support level.
If selling pressure resumes, the support level to watch is $95.56. A break below this level would open the way for the $94.74 and $93.81 levels. The $96.68 level was previously resistance, and a break above this level would be bullish. The next levels of interest would be $97.36, $97.94 and $99.44.
The RSI is providing a bullish signal. While the reading is below the 50 level, this indicates that the momentum is positive. The current trend remains bearish and a sell-off remains possible. I will look to take a more bullish view on Brent crude if it trades and holds above the $97.94 level. Alternatively, a breakdown below the $95.56 level would open the way for the $94.74 level.


