



Dollar Index Outlook: Fed Hike Bets Ease as Energy and Political Risks Weigh on EUR and GBP
While USD/EUR and USD/GBP have slightly bullish month-to-date edges, USD bears eased somewhat after New York Fed President Williams said he did not see an “urgency” after the September Fed rate hike and indicated a more gradual approach to future hikes.
Willam’s dovish remarks pressured odds of a 25 bp hike in October from 71% to 48%. An untested core PCE price index report for the month of September due out today and a two-day ream of U.S. labor market data, which includes the Nonfarm payrolls report on Friday, are now in focus.
Elevated U.S. inflation and frequent issuance of U.S. Treasuries have driven the 10-year U.S. Treasury note yield above 3.6% and put a lid on bonds, supporting the greenback. The U.S. Dollar is set for a strong month.
It is true that major rises in energy costs as a result of the conflict in Iran have hurt the euro recently. Along with rising geopolitical tensions, French bonds are once again far less attractive than their German counterparts, pushing yields up by 115 basis points. The euro looks set for its worst monthly performance against the dollar in over a year.
Looking at sterling, Britain’s budget deficit remains large, but recent actions by the government have signaled a greater commitment to reigning in spending. Along with signs of tighter spending, Bank of England data has shown that unsecured consumer lending picked up in August. This raises concerns about the health of the UK labor market, and further complicates the challenges posed by the Bank’s efforts to control inflation.
Looking at these factors, the dollar has a moderately bullish bias against the euro and a bearish bias against the pound. Major moves in either currency are expected to come from the release of the U.S. PCE report and the jobs report on Friday.

U.S. Dollar Index Technical Analysis: DXY Holds 101.33 as 101.61 Becomes the Next Upside Test
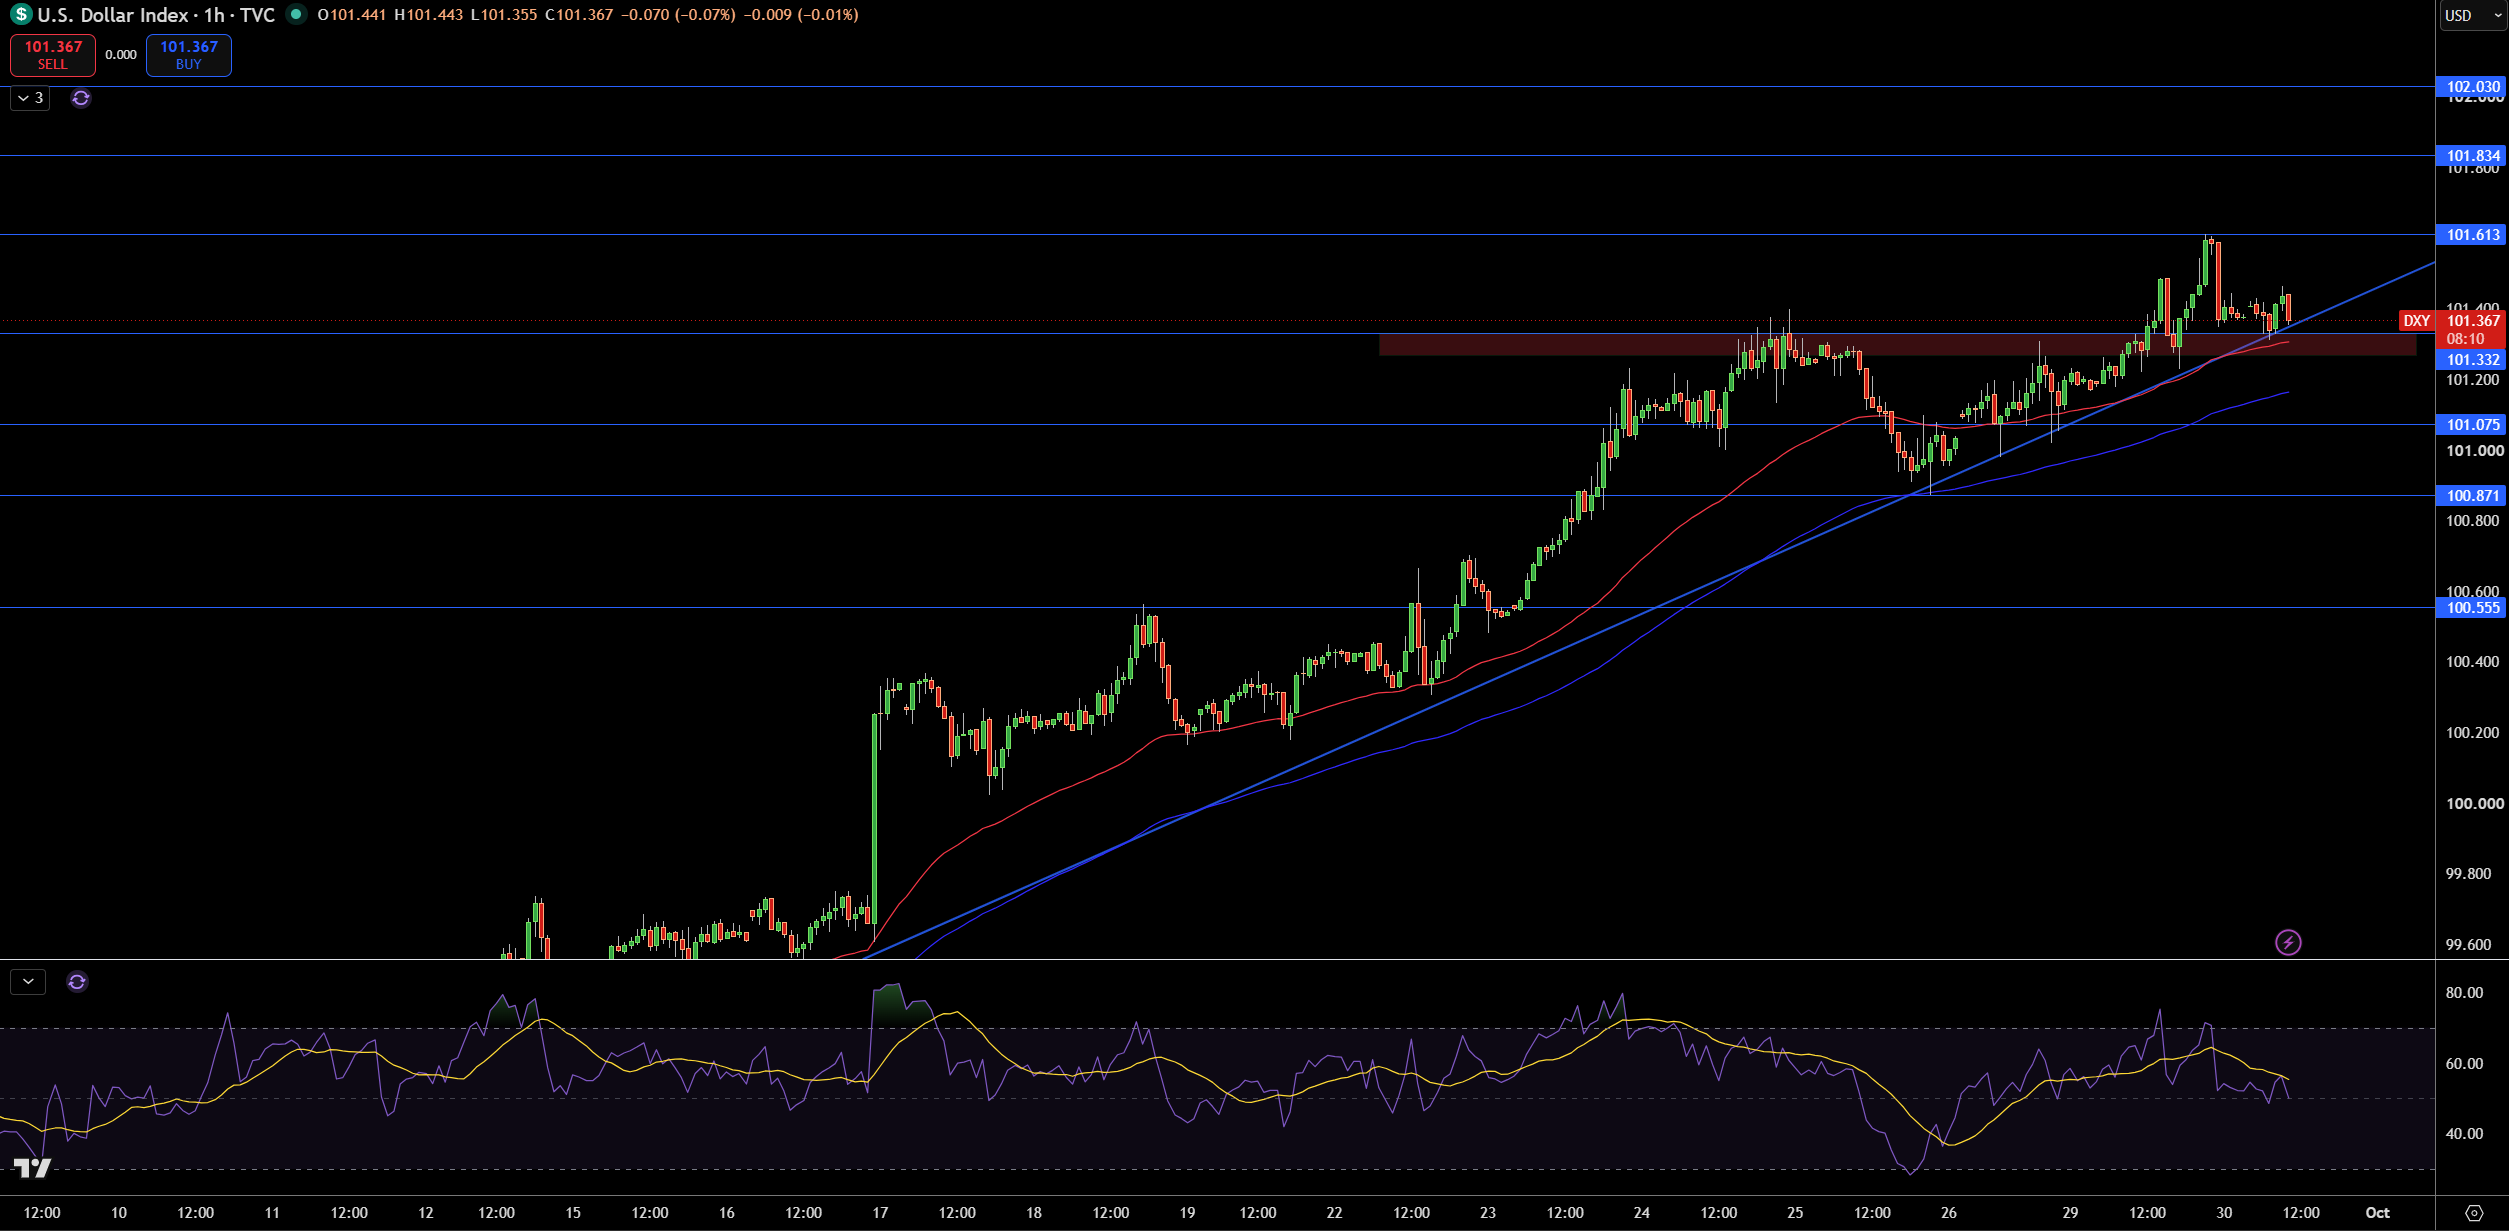
The U.S. Dollar Index is currently trading at 101.37. From the 1 hour chart, I see that price is currently trading above the 20 and 50 moving averages, as well as above a rising trendline. Support at 101.33 was recently found and is also above the rising trendline. I see that price action is testing the rising trendline and lower resistance levels.
I see that 101.61 is the first resistance level. A break above this level would shift focus to the 101.83 level and the 102.03 level. There are several support levels located below the 101.33 level. These levels are located at 101.08, 100.87, and 100.56.
RSI is currently at a neutral level. If price is trading at rising trendline support, I would look for a counter trend trade in the up direction. A break and close below 101.08 would change the trend to down, and a break and close above 101.61 would change the trend to up, with the next target being the 102.03 level.
EUR/USD Price Forecast
Every new EUR/USD analysis as it publishes, today's technical signal and key levels, live price — on one page.
See all EUR/USD forecastsGBP/USD Technical Analysis: Sterling Holds 1.3205 as 1.3250 Remains the First Recovery Hurdle
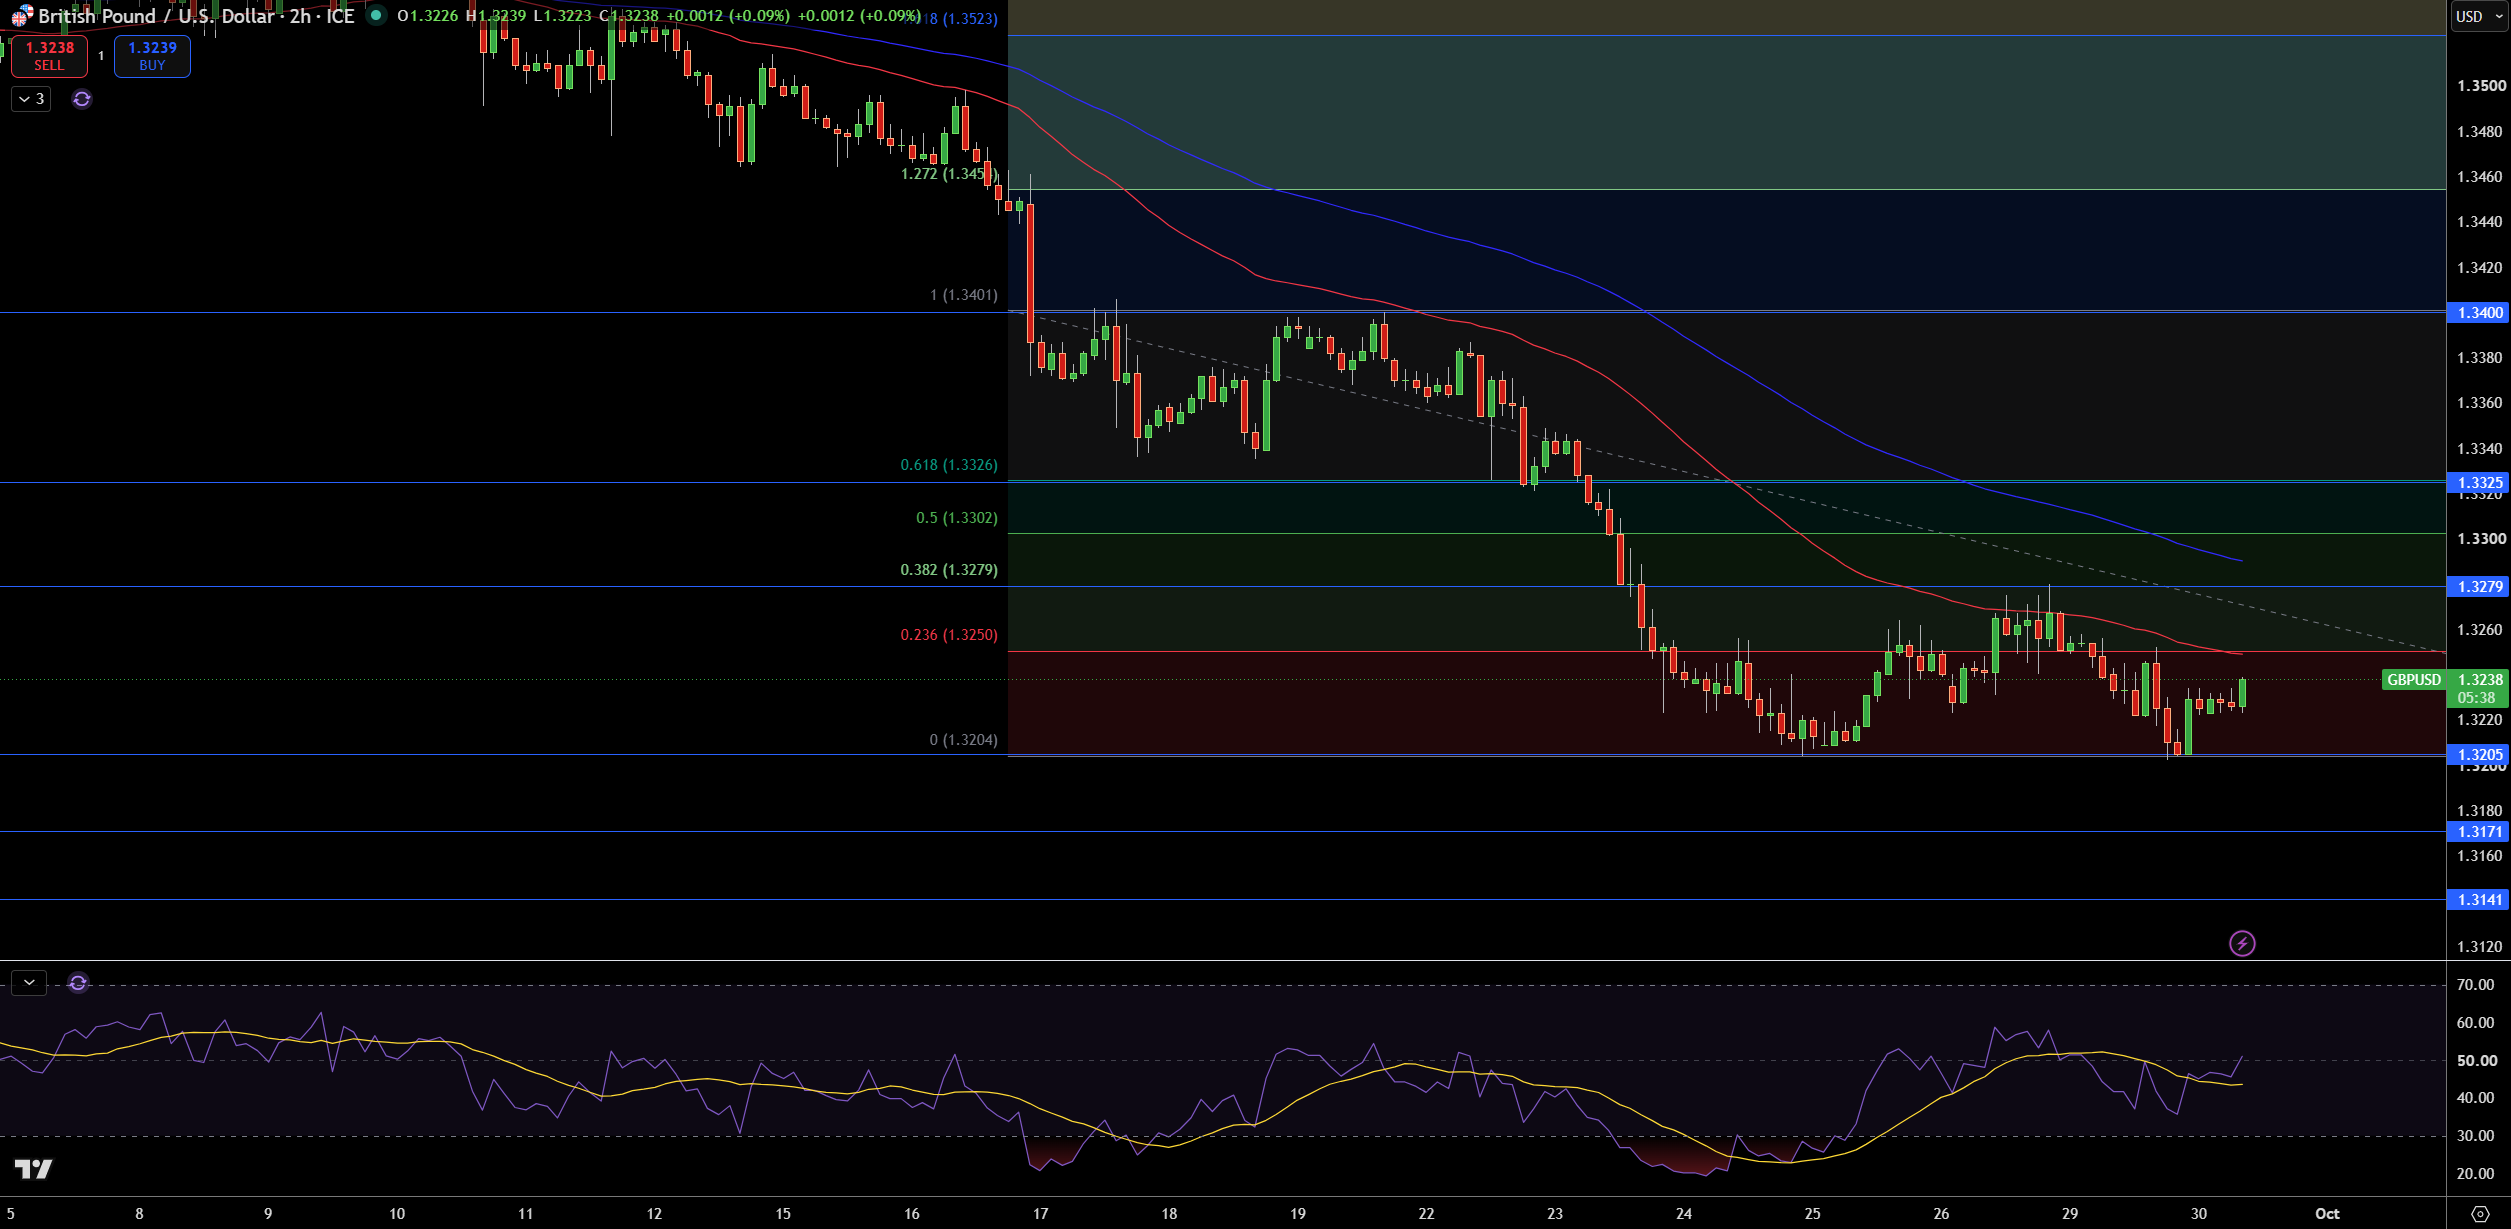
The British Pound has been trading at 1.3238 on the 2 hour chart and has been trading between support at 1.3205 and no resistance. The British Pound has been trading below both the 100 and 200 hour moving averages and has been between a descending resistance. While it has recently trading sideways, it hasn’t been able to break above 1.3250.
The first area of possible resistance is at 1.3250. Should the British Pound break above this level, it would target 1.3279 and 1.3302. Support is at 1.3205, with additional support possible at 1.3171 and 1.3141.
The RSI is at the 50 level after recently being at oversold levels. While it is possible that a higher low has been created, I expect it to trade lower. I would be neutral about the British Pound if it traded above 1.3279 and expect it to move lower if it trades below 1.3205.
EUR/USD Technical Analysis: Euro Holds 1.1311 as 1.1353 Resistance Caps the Recovery
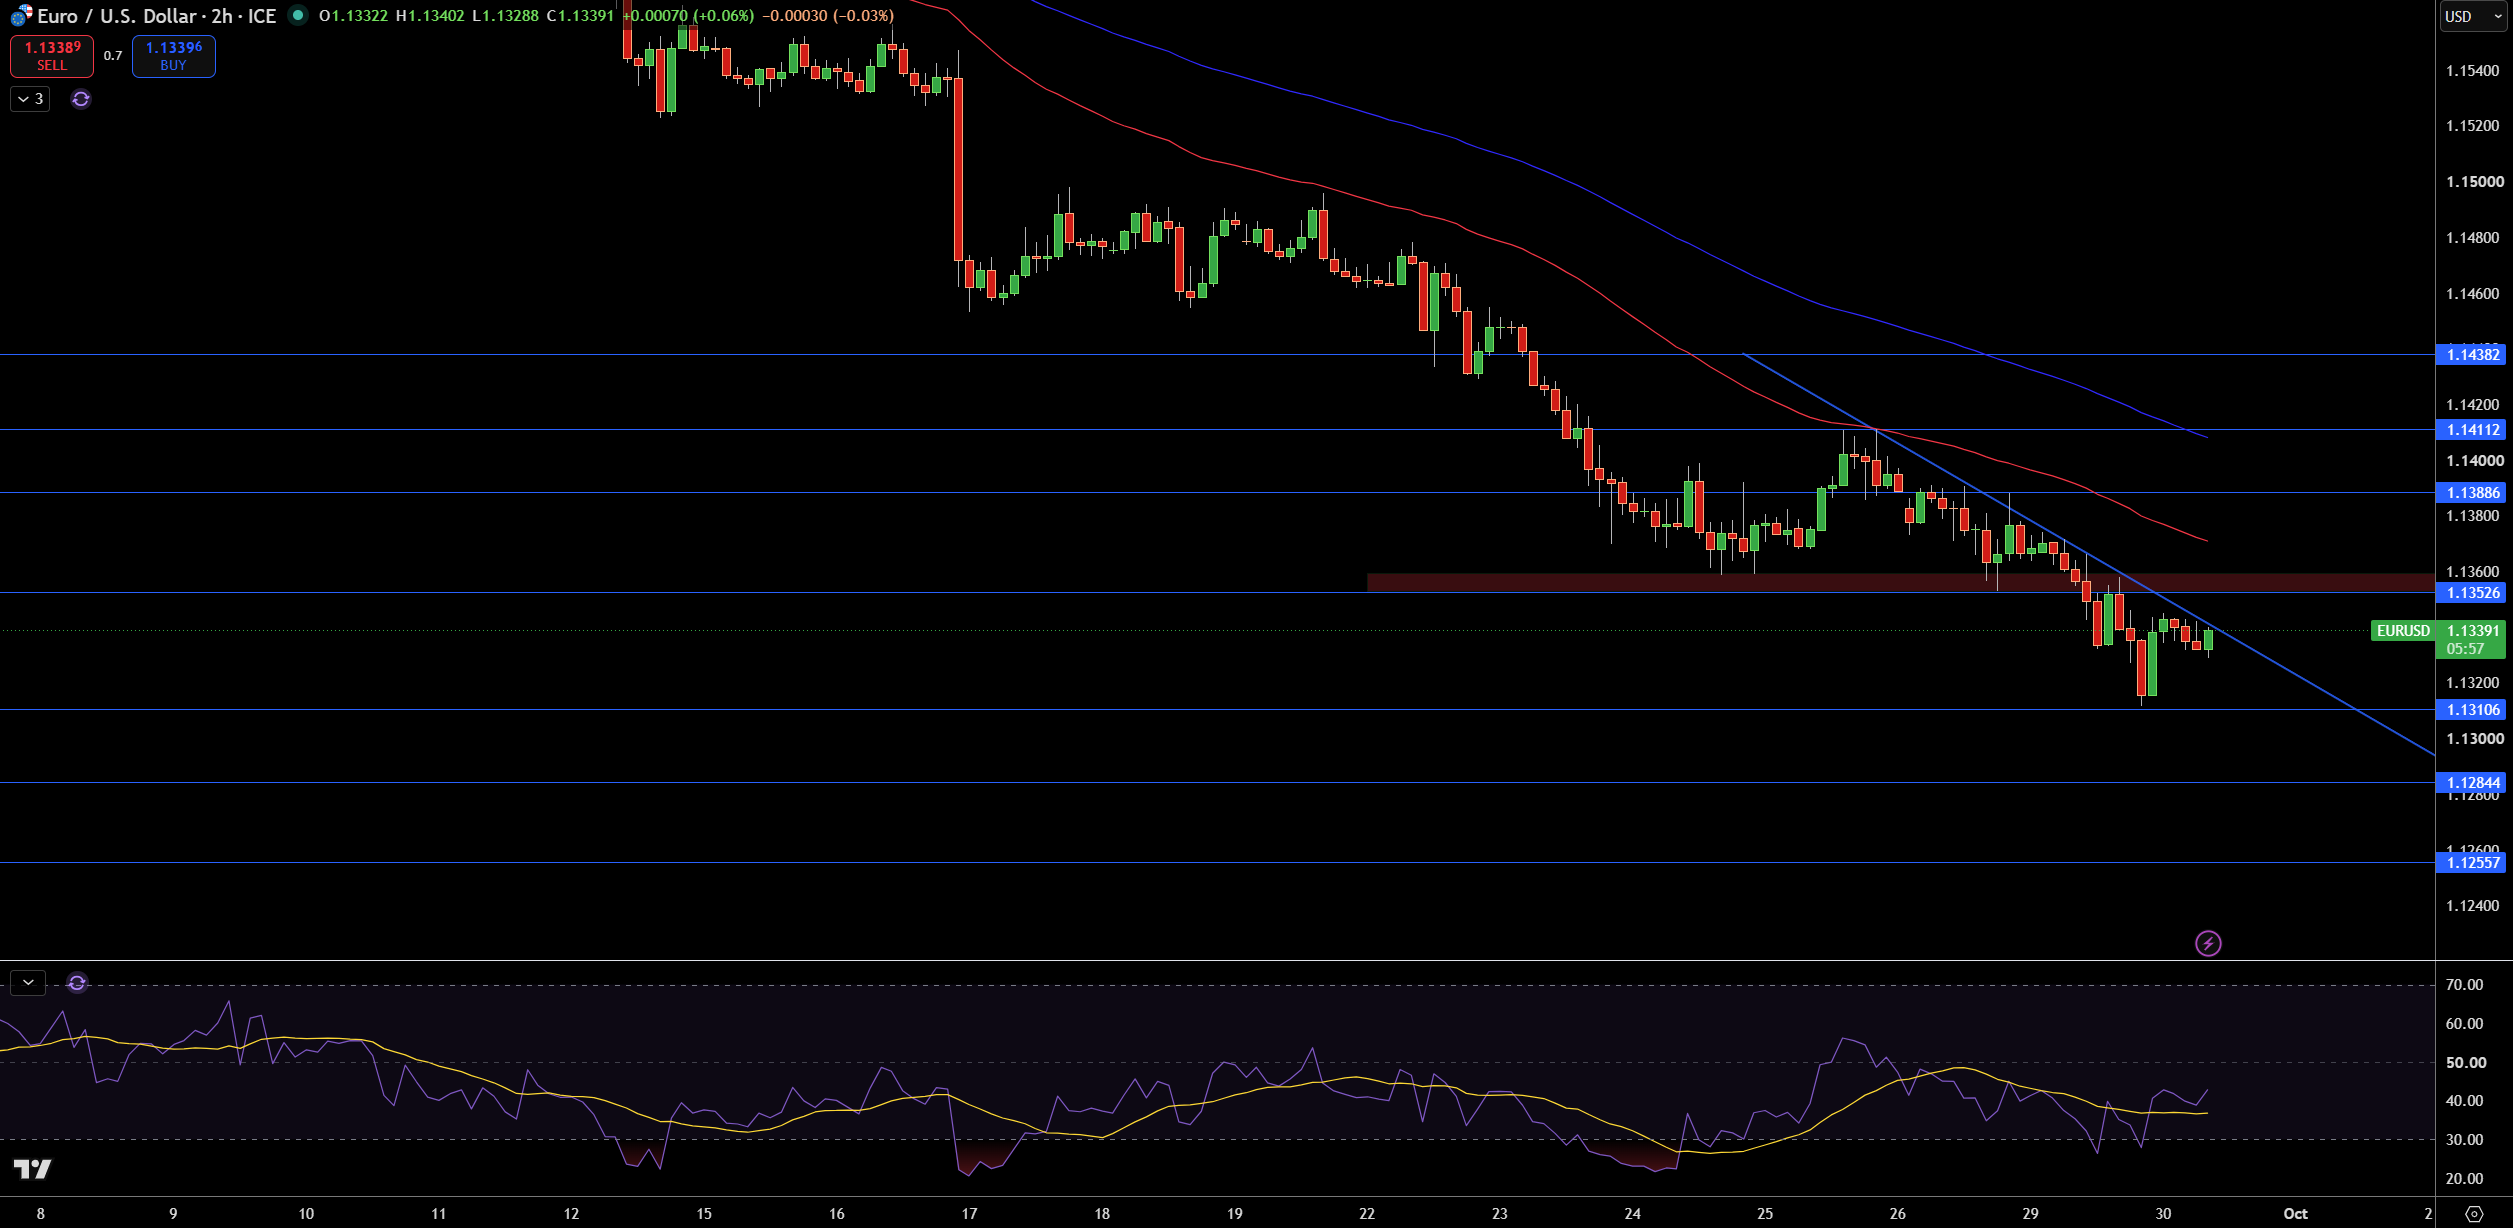
The EUR/USD pair is trading at 1.1339. The pair recently rebounded from 1.1311 and is currently trading below the 20 and 50 moving averages. Price action is also trading below a falling trendline. The pair is currently trading between the falling trendline and the 1.1353 level.
The first level of interest comes in at 1.1353. A break above this exposes potential resistance at 1.1389, 1.1411 and 1.1438. On the downside, 1.1311 protects the support side of the market. Additional support comes in at 1.1284 and 1.1256.
Rising RSI tells us that we have moved away from oversold conditions. While this indicates that downside should be limited, the momentum of the move higher should also be capped. I am looking for the euro to extend lower, focusing on support at 1.1311. A break lower opens the door for 1.1284.
From a technical perspective, a move higher and a break above 1.1411 changes the short term outlook. Alternatively, a break lower and close below 1.1311 opens the door for additional downside and extends support lower to 1.1284.



