Gold (XAU) and silver (XAG) prices remained under pressure on Wednesday as high Treasury yields limited their recovery. Gold traded near $4,172 in early Asian trading while silver hovered around $60.75. The US 2-year yield eased to about 4.89%, but the 10-year yield stayed near 5.24%.
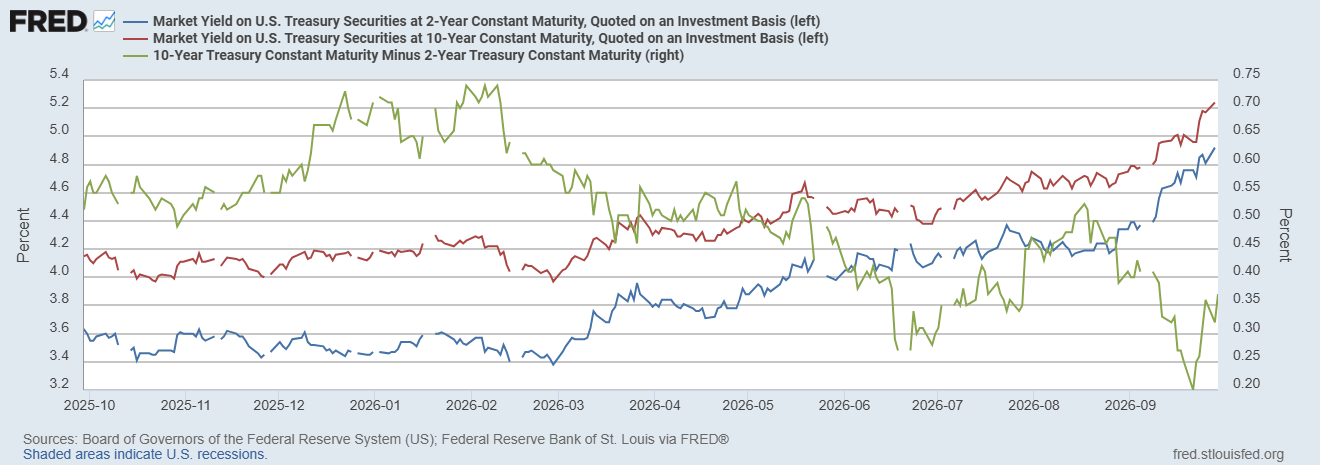
In my view, the correction in Treasury yields in the short term offers only limited relief for both metals. The probability of the rate hike by the Fed in October has dropped to 47.1% on Tuesday. But the longer-term yields still remain high.
The oil market added another challenge as Brent crude traded above the $100 mark in early Asian trading. The uncertainty over the talks between the US and Iran kept supply concerns in focus. The high energy prices could prolong inflationary pressures and keep expectations of further tightening by the Fed alive. That could limit demand for gold and silver even when geopolitical uncertainty attracts buyers seeking safety.
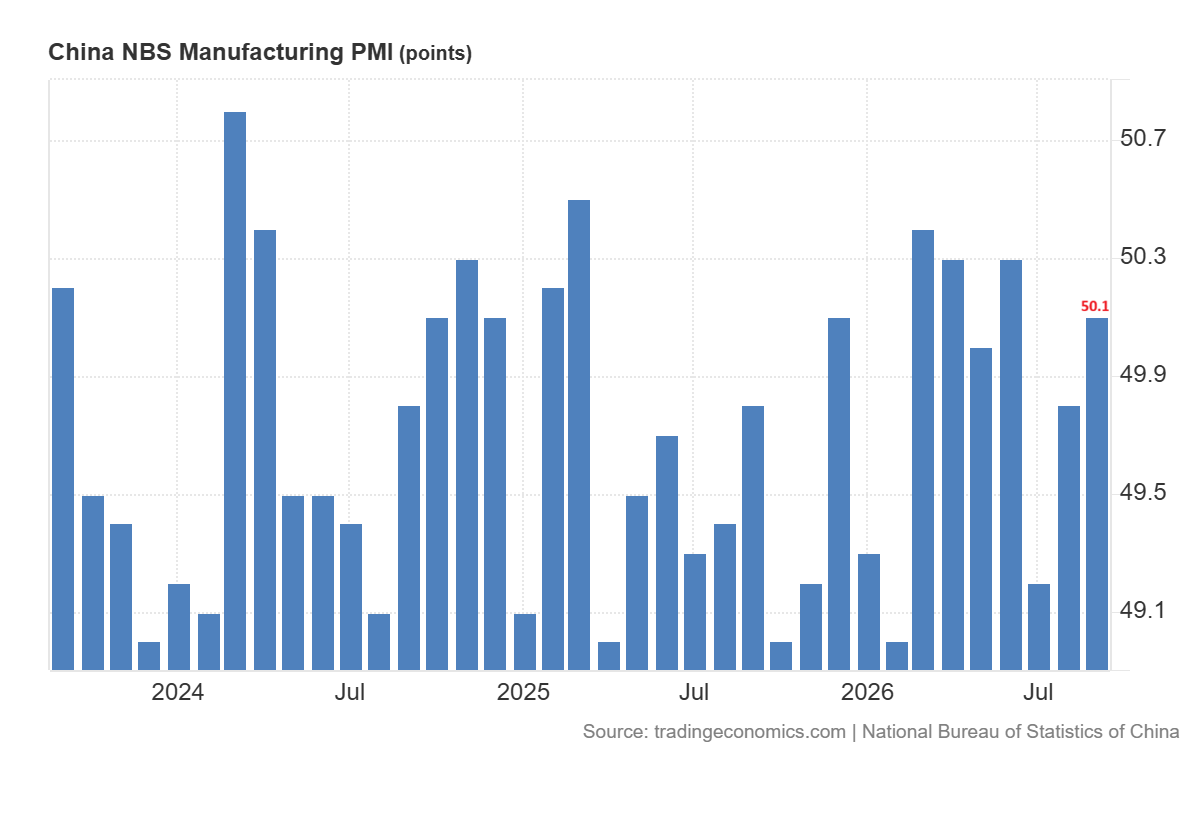
Silver also received a fresh signal from China. The official manufacturing PMI rose to 50.1 in September from 49.8 in August. This data brings factories back into modest expansion. In my view, this could support the industrial demand for silver. Traders now await US PCE inflation later today. The softer inflation could ease pressure from yields and help a recovery in both metals. But a stronger reading could renew selling pressure in metals.

Gold Price Forecast: Weak Rebound Keeps $4,000 in Focus
Gold Daily and Weekly Charts: $4,100 Support Remains Key
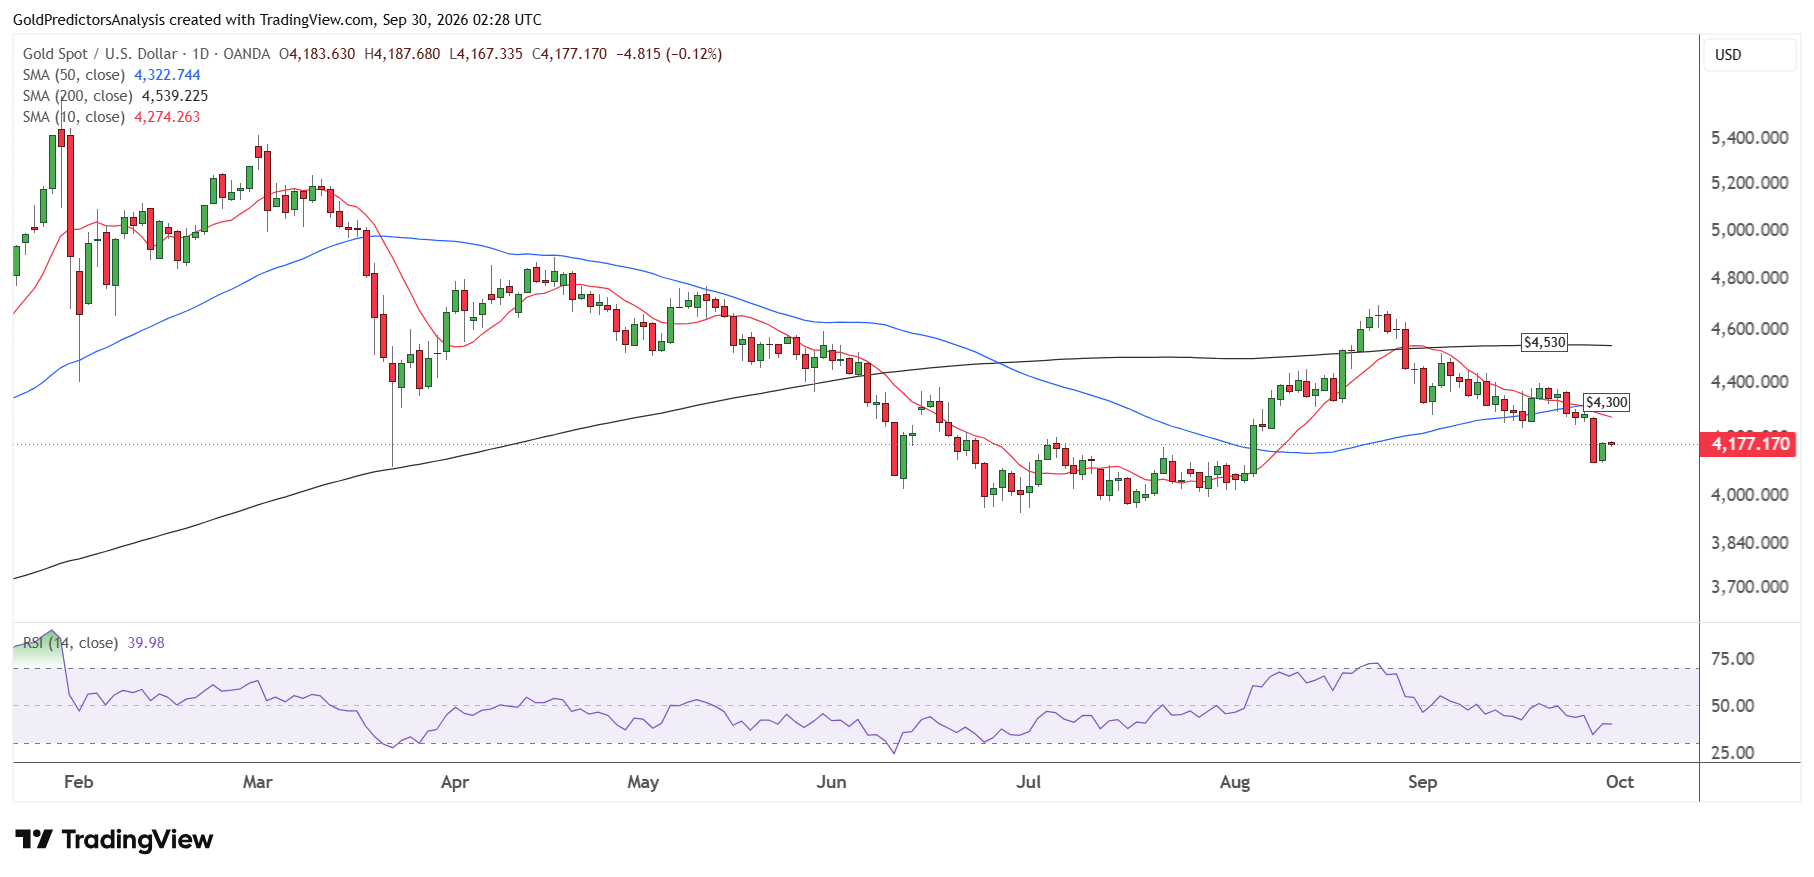
The daily chart for spot gold shows that the price remains under bearish pressure after the break below the 50-day SMA at $4,300. The price also remains below the 10-, 50- and 200-day SMAs and looks to continue the downward trend.
The price gained 1.63% on Tuesday, but the rebound so far is weak. Unless the price recovers above $4,300, the possibility of a continuation toward the $4,000 level remains high. The RSI also remains below the midline, which suggests further downside in the next few days.
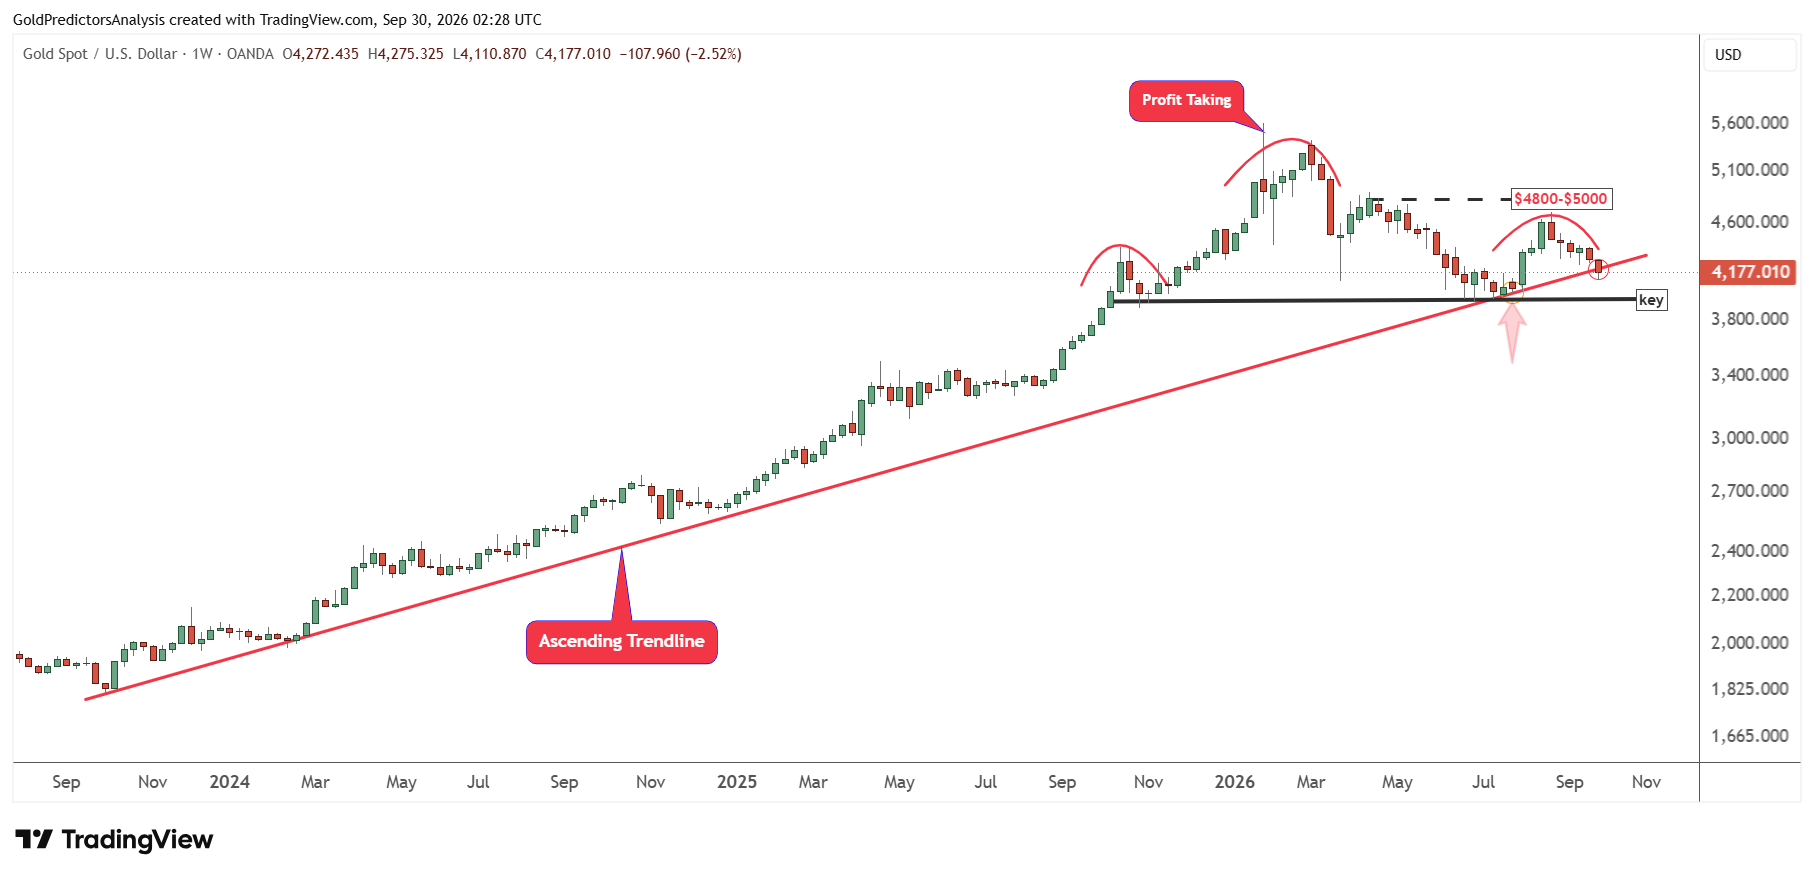
However, the price is now consolidating around the key level on the weekly chart. This key level is defined by the ascending trend line that stretches from the October 2023 lows. A break below $4,100 will open the way for a drop towards the $3,900 to $4,000 area.
Overall, the consolidation from January 2026 has produced negative price action below the $5,000 region. As long as the price remains below $5,000, the price action remains negative in the short term.
Gold Price Forecast
Every new Gold analysis as it publishes, today's technical signal and key levels, live price — on one page.
See all Gold forecastsGold 4-Hour Chart: $4,300 Break Could Open the Way to $4,500
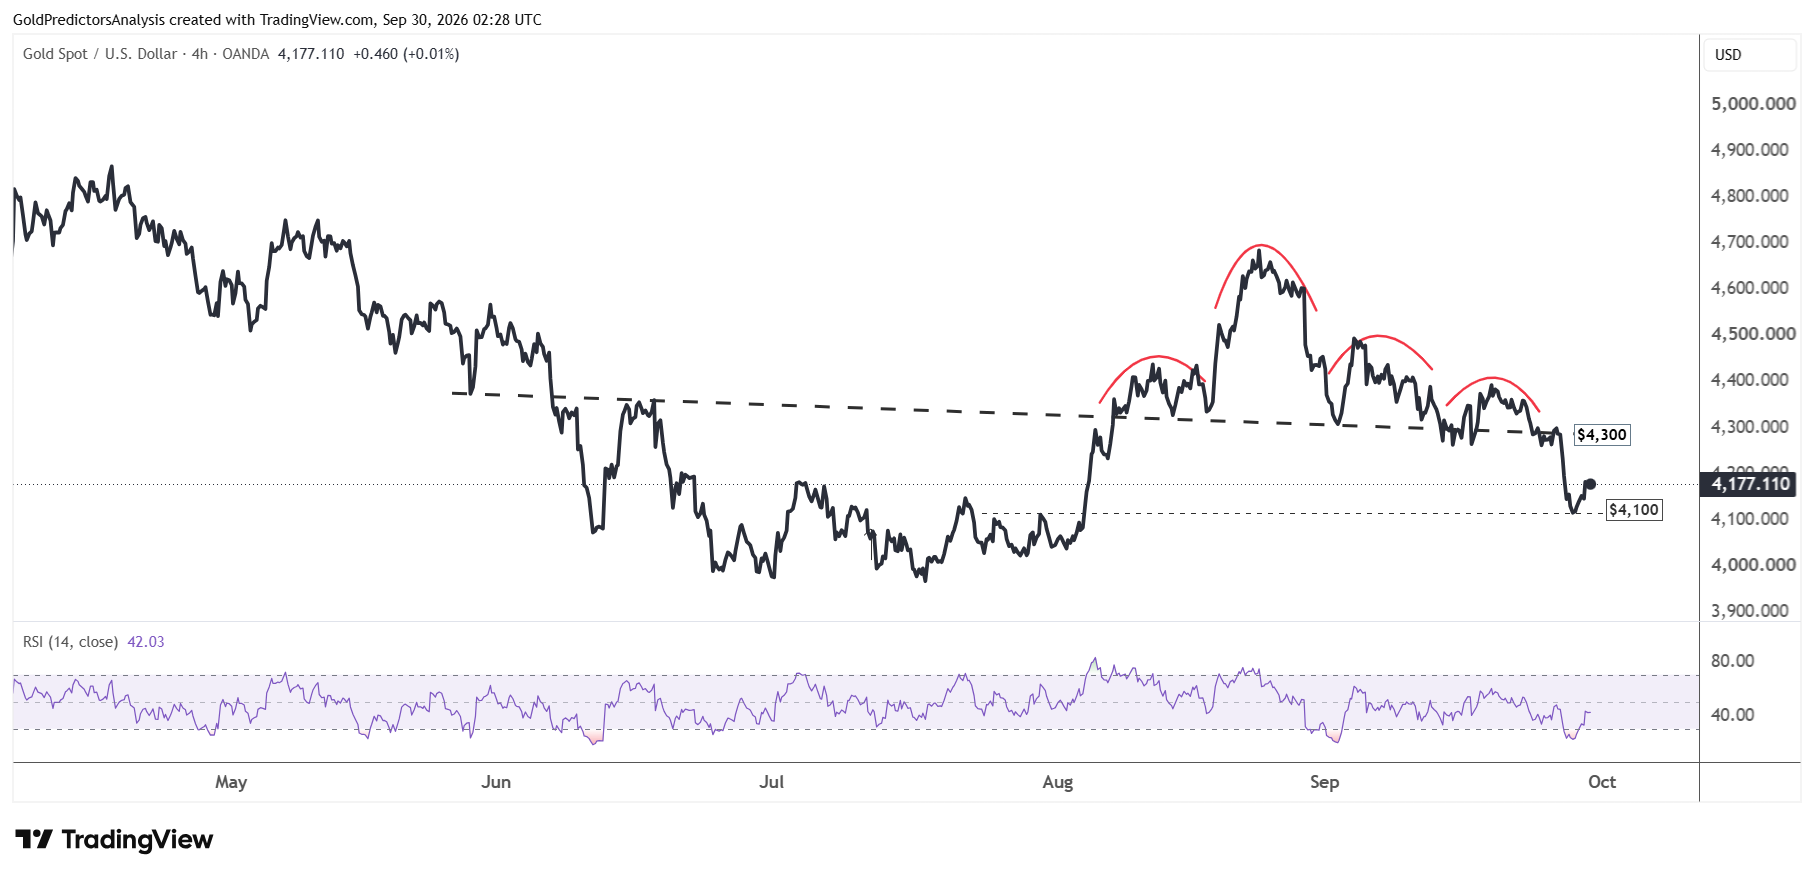
The 4-hour chart for spot gold shows that the price hit the first support at $4,100, which triggered a rebound toward $4,180. The RSI was extremely oversold on the 4-hour chart when the price hit $4,100. The rebound so far is weak which suggests that the rally might be limited below $4,300. But a break above $4,300 will indicate further upside towards $4,500.
Silver Price Forecast: Recovery Faces $64 Resistance
Silver Daily Chart: $60 Break Could Expose $55
The daily chart for spot silver also shows negative price action in the short term, as the price has broken below the $64 level. The price now remains within the primary support zone between $55 and $64. The failure of the silver price at $72 in August 2026 suggests negative price action and increases the possibility of further downside toward the $55 area.
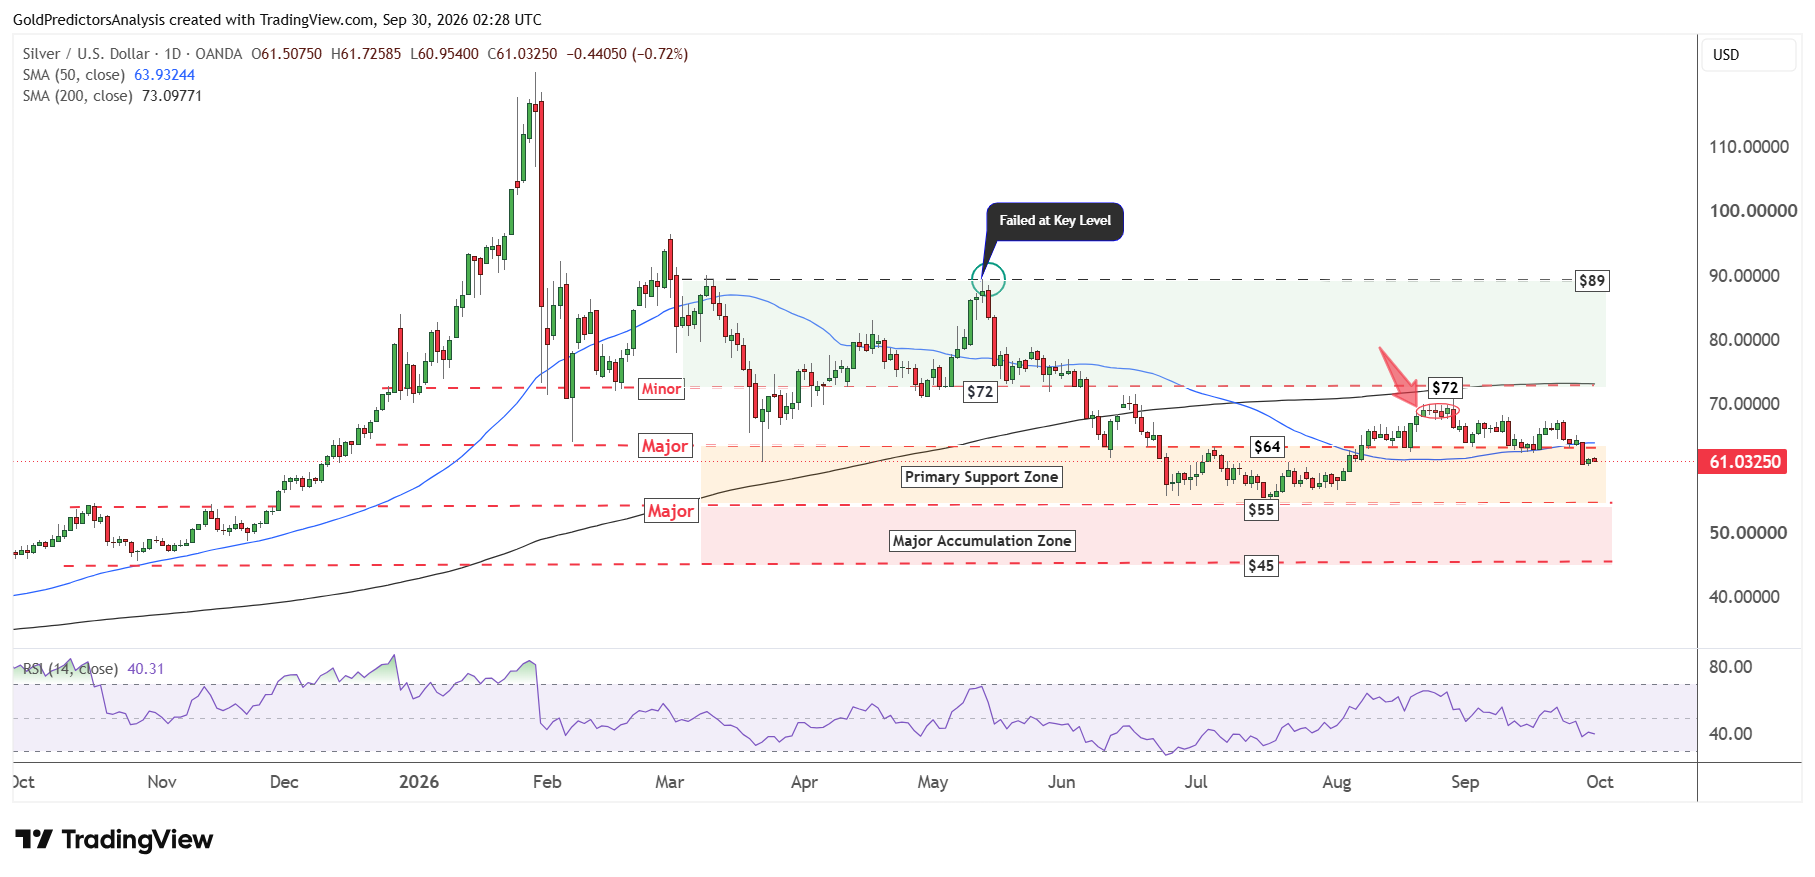
A break below the $60 level in the short term to open the way for a further drop. The RSI remains below the midline at 40, which suggests further downside in the short term. But a recovery above $64 will ease the pressure and suggest a move towards $72.
Silver 4-Hour Chart: $62.60 Break Could Extend the Rebound
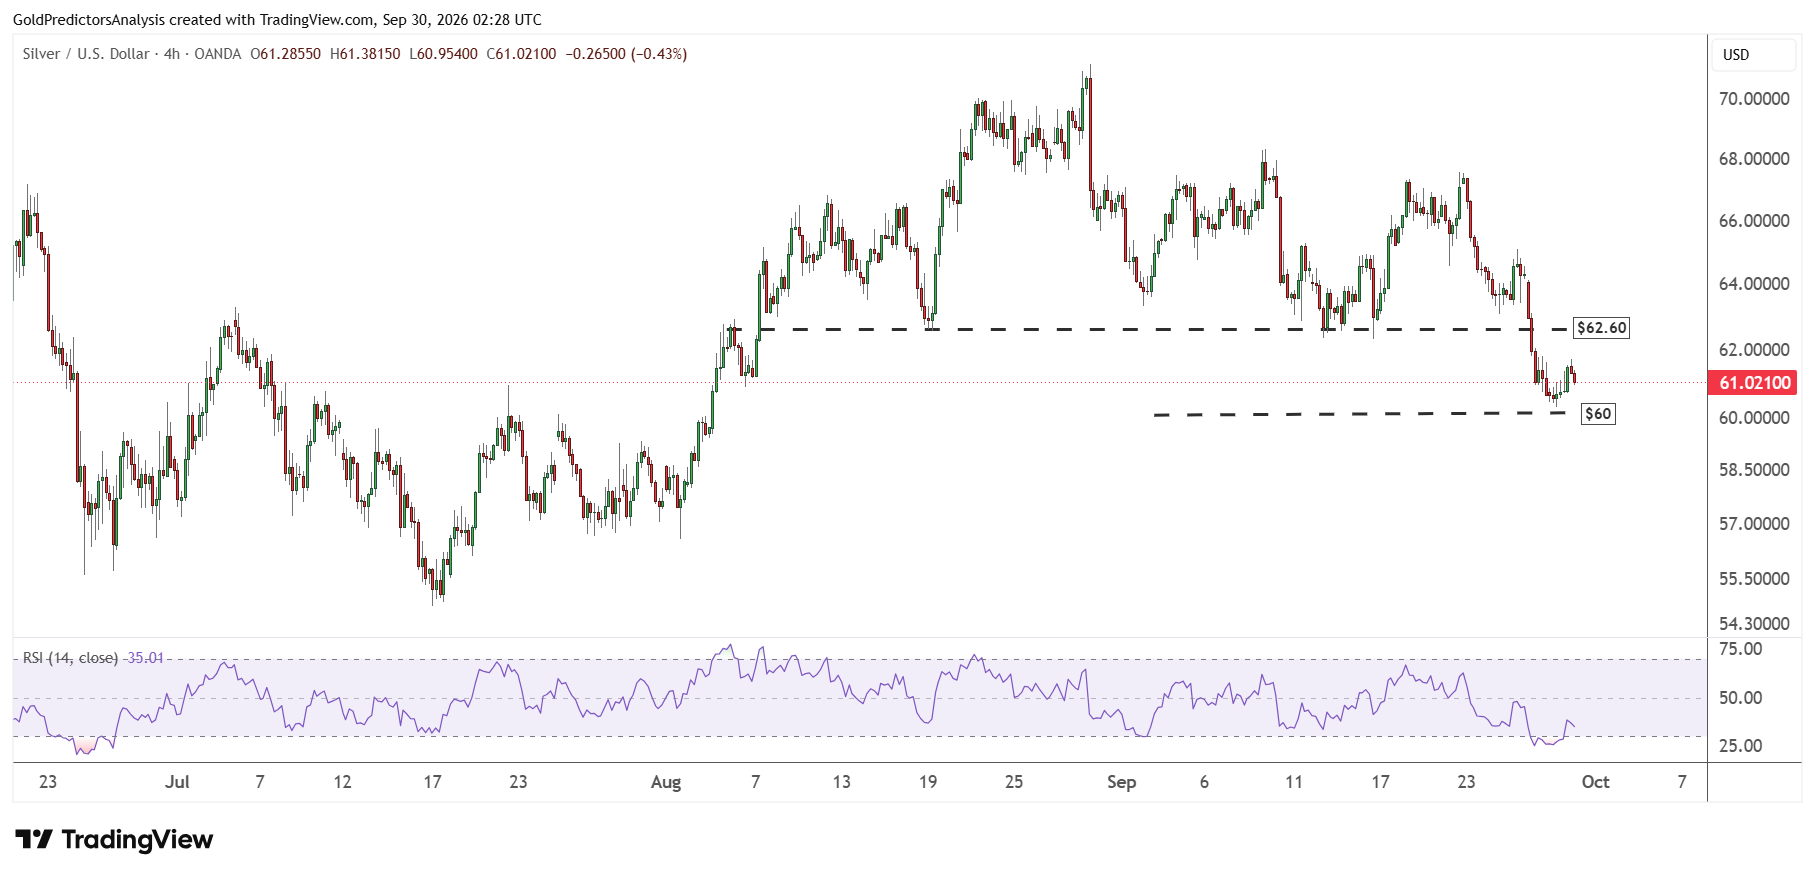
The 4-hour chart for spot silver shows that the price broke below the $62.60 support and hit the $60 level. However, after hitting the support zone, the price is now rebounding back to $62.60. The RSI was extremely oversold when spot silver hit the support zone at $60. A break below $60 will open the way for another drop towards the $55 area. On the other hand, a recovery above $62.60 will indicate further upside in the short term.
What to Watch Next for Gold and Silver Prices
Gold and silver remain under pressure as high Treasury yields and elevated oil prices limit the recovery in metals. The softer PCE inflation could ease this pressure while a stronger reading could renew selling in both metals. Gold needs to reclaim $4,300 to strengthen the rebound. Silver needs to recover above $64 to open the way toward $72. A break below $4,100 in gold could expose the $3,900-$4,000 area. Silver could drop towards $55 if it loses $60. In my view, both rebounds remain weak because prices have yet to clear their key resistance levels.
Read more: 5% Yields and Strong Dollar Cap Rebound Ahead of PCE