



Gold: China Steps Up Buying as Fed Minutes Take Center Stage
Data released on Wednesday showed that the People’s Bank of China increased its gold holdings for the 23rd month in a row in September. Official holdings increased to 77.47 million ounces in September from 76.73 million ounces in August, according to the data. The increase shows that Beijing’s gold accumulation is part of a strategic reserves’ diversification program, and not a short-term market intervention.
Other central banks have also been accumulating the yellow metal. The World Gold Council reported that according to the latest data, official sector purchases for the month of August totaled 39 tonnes, bringing year to date purchases to 170 tonnes.
The minutes from the September FOMC meeting is set for release on Wednesday, and markets will be monitoring the release to interpret how policymakers changed their views on the economy. A slowdown in the U.S. labor market and moderating U.S. inflation have been the primary driver behind expectations that the FOMC will not increase interest rates at its October meeting.
However, markets are pricing in an over 85% probability of an interest rate increase at the December FOMC meeting. Earlier this week, President of the Federal Reserve Bank of Kansas City, Jeffrey Schmid, said that further increases in the Fed’s policy rate may still be warranted to keep inflation in check.

Silver: Investment Demand Offsets Solar-Sector Thrifting
Like gold, silver is sensitive to Fed policy. However, where supply and demand meet, physical markets for silver are more tightened. The Silver Institute is expecting 2026 to represent a sixth straight annual deficit of 46.3 million ounces, according to its April World Silver Survey 2026, with total demand forecast to fall 2% to 1.11 billion ounces.
The decline in fabrication demand, however, is expected to be partly offset by stronger investment. Industrial demand is forecast to fall 3%, while coin and net bar demand is expected to jump 18%. It’s reported that solar manufacturers are accelerating thrifting and substitution away from silver in photovoltaic applications.
The Silver Institute expects grid expansion, and growing AI data centers and automotive electronics as other positive growth areas for silver demand.
Gold Price Forecast
Every new Gold analysis as it publishes, today's technical signal and key levels, live price — on one page.
See all Gold forecastsGold Technical Analysis: XAU/USD Holds $4,112 as $4,160 Remains the First Recovery Barrier
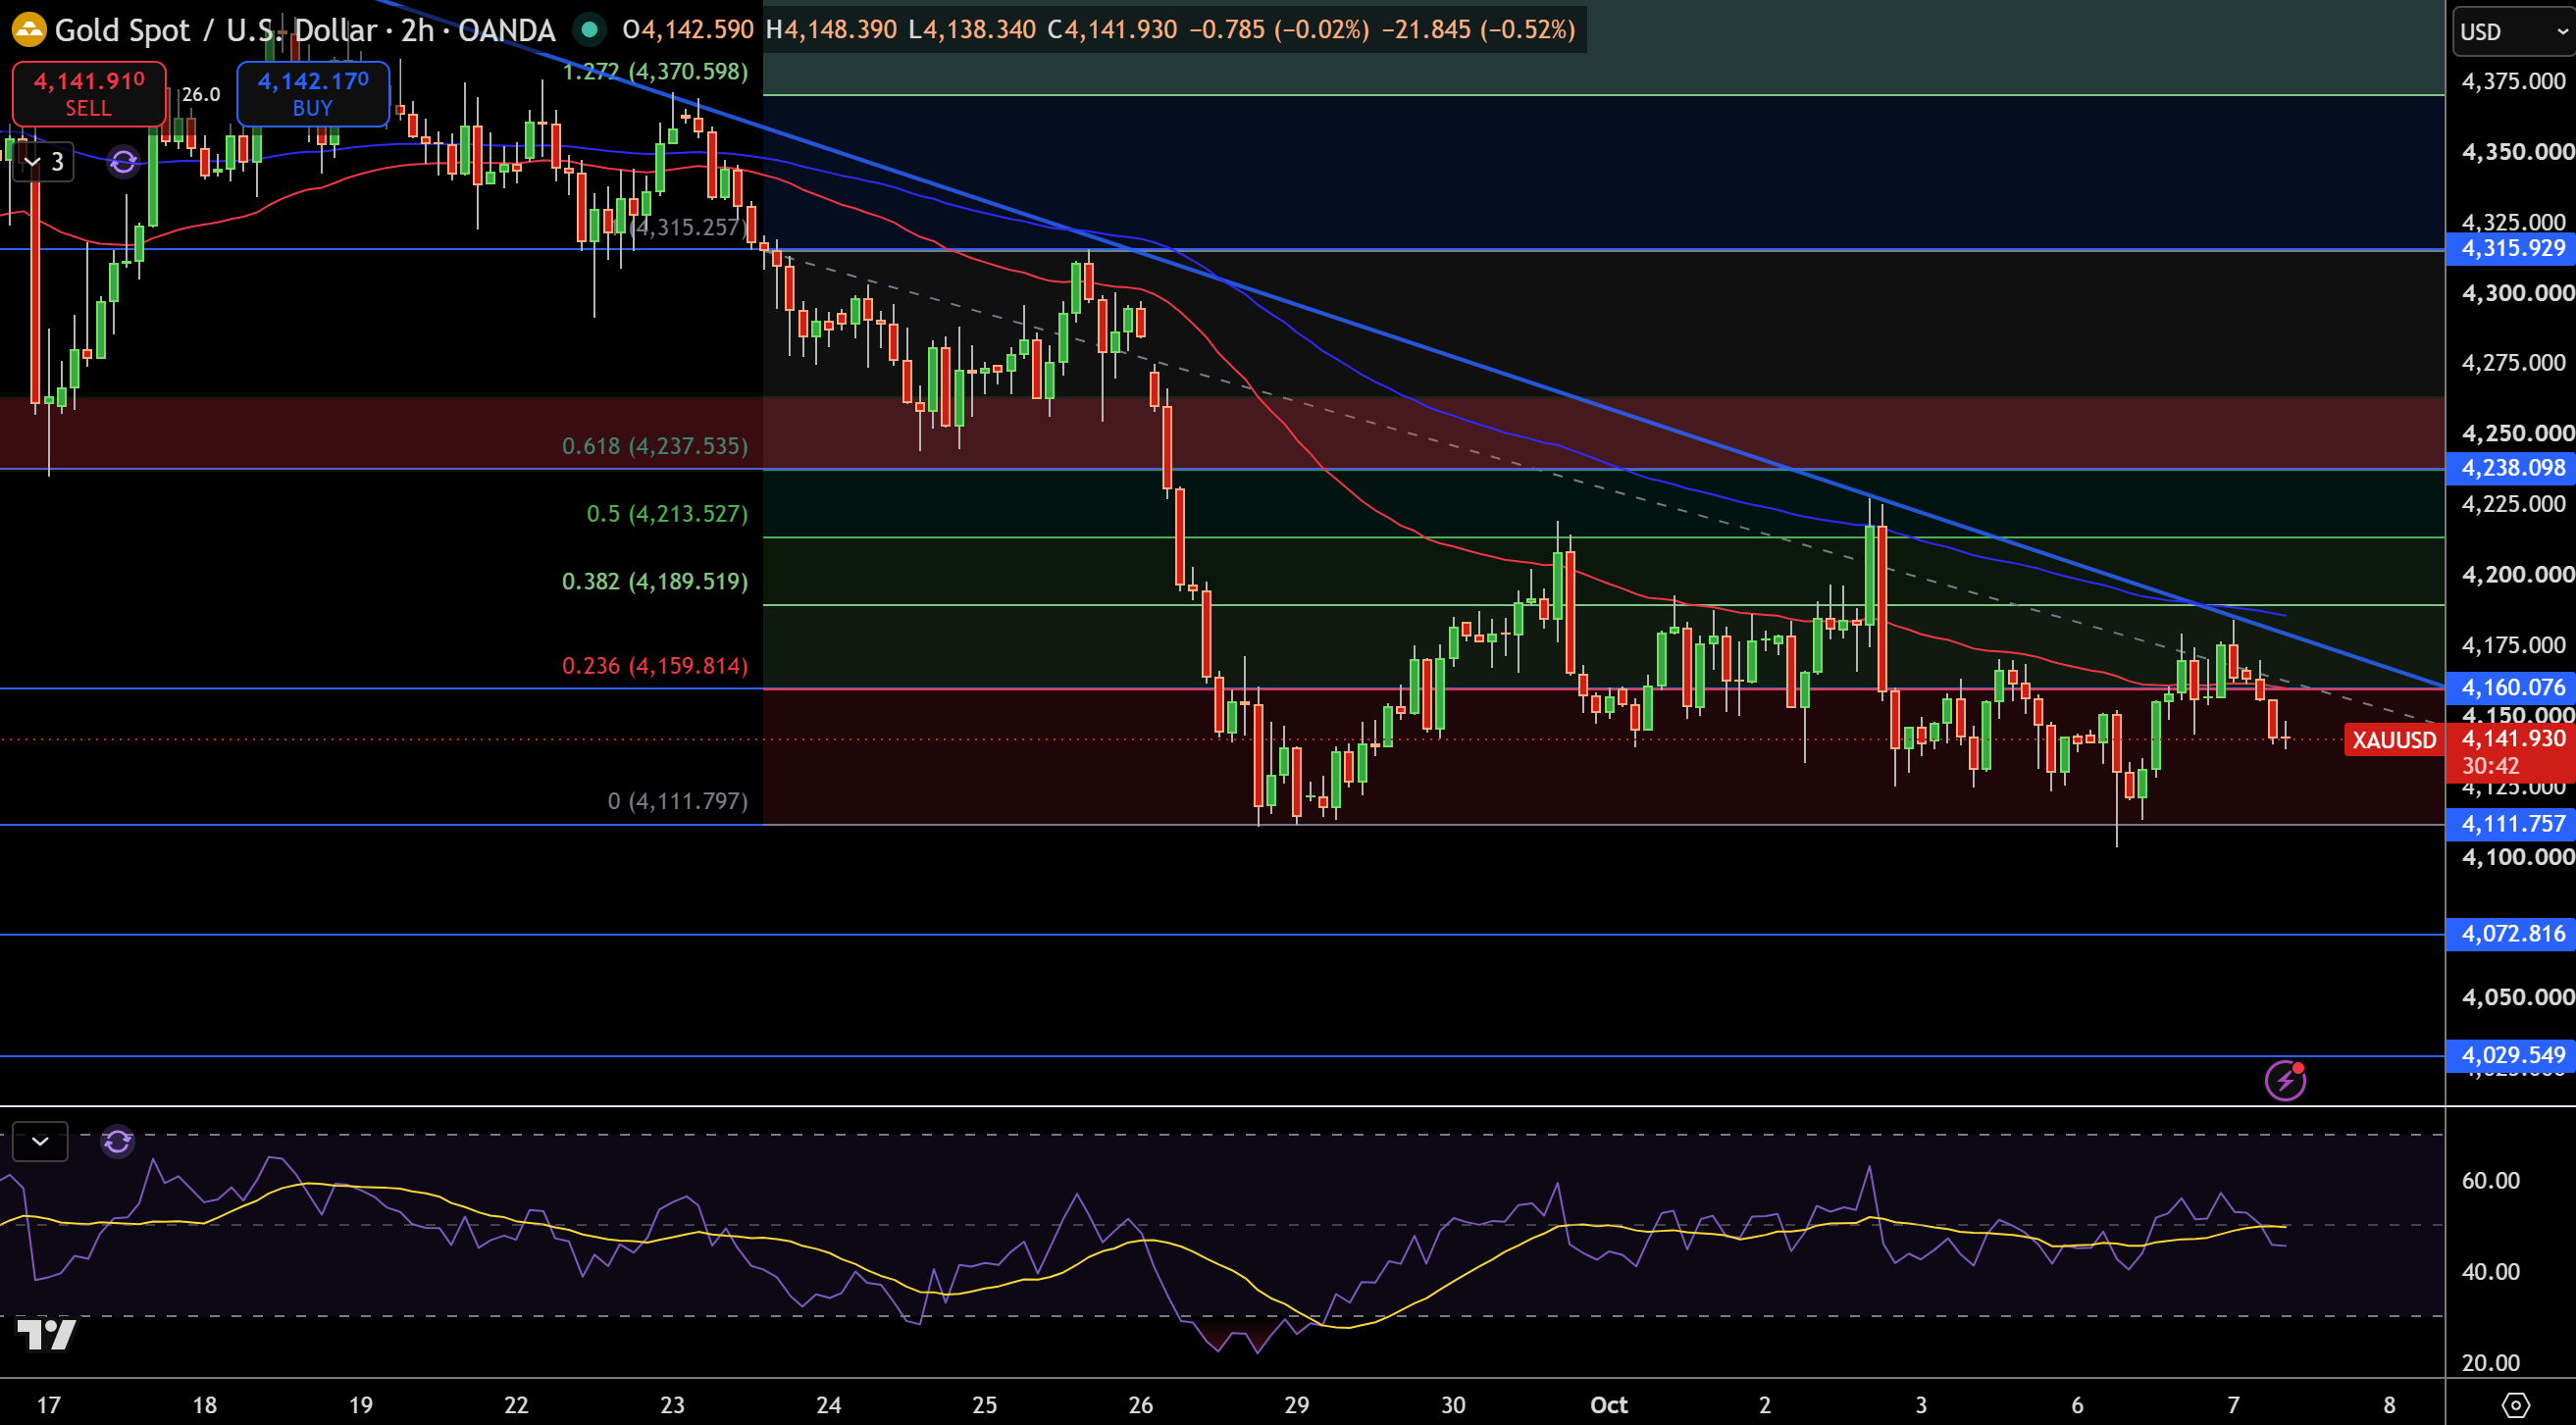
Gold is currently trading at approximately $4,142 on the 2-hour chart and what I find interesting is that the price is still holding above the $4,112 support area after another rejection from the 4,160-4,190 resistance area. The larger trend is still considered bearish as gold is still below both the moving averages and the descending trendline. Recent bounces have produced lower highs.
The first area of resistance I am looking at is $4,160. A clear break above this area would be eye opening and could target the next resistance areas at $4,190 and $4,214 and $4,238. Support would come in at $4,112 first, with $4,073 and $4,030 becoming more significant if sellers regain control.
RSI is also giving a bearish signal as it is still below the 50 center line. A recovery above $4,214 would put more weight behind the bullish case and a break below $4,112 would give a more bearish edge.
Silver Technical Analysis: XAG/USD Stays Below $61.72 as $59.96 Support Remains Critical
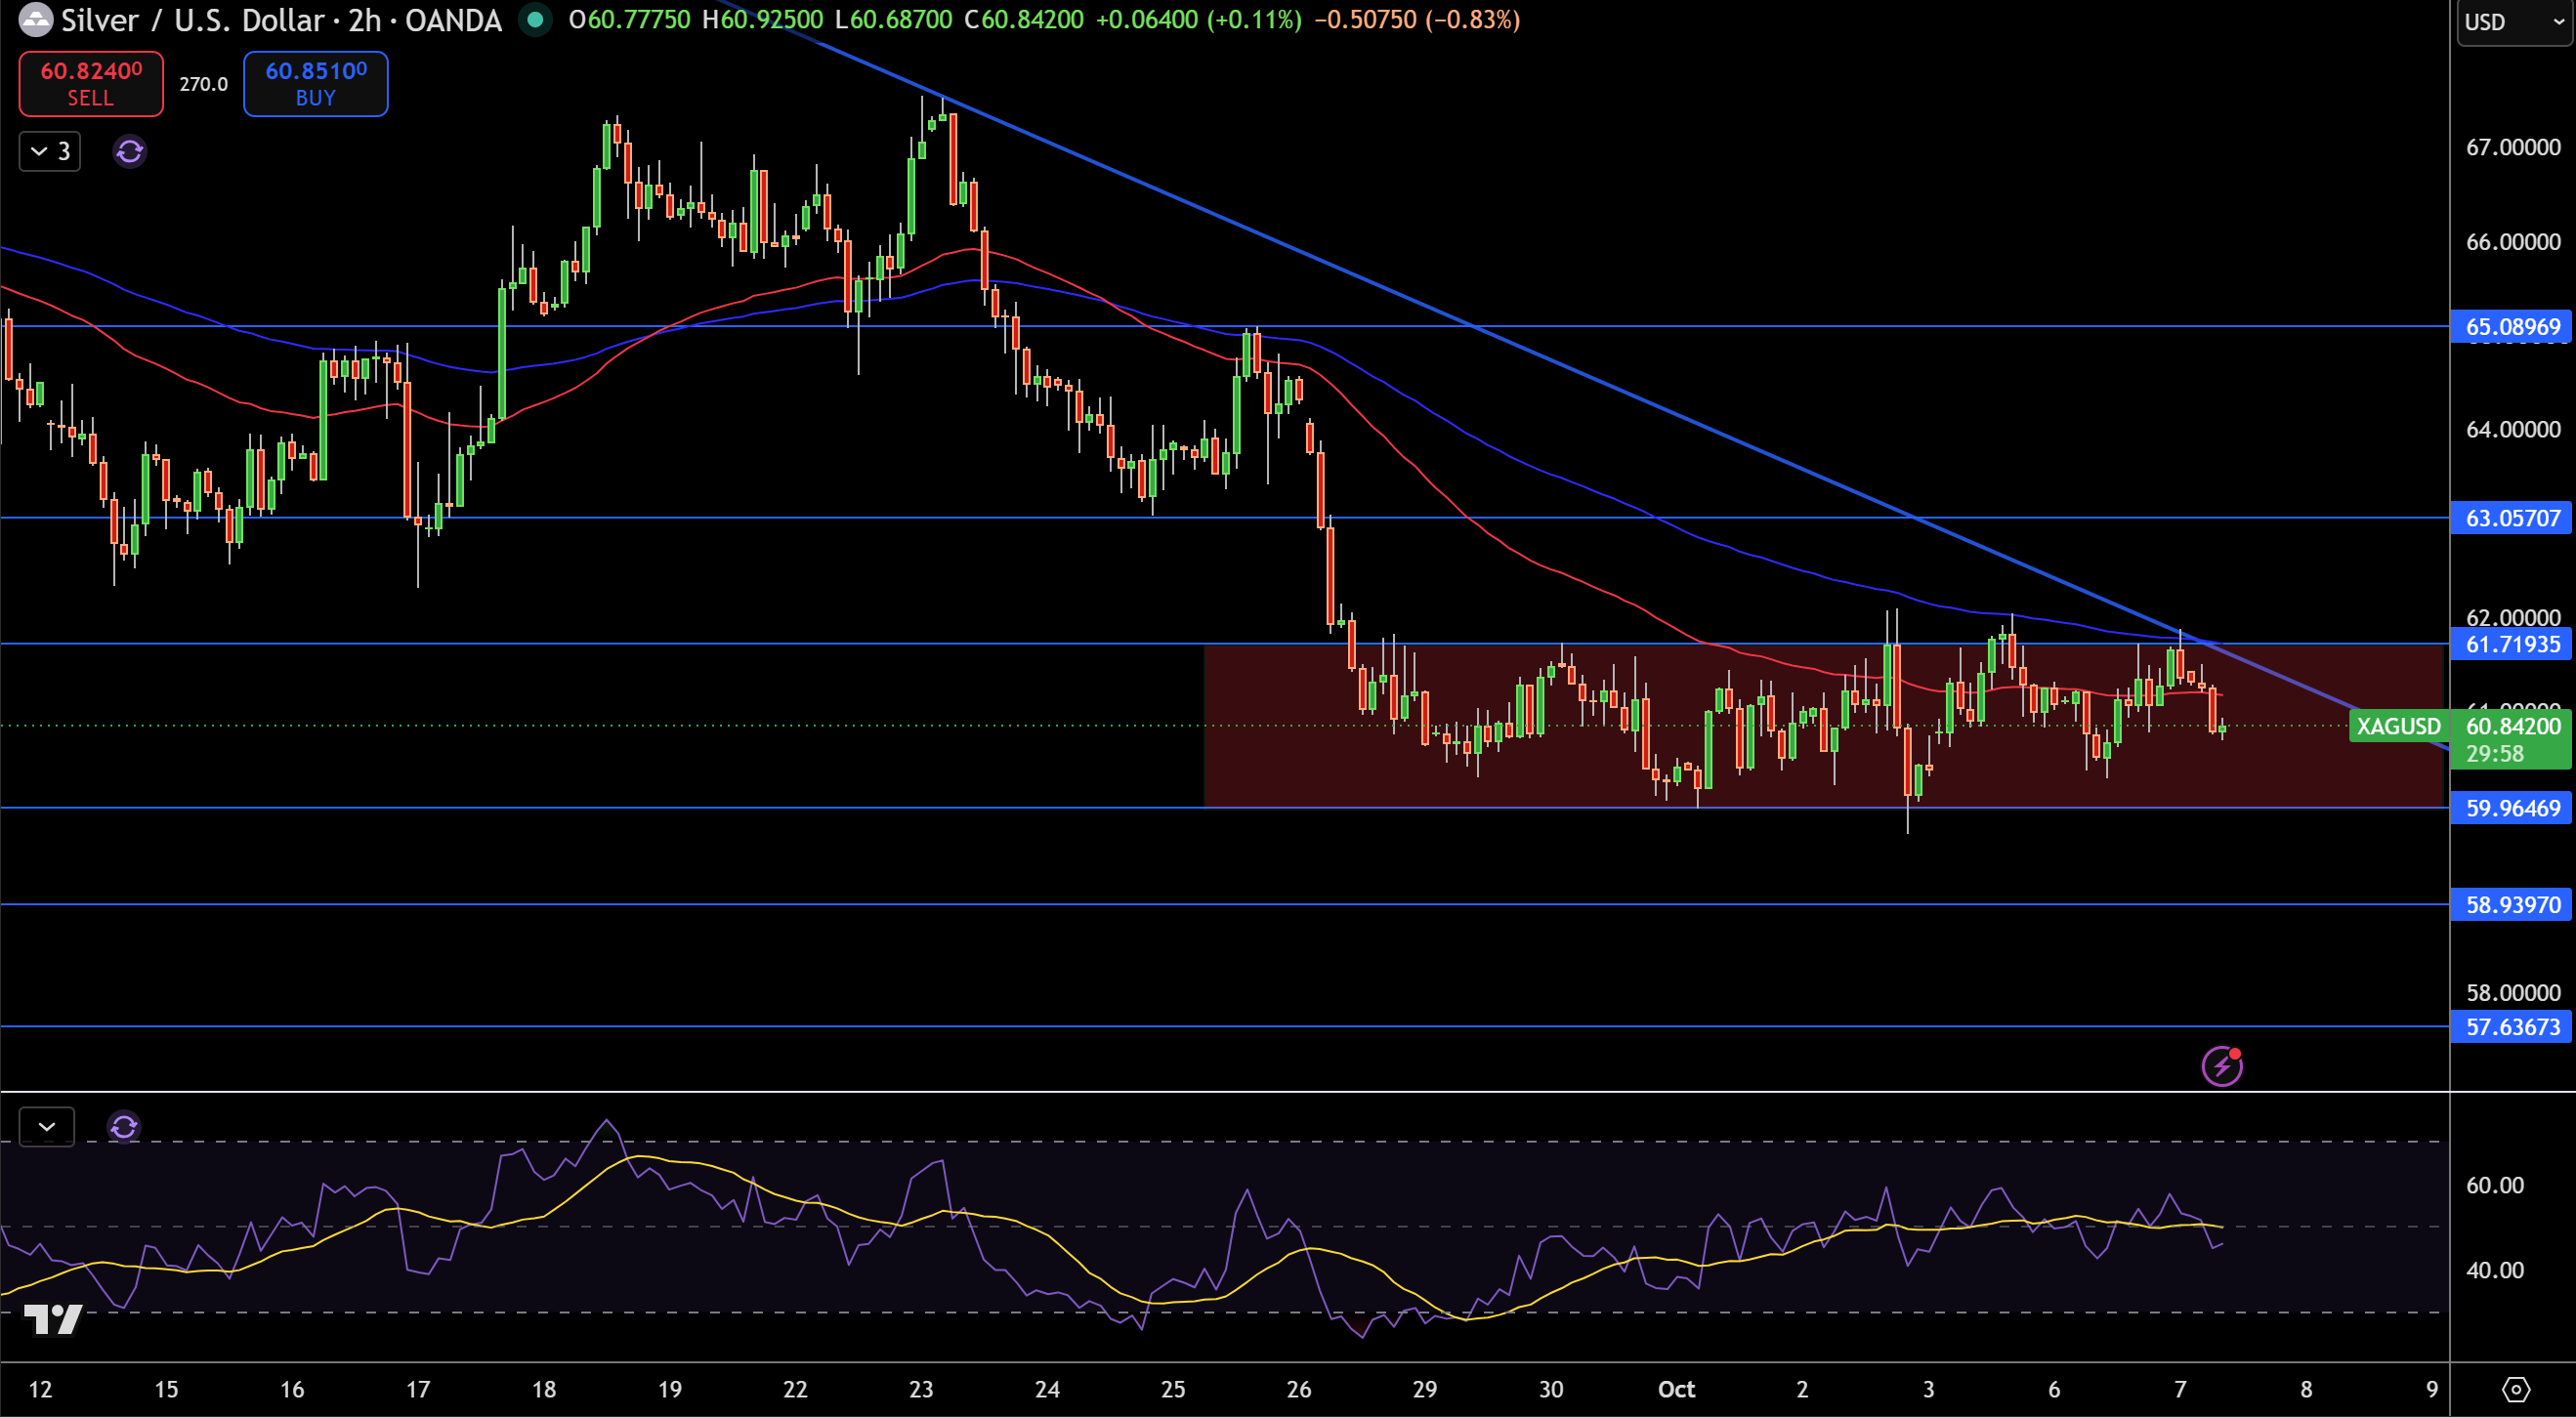
Silver is currently around $60.84 on the 2-hour chart, having recently pulled back from a challenge of the $61.72 resistance area. Right now, price is below the moving averages and a bearish trendline, and also within the lower range of a larger bearish structure.
I’m looking for a break above $61.72 for some initial upside toward $63.06 and $65.09. Support is likely to come in at the $60 area and below it at $59.96, with additional support possible at $58.94 and $57.64.
RSI is in the lower range, and so momentum may be slightly in favor of the sell-side. I’m generally bearish below the $61.72 resistance area and the bearish trendline. A break above $63.06 would change that, and a move below $59.96 would put the focus on $58.94.


