Bullish Reversal Clears Key Hurdles
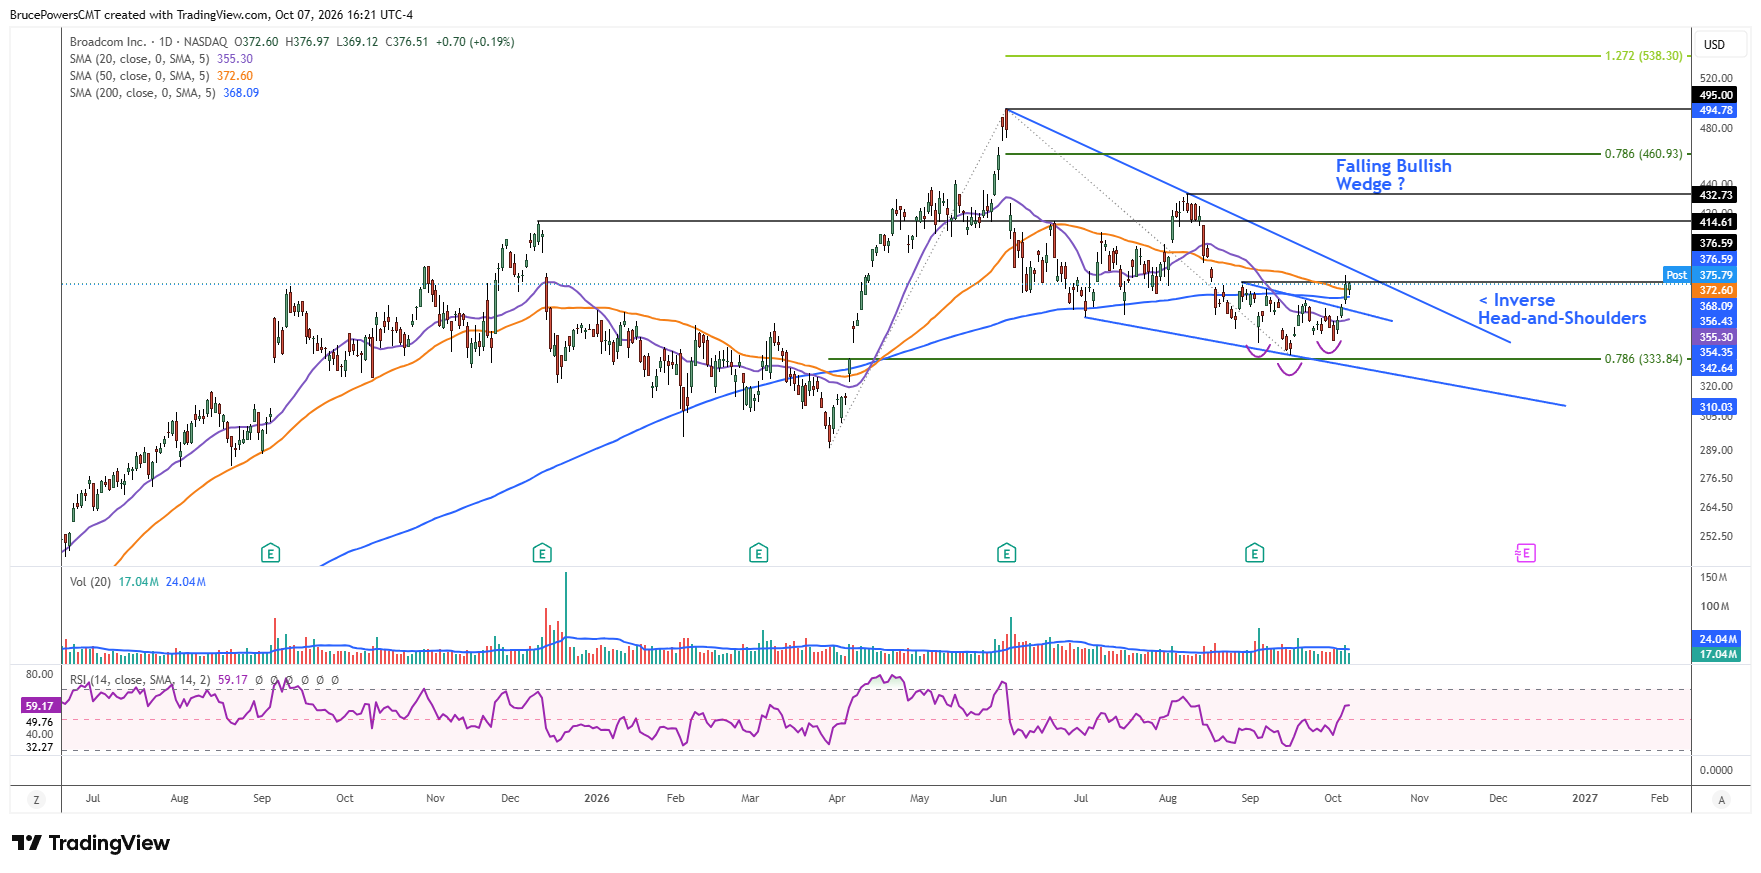
Broadcom Inc. (AVGO), a semiconductor and infrastructure technology company, triggered a bullish reversal signal on Tuesday with a breakout from an inverse head-and-shoulders pattern. Strength was confirmed during the advance by a reclaim of both the 200-day and 50-day moving averages, now near $368.07 and $372.53, respectively, as well as by the recovery of a lower swing high of $376.59.
Resistance was seen at a 33-day high of $380 and the closing price was above both moving averages, confirming their breakouts. But the breakout above the lower swing high at $376.59 has not yet been confirmed by a daily close above that level.
78.6% Retracement Marks Potential Turning Point
The breakout of a classic bottoming pattern occurred near the completion of a 78.6% Fibonacci retracement, typically a maximum retracement anticipated in Fibonacci analysis before a recovery becomes less likely. Since the 200-day moving average was indicated as both support and then resistance over several months recently, its recovery is significant and suggests a continued bias to the upside.
Wedge Breakout Becomes Next Catalyst
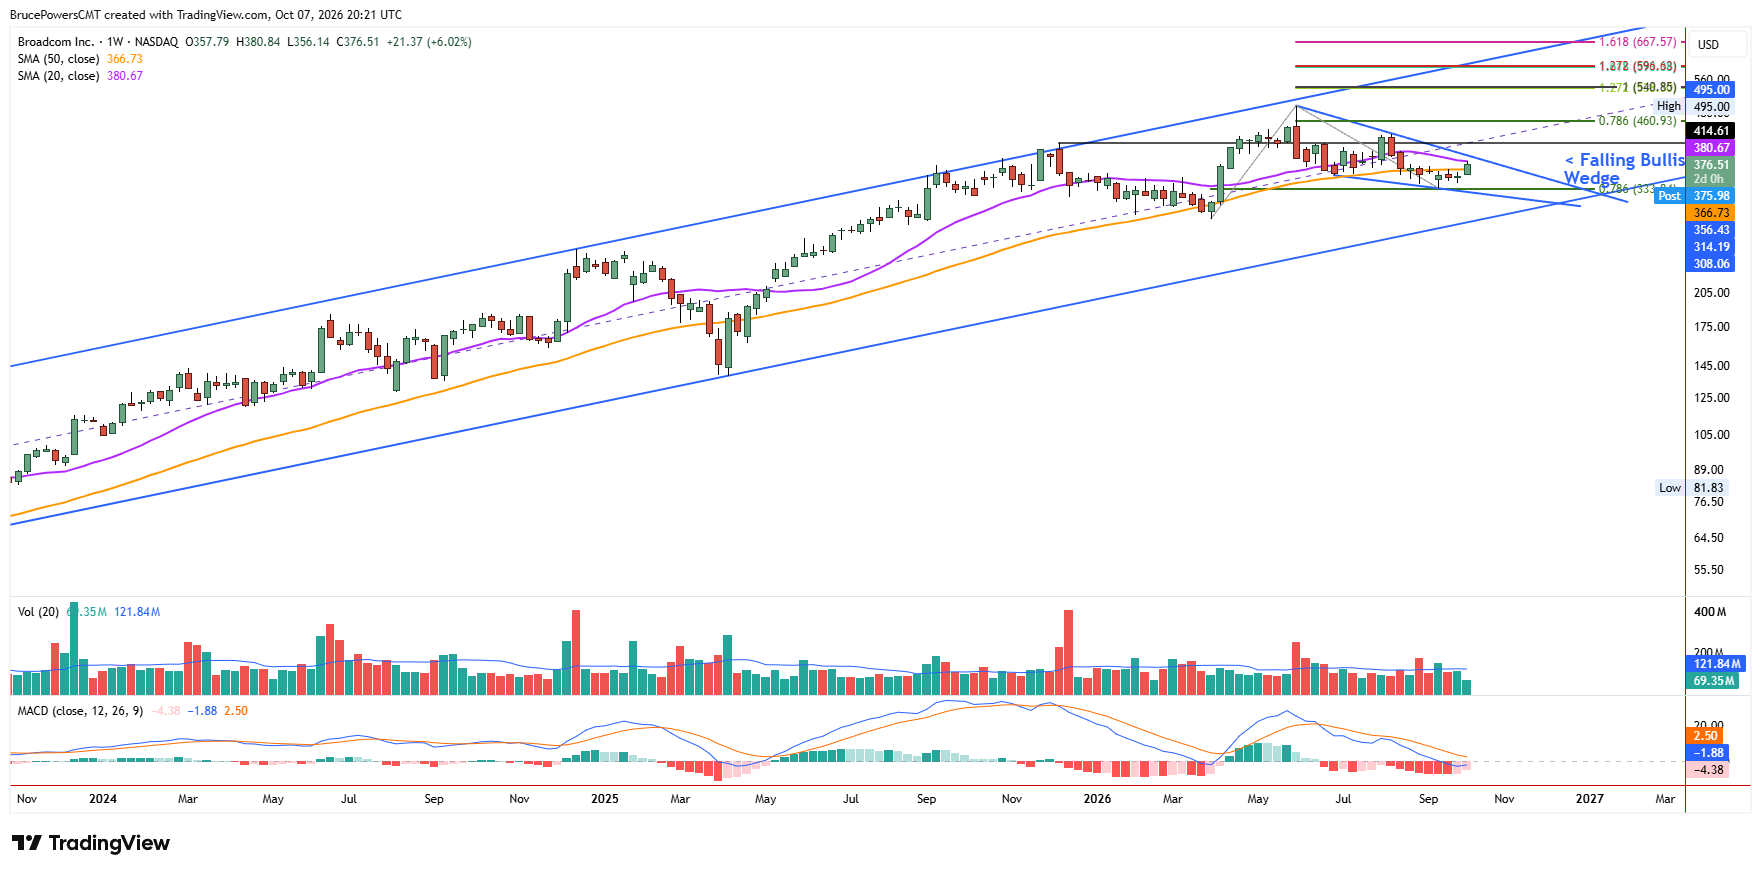
AVGO is still early in its potential recovery. The inverse head-and-shoulders bottoming formation sits inside a larger falling bullish wedge pattern that has not yet confirmed. Bullish momentum generated by the bottom breakout could be enough to trigger an initial breakout above the downtrend line marking the upper boundary of the wedge. Tuesday’s high of $380.84 therefore takes on greater significance since an advance above it will also likely signal a break above the downtrend line and therefore wedge pattern.
Recovery Targets Extend Toward $594
An initial upside target is indicated by the lower swing high of $432.73 from August. However, a typical target objective from the wedge pattern is its beginning, which is at the June peak of $495. The progression of the bullish trend also suggests that the June peak could be challenged or exceeded. New high potential targets are indicated by the confluence of a couple Fibonacci extension and projection levels. The two areas that stand out are around $540.85 and $594.
If you’d like to know more about technical analysis and how traders use it, please visit our educational area.