


Support Holds Despite Bearish Pressure
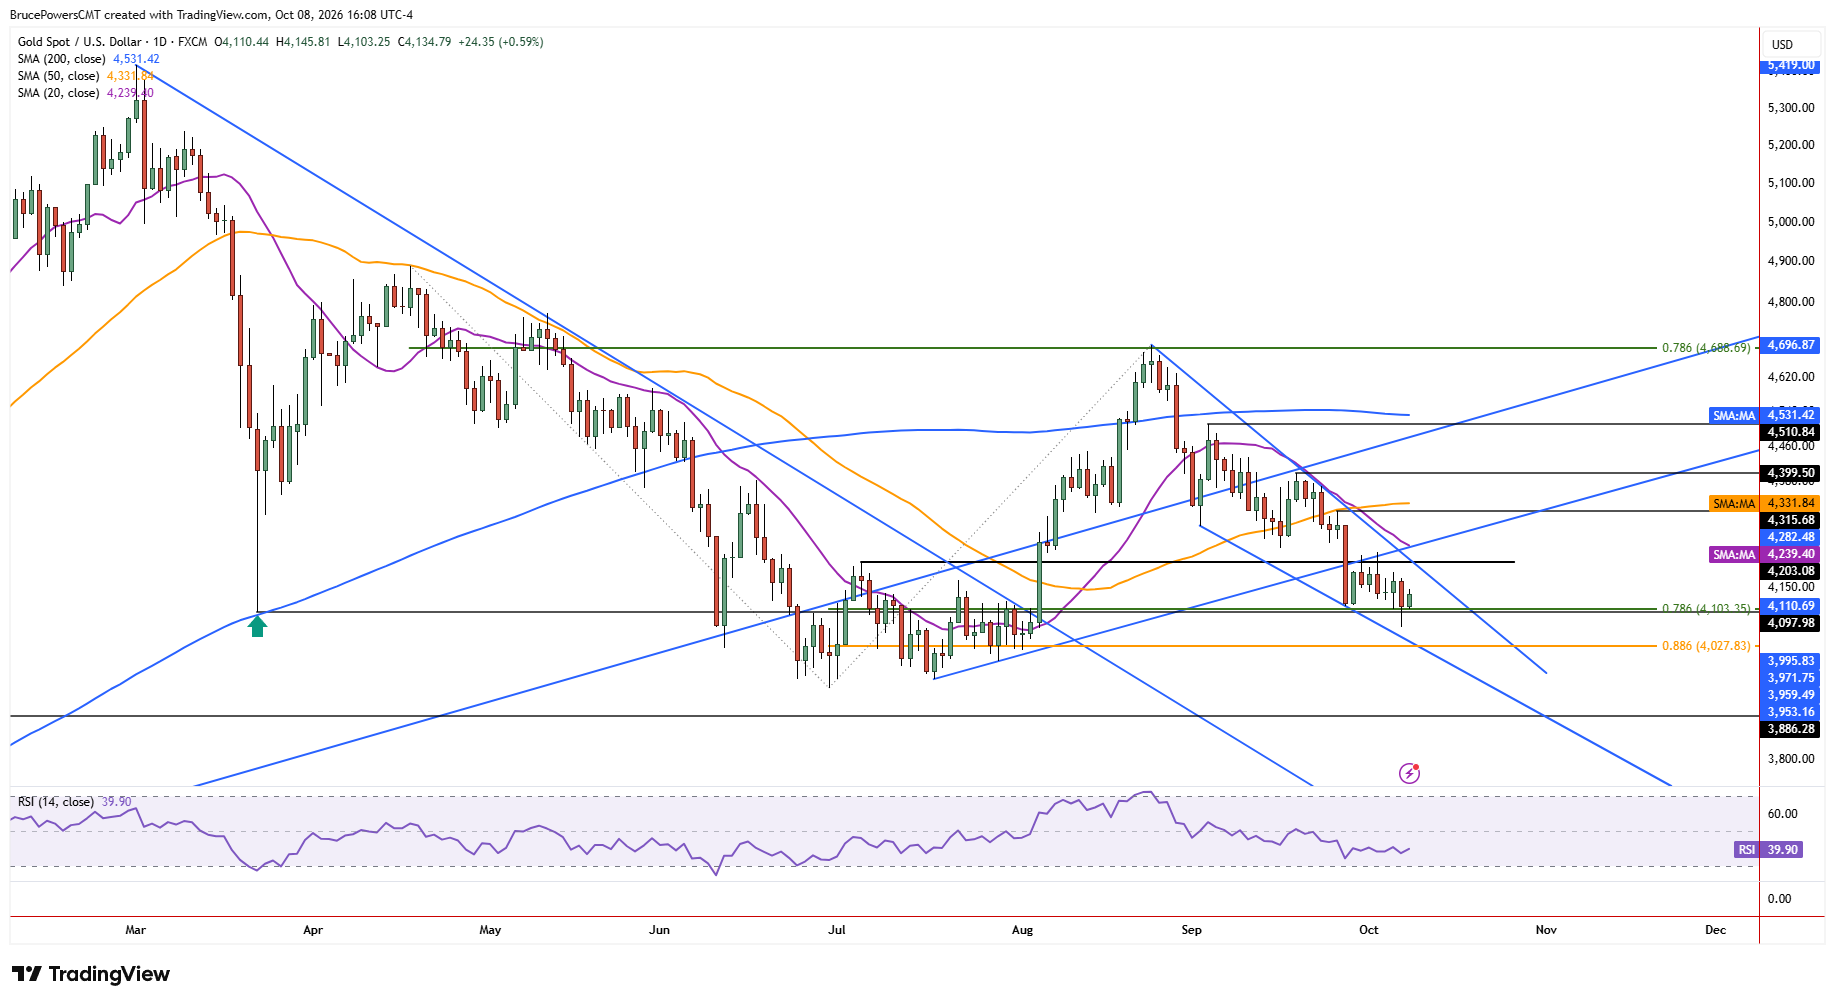
Despite gold reaching a new corrective low $4,066 on Wednesday, it traded above a key support level during Thursday’s session, defined by the 78.6% Fibonacci retracement level at $4,103. That level also remained support relative to Wednesday’s closing price of $4,110. This shows a failure to confirm the bearish trend extension that triggered Wednesday. Although this is a short-term indication, it suggests that support could continue to hold. Therefore, another decisive break below it could lead to a decline to the next lower potential target area, which is near the 88.6% Fibonacci retracement level at $4,028.

Repeated Tests Raise Stakes at $4,103
For nine days gold has been hovering around the 78.6% Fibonacci retracement of the prior full advance at $4,103. Notably, support was seen on Tuesday right at the 78.6% level, the day before a break below that support level occurred. These multiple tests increase the potential significance of the support level as a key short-term pivot level. It is also important to remember that the 78.6% is reinforced by a bottom consolidation zone that resulted in a sharp advance in August. There is also the spike low of $4,098 from March, which matched a test of support at the 200-day moving average.
Double Bottom or Deeper Correction?
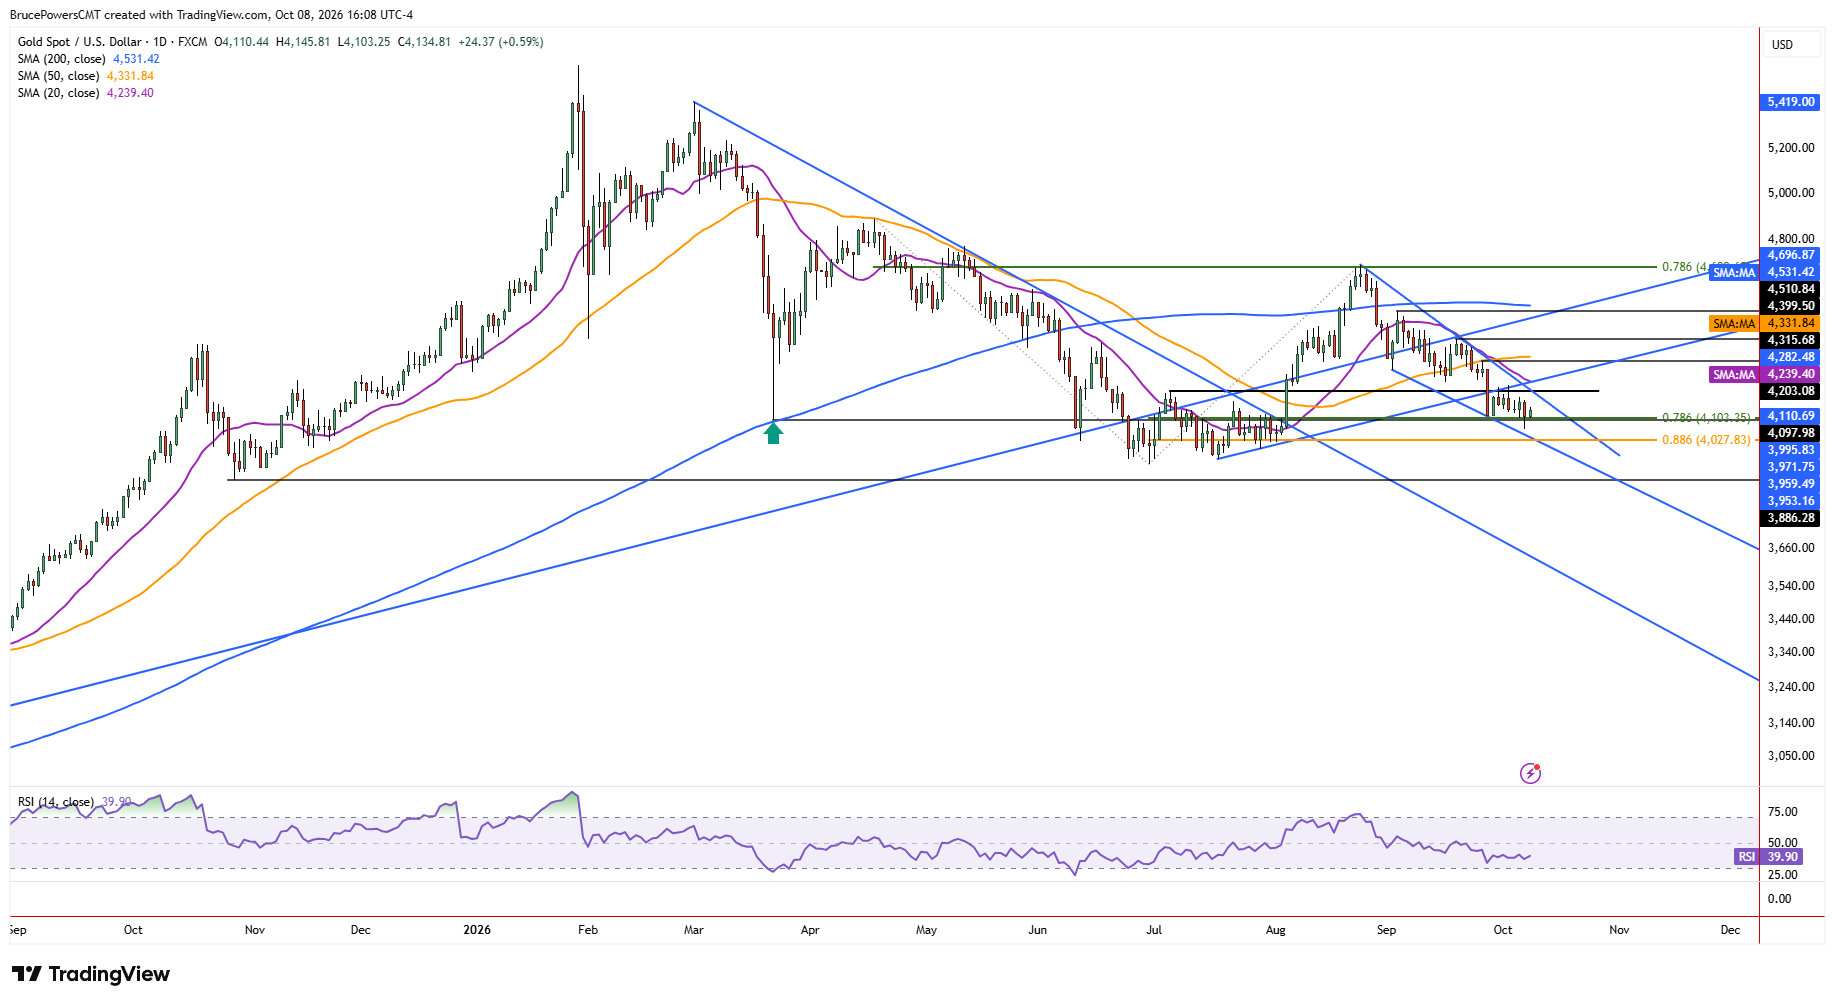
The larger pattern that may be unfolding in gold can be viewed technically from either a bullish or bearish perspective. Either the current decline eventually triggers a continuation of the large bearish correction, or a second bottom that leads to a second sharp advance from the July lows. If gold rallies decisively above the minor lower swing high of $4,226 from last Friday and it is followed by signs of strength, then the first pullback following the bullish reversal breakout from a bottom formation in early-August may be complete.
Falling Wedge Offers a Bullish Trigger
An advance above $4,226 would also trigger the breakout of a falling bullish wedge pattern that has formed during the current decline. A breakout of the wedge could be followed by a momentum spike. During its formation showing a downward sloping consolidation pattern that may eventually lead to the exhaustion of sellers. The wedge pattern is only a possibility unless it triggers.
If you’d like to know more about how to trade gold and silver, please visit our educational area.



