
USOIL: Inventory Draw Meets Hurricane-Driven Supply Disruption
US crude oil fundamentals became slightly tighter after the EIA reported a draw of 3.2 million barrels in commercial inventories for the week ended October 2. This draw surprised the market, which had expected an additional build. Refinery crude inputs rose to 16.48 million barrels a day, while refinery utilization rose to 92.7%. Crude oil exports rose by about 1.2 million barrels per day to 4.77 million bpd.
Risk to supply rose Thursday as Hurricane Isaias forced operators in the Gulf of Mexico to shut-in about 25.08% of the region’s production. Other producers, like Shell and Chevron, also shut-in production in the region.

UKOil: Hormuz Traffic Slumps as Tanker Attacks Escalate
A sustained increase in tanker attacks around the Strait of Hormuz raised concerns that there will be a further constriction in the Hormuz Strait in the coming weeks. Several reported attacks have increased uncertainty in the oil markets. With the attacks continuing and possible further disruptions in supply, there is a sustained risk to prices.
Brent fundamentals are still heavily reliant on Middle East logistics. Recent crude oil flows through the Strait of Hormuz have fallen by 27% to around 10.1 million bpd, which is about 74% of pre-war levels. Recently, tanker traffic has fallen to its lowest level in more than two months. The Gulf of Oman and the Red Sea have seen an increase in alternative exports of around 6.7 million bpd, helping to offset the disruption.
The key vulnerability remains security: between September 28 and October 5, at least 12 tanker attacks, attempts or harassment incidents occurred, which is the highest weekly total since the start of the Iran conflict.
Natural Gas: Hurricane Outages Tighten an Otherwise Comfortable Market
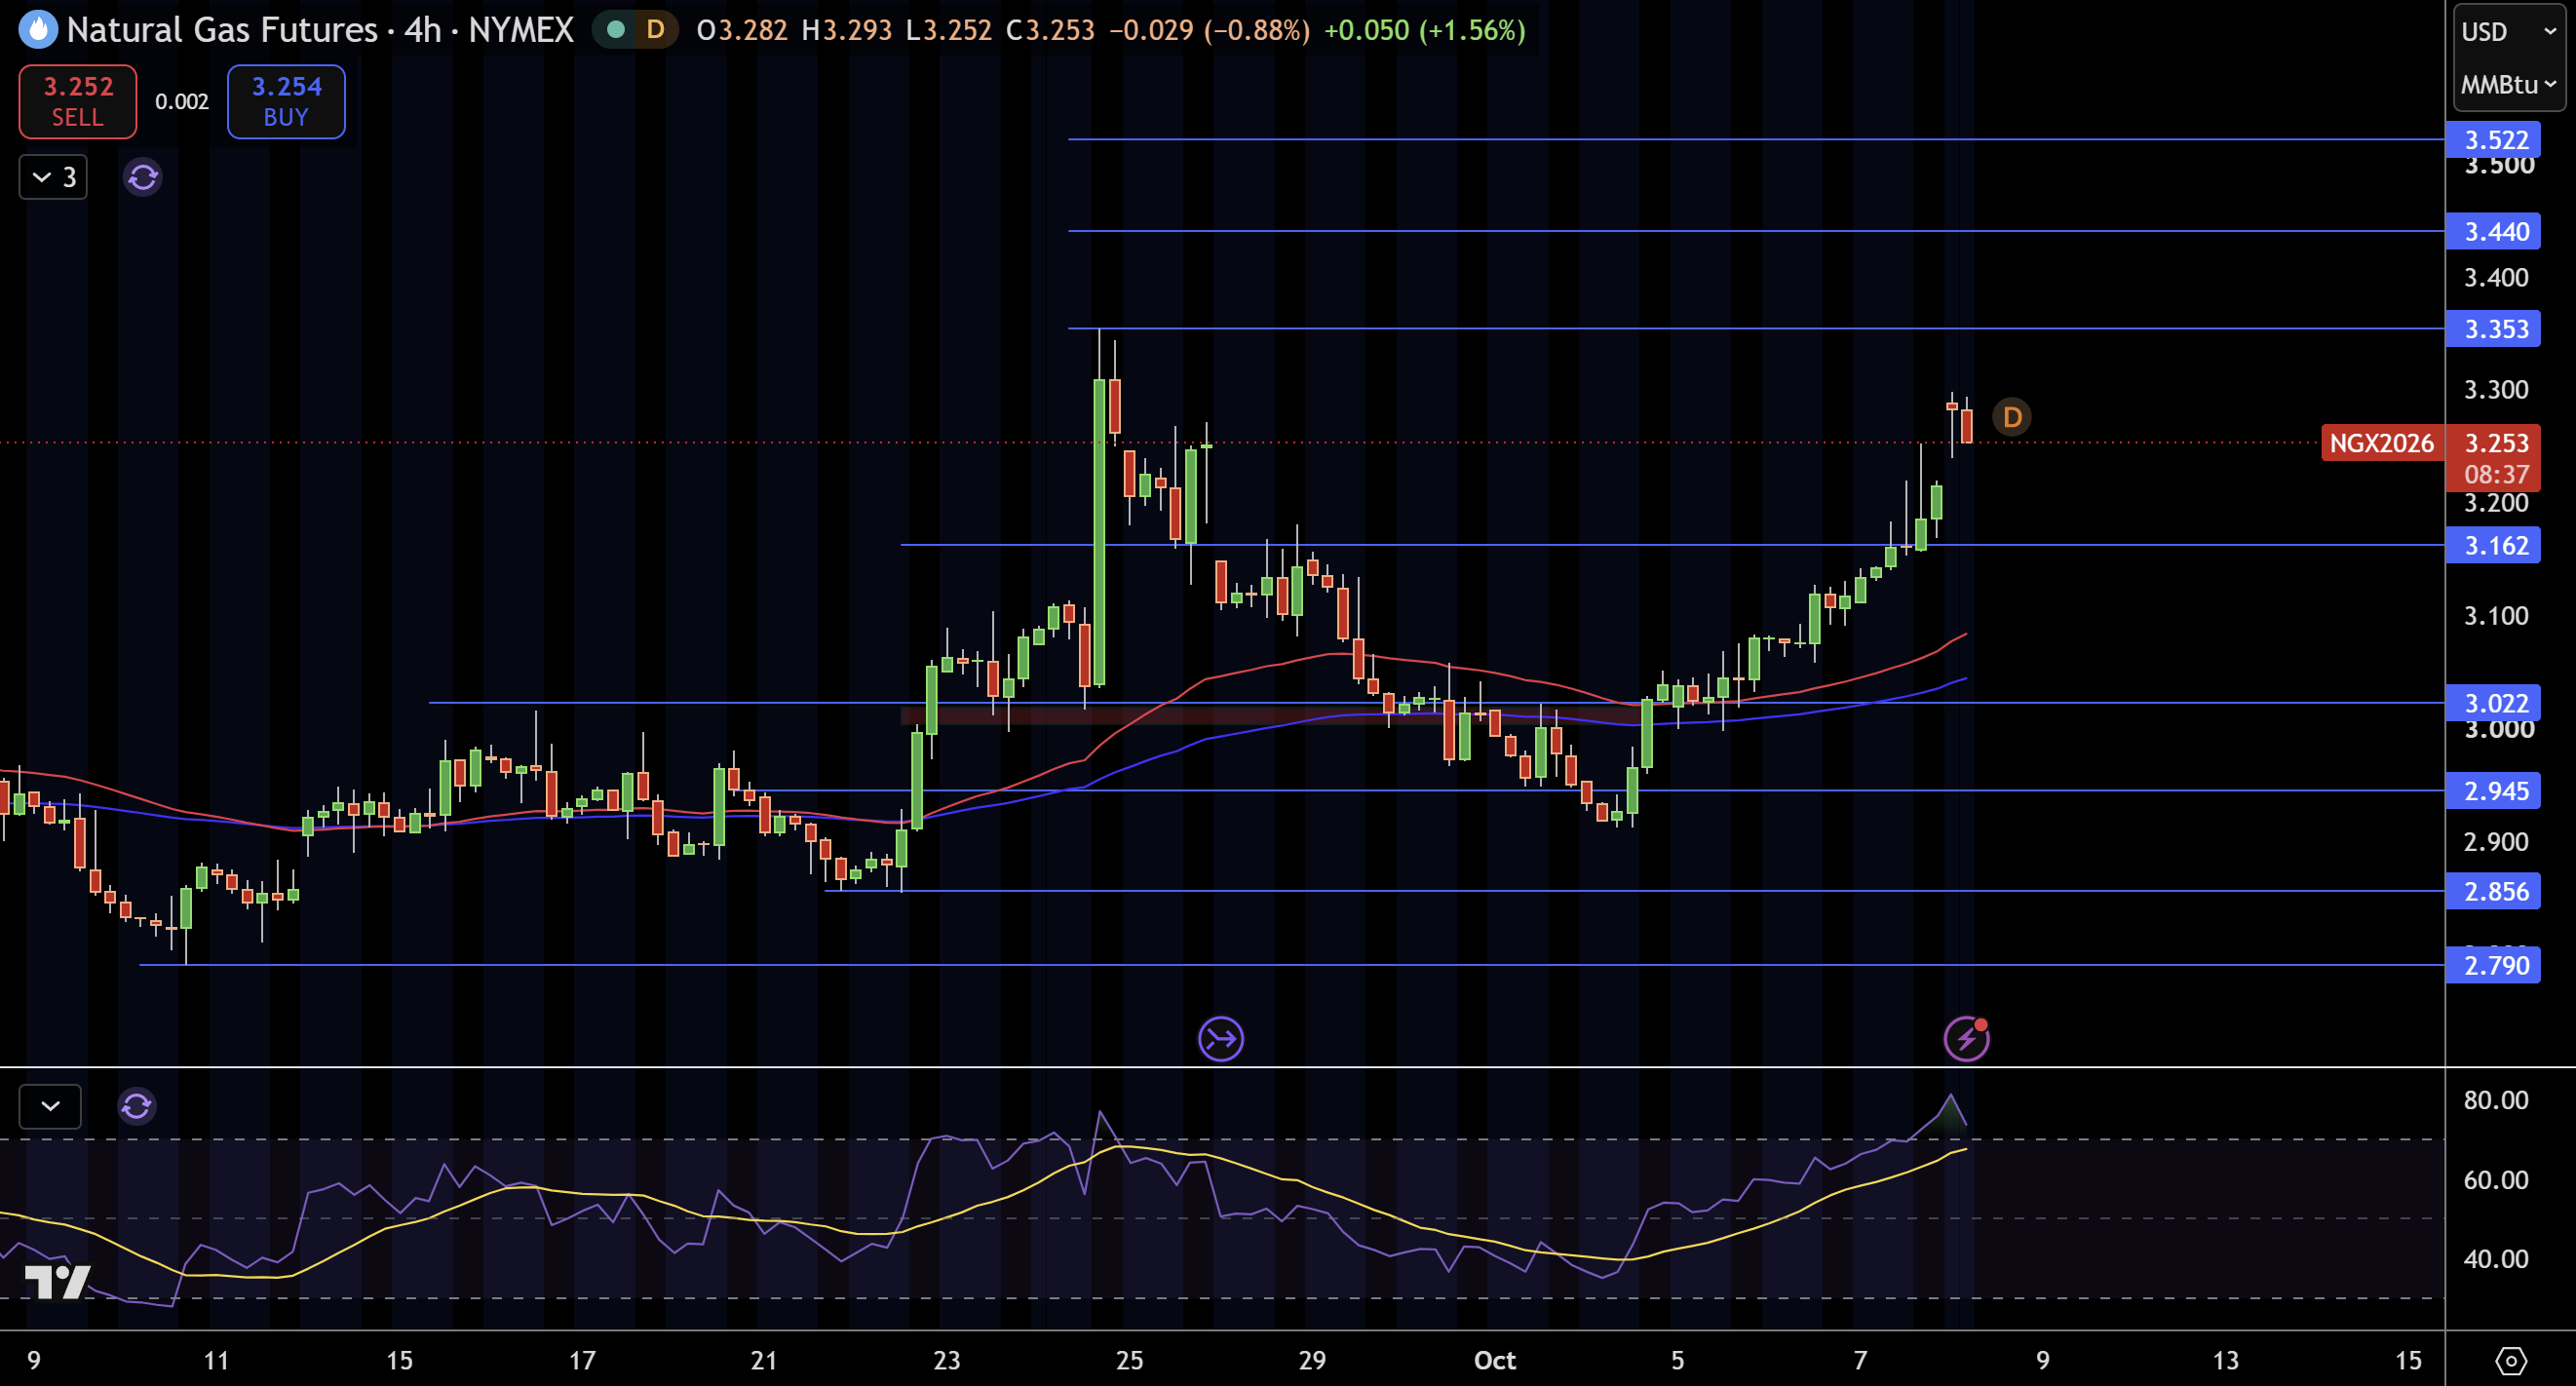
Isaias will have a temporary supply shock effect on the natural gas market, with about 16.37% of Gulf of Mexico natural gas production shut-in.
Natural Gas Price Forecast
Every new Natural Gas analysis as it publishes, today's technical signal and key levels, live price — on one page.
See all Natural Gas forecastsAccording to the EIA’s latest report, working gas in the lower 48 was 3,415 billion cubic feet as of September 25. In addition, European LNG demand is expected to stay firm heading into the winter. This means strong U.S. LNG exports are expected, despite strong domestic production.
WTI Crude Oil Technical Analysis: USOIL Tests $90.62 as Descending Trendline Caps the Recovery
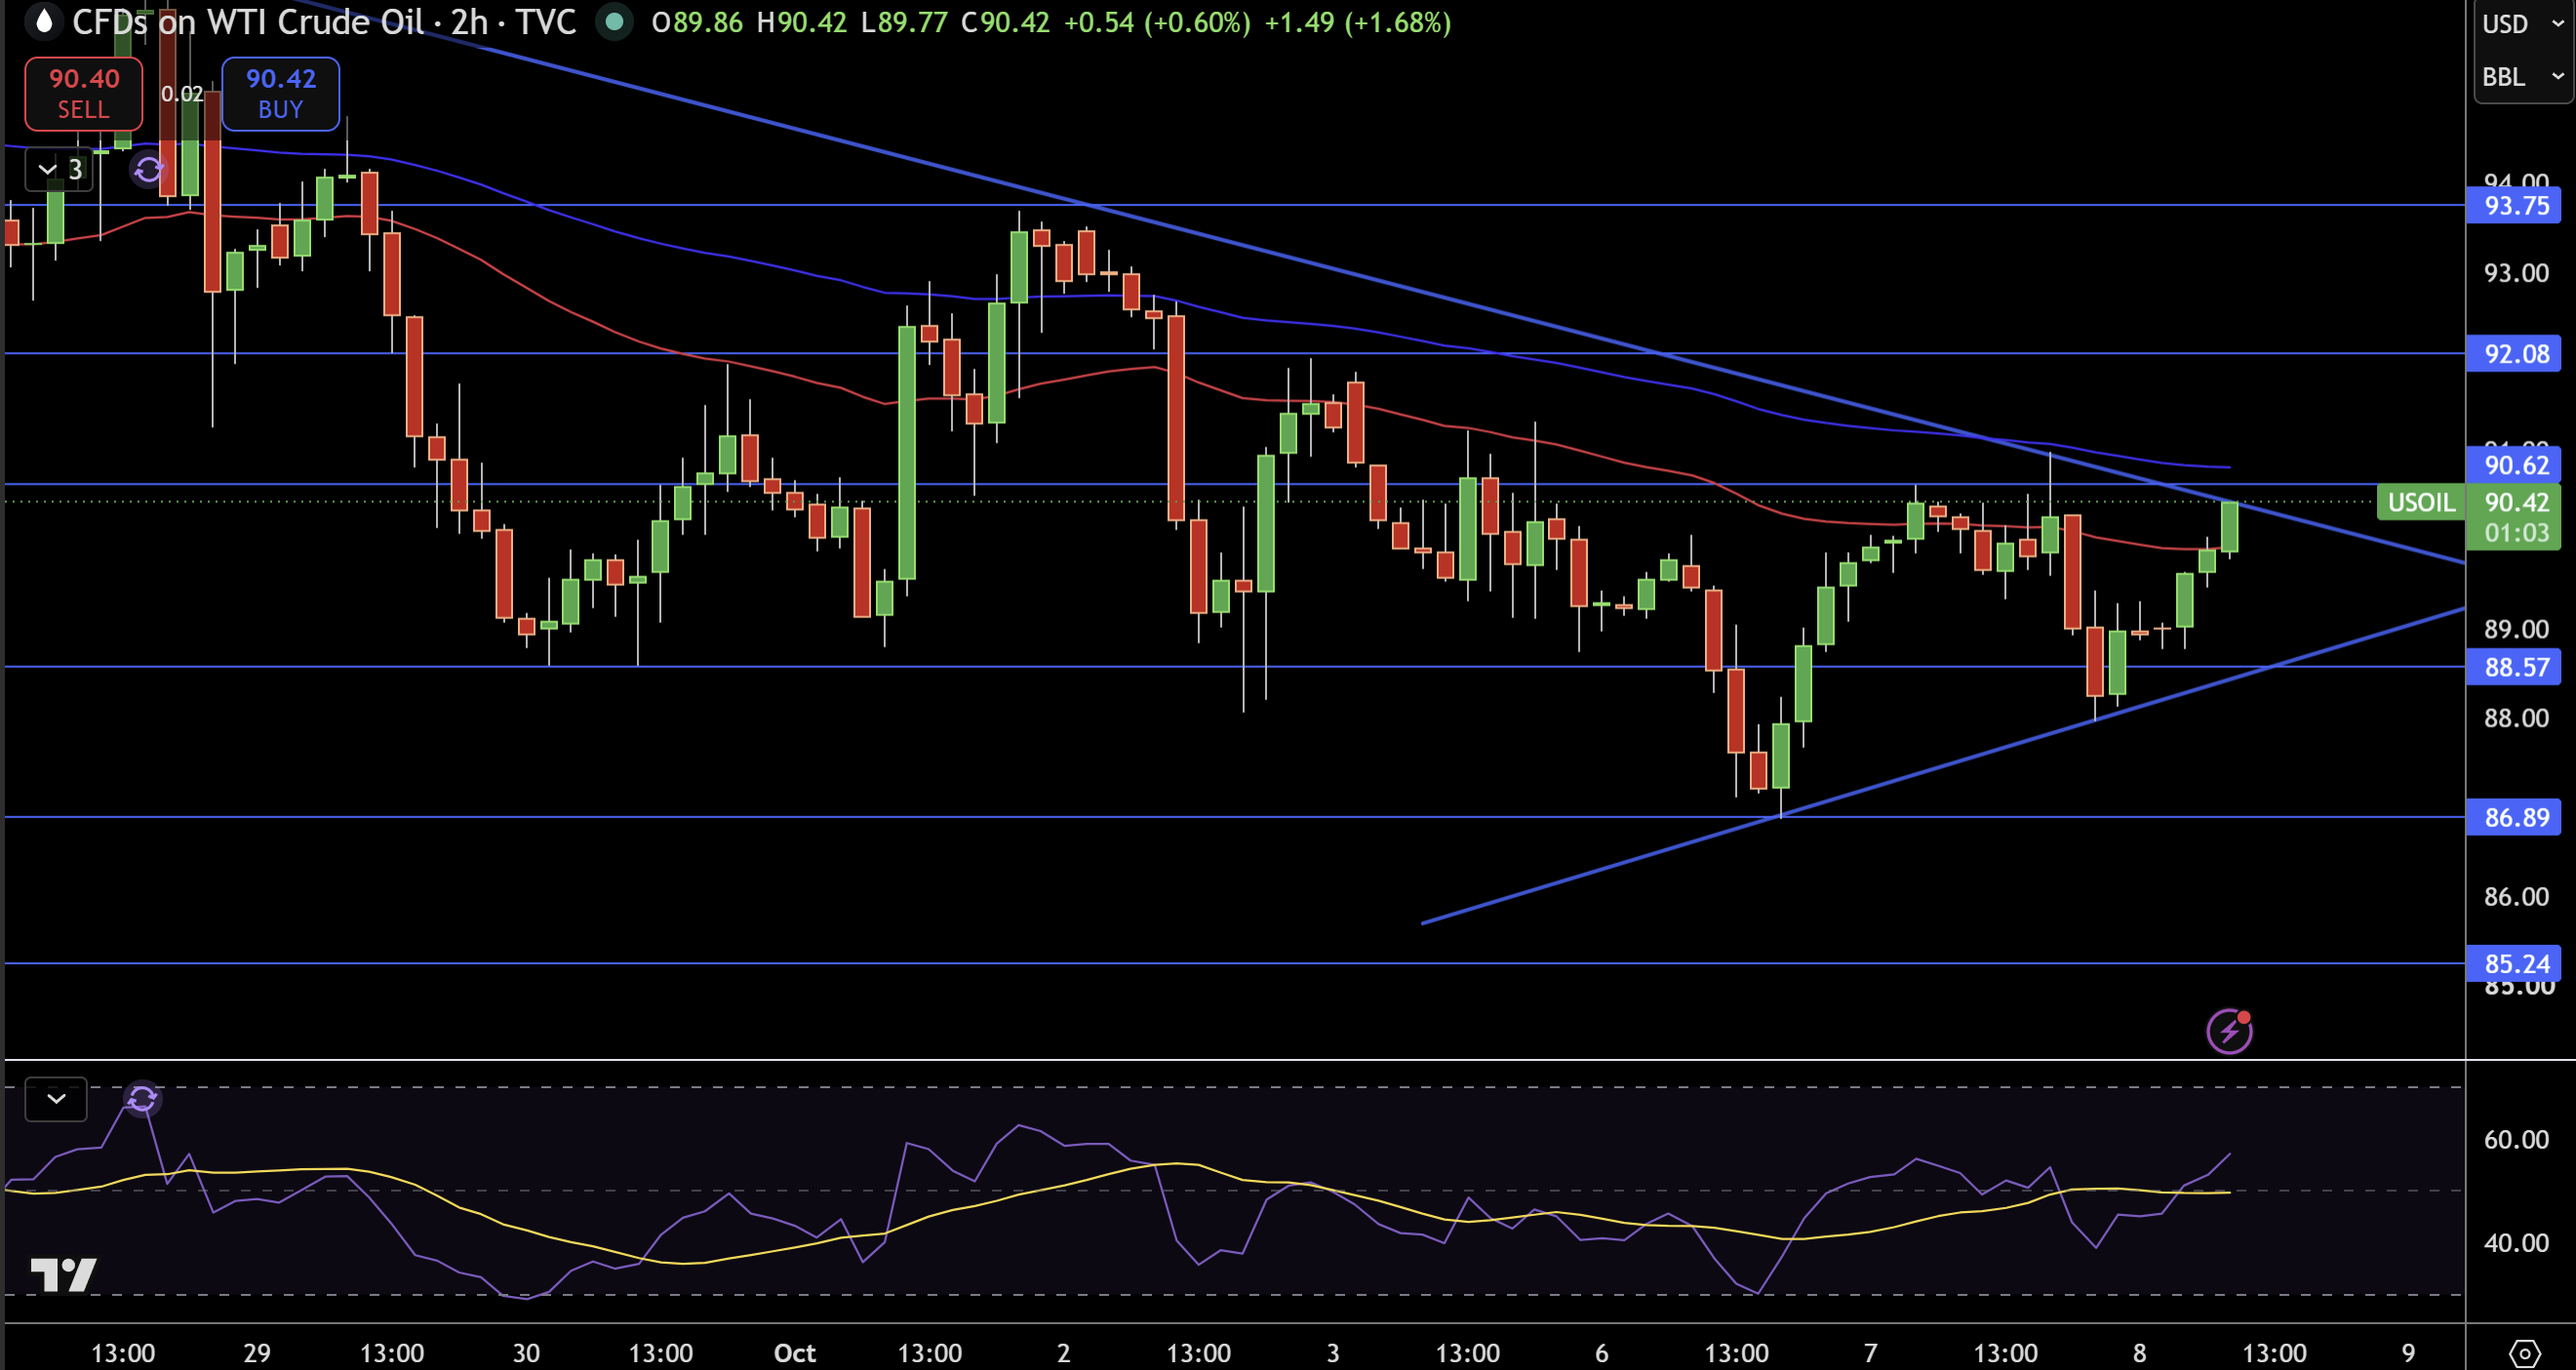
WTI crude oil is trading at around $90.42 on the 2 hour chart and what attracts my attention is the sharp rebound from the support at $86.89 and the recent push to the resistance formed by the descending trendline and the short term moving averages. While the recovery looks positive, the presence of the longer term moving averages and the trendline above indicate the overall bias remains negative.
Looking at the resistance, the first level I see is at $90.62. A break above that would bring the next resistance at $92.08 and the final resistance at $93.75 into play. From a support perspective, the first level to consider is $88.57. This is followed by the support area at $86.89 and $85.24.
As RSI is moving into the overbought area, I think the outlook for WTI is slightly positive. As long as the support at $88.57 holds, I will maintain the slightly positive view and look for a break of the moving averages and the descending trendline. A break of $92.08 would shift my bias more positive and $88.57 would come back into play on the support side. A move below $86.89 would negate the slightly positive view and bring a bearish bias back into play.
Brent Crude Oil Technical Analysis: UKOIL Presses $103.89 as Buyers Challenge Channel Resistance
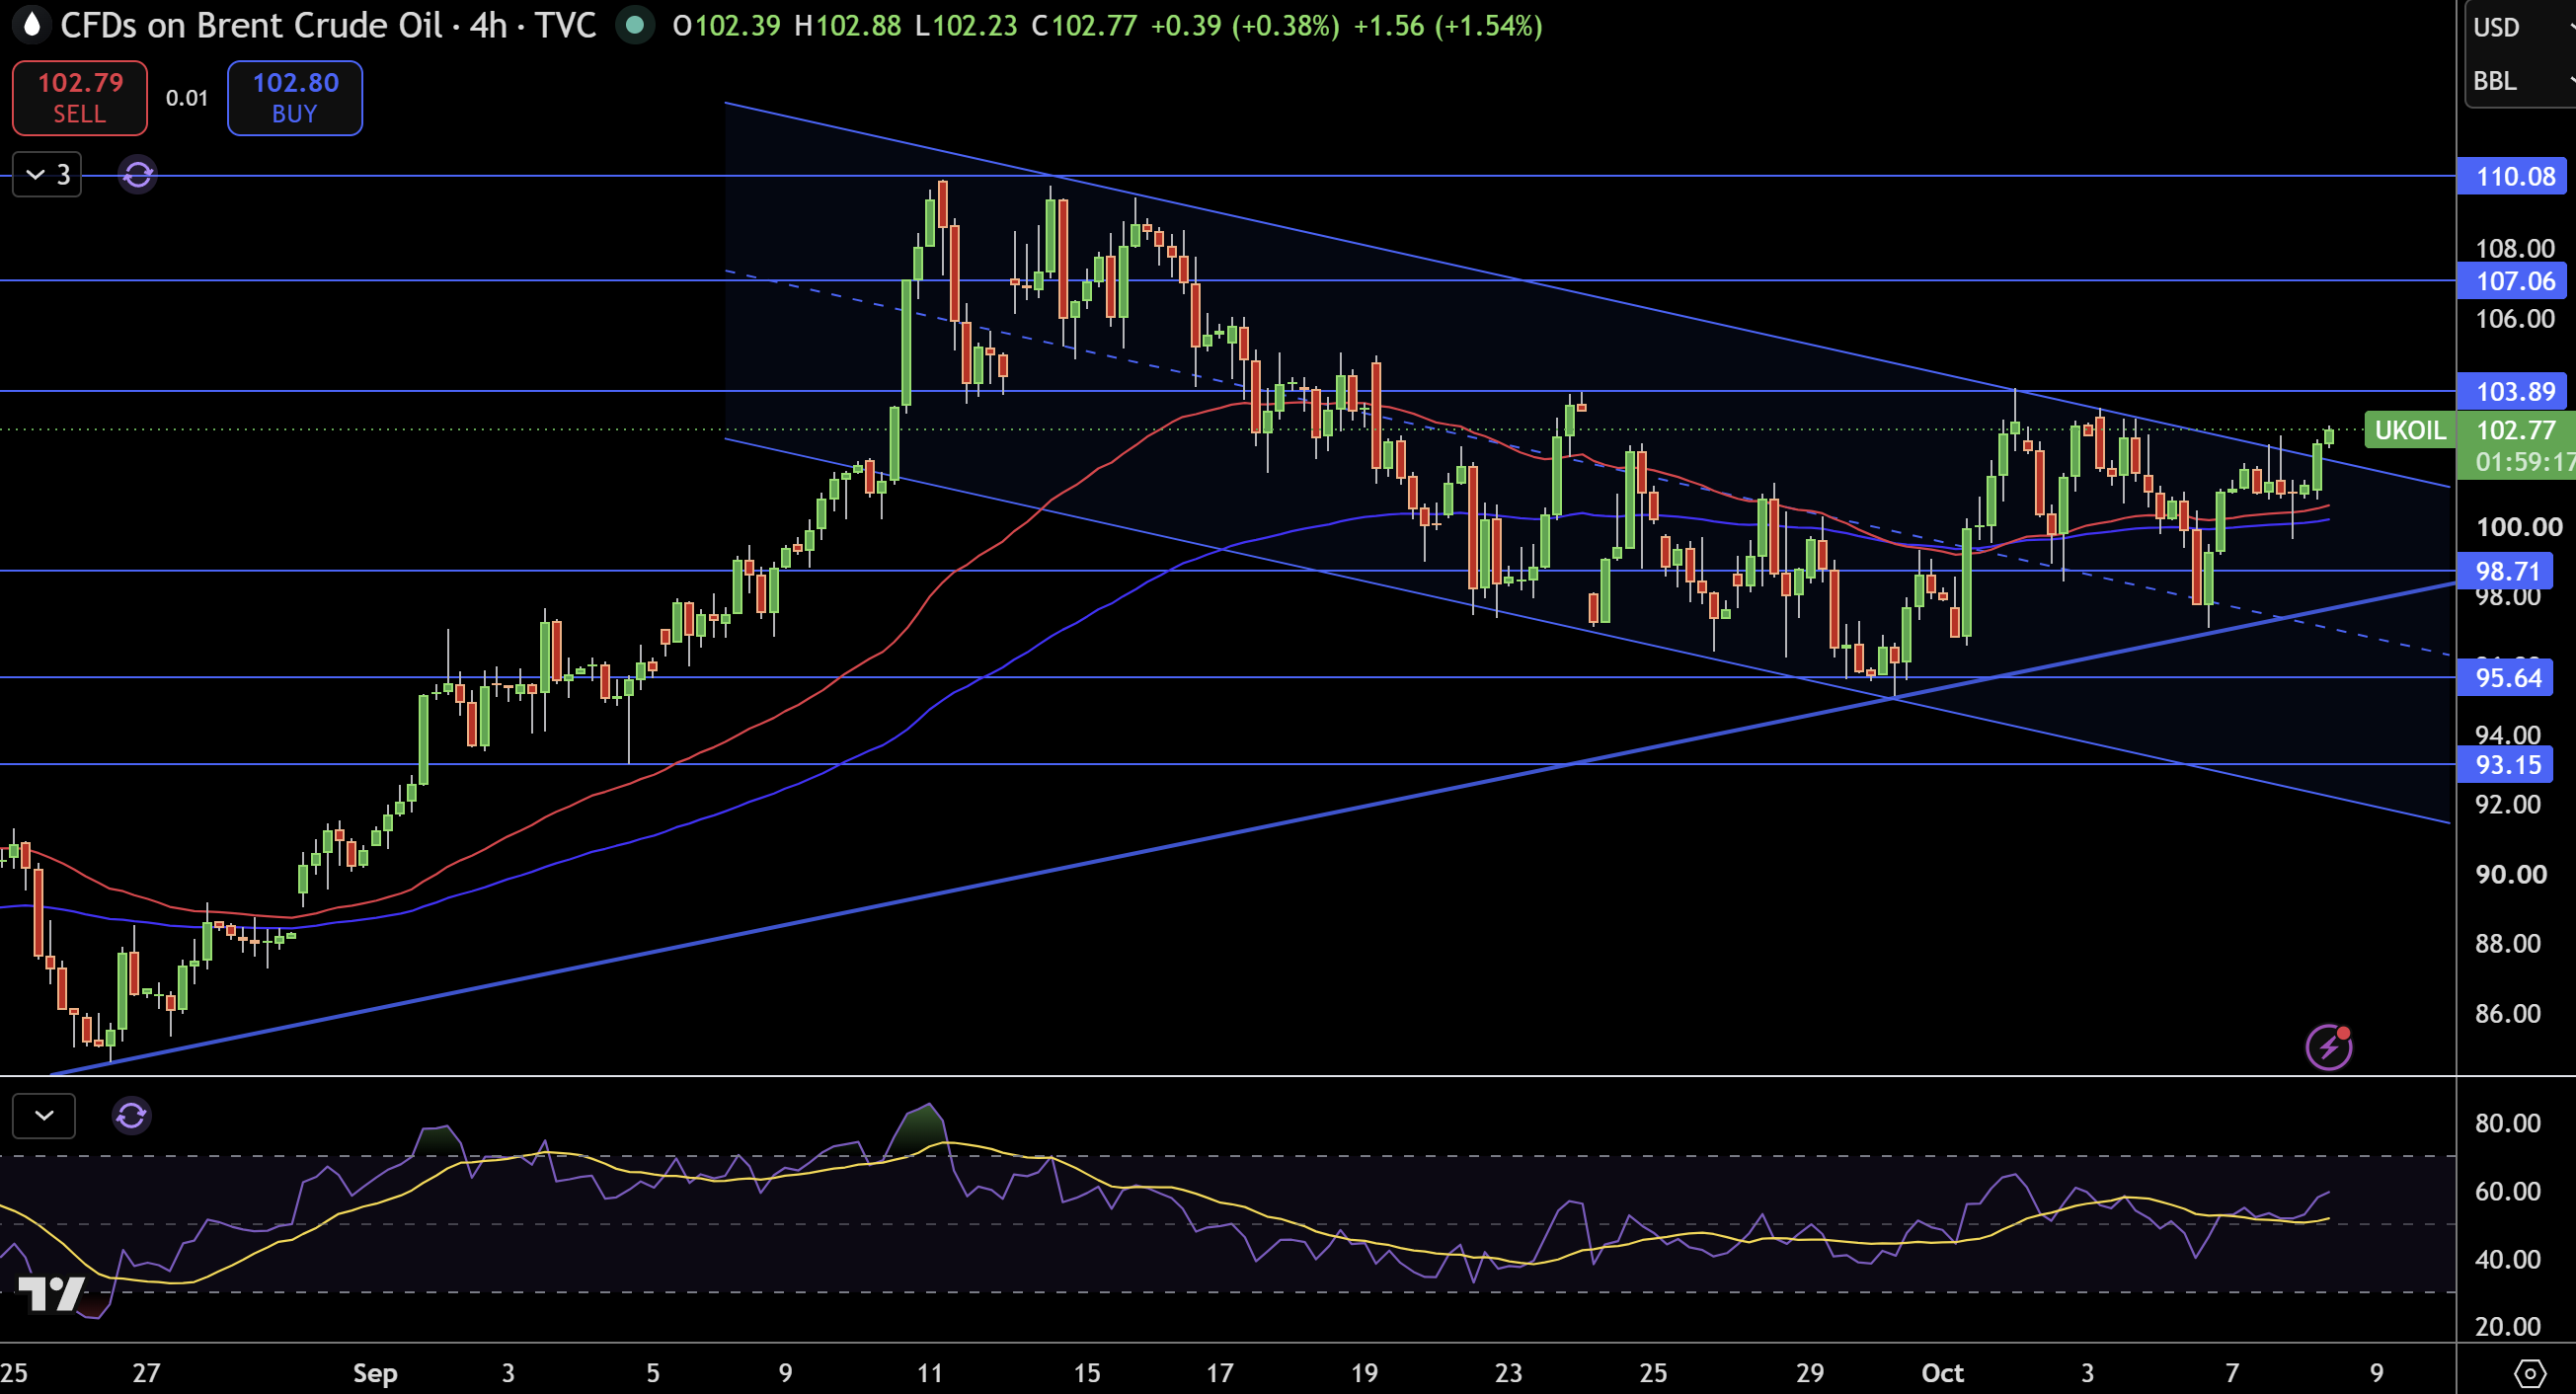
Brent crude is currently trading at $102.77 after an impressive bounce from $98.71 support. What is worth noting is that price has been trading above both moving averages and has returned to the upper boundary of a large descending channel. Therefore, the current structure is quite bullish and a clear breakout would likely result in a more bullish short-term structure.
The first target on the upside is at $103.89. A clean break above that is likely to lead to a test of the next resistance at $107.06. On the other hand, $98.71 would be a strong support, and a break lower would be likely to lead to a test of $95.64 and possibly $93.15.
RSI is confirming improving trend and is bullish, although not overextended. Therefore, I am also bullish as long as Brent remains above $98.71. A clean break above $103.89 is likely to extend the move to $107.06. On the other hand, a clean break below $98.71 would invalidate the bullish structure and possibly lead to a test of $93.15.