Gold Technical Analysis
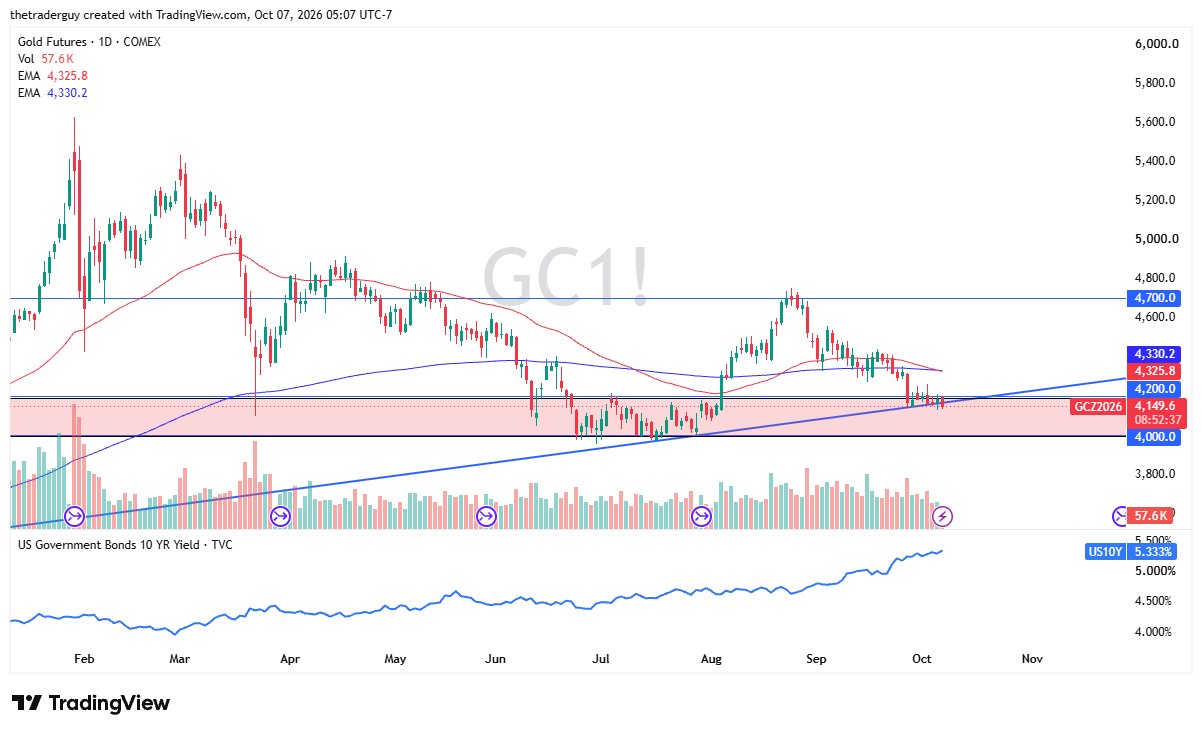
The gold market has drifted a little bit lower during the trading session, and we are slipping through a major uptrend line that goes back to the beginning of the year. Whether or not that actually matters remains to be seen, but as things stand right now, it is a market that looks like it is testing significant support and a massive demand zone that extends from $4,200 down to the $4,000 level.

Risk Appetite and Rates
I can give you a million reasons why gold might be strong right now. Risk appetite is suffering in some markets; there is a bit of a safe-haven play because of conflict, but energy inflation continues to work against it. Non-yielding assets really take it on the chin when rates are screaming higher, as they are right now in America.
Nonetheless, I do think that there is a lot of action here between $4,000 and $4,200 to keep the market somewhat supported. We’ll just have to wait and see. We’ll also have to wait and see if this trend line from the beginning of the year holds by the end of the day. If it does not, then we can take that off of our charts. We start to think more horizontally and, of course, watch rates very closely.
Rates will be the big tell here. If they start to drop, that could give gold a little bit of relief, and it could have buyers jumping back in to try to take advantage of at least a bounce. As things stand right now, though, it seems like we’re just stuck again.
If you’d like to know more about how to trade gold and silver, please visit our educational area.