SP500 Moves Lower Amid Pullback In The Tech Sector
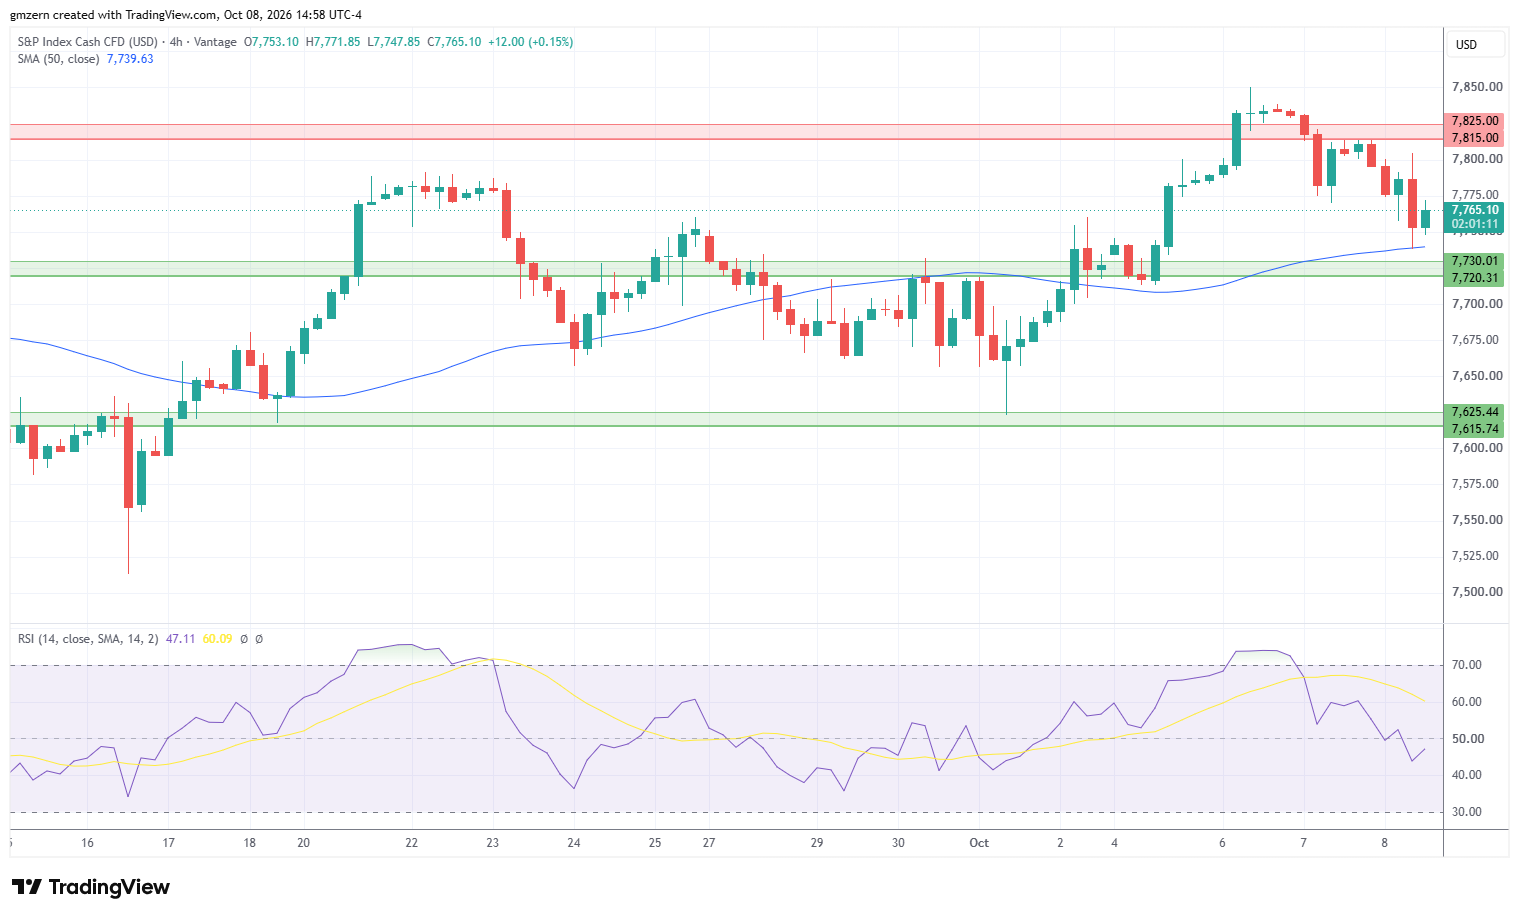
SP500 is losing ground as traders focus on a report about Open AI’s revenue. Financial Times reported that Open AI’s revenue was $20 billion less than previously expected.
Previously, analysts expected that Open AI would reach $70 billion of revenue. However, the company’s annualized revenue would be closer to $50 billion. Traders rushed to sell AI-related stocks after the release of the report.
Treasury yields pulled back as high yields have finally attracted investor interest. The yield of 2-year Treasuries declined below the 4.75% level, while the yield of 10-year Treasuries settled below 5.23%. The market has mostly ignored falling Treasury yields as traders focused on AI stocks.
Oil prices rallied as traders prepared for potential escalation in the Middle East. President Trump said that U.S. would not attack Iran before midterm elections. The market sees it as a signal that U.S. could restart the military operation against Iran after midterm elections. Such an operation would disrupt supply at a time when global oil reserves continue to fall.
Energy stocks were among the biggest gainers today as traders focused on the rally in the oil markets. Consumer defensive and real estate stocks have also gained ground amid rising demand for defensive sectors. Tech stocks found themselves under strong pressure as traders worried about Open AI’s performance.
If SP500 settles below the 50 MA at 7739, it will get to the test of the support level at 7720 – 7730. A successful test of the support at 7720 – 7730 will open the way to the test of the next support at 7615 – 7625. RSI is in the moderate territory, so there is plenty of room to gain momentum in the near term.

NASDAQ Is Losing Ground As Open AI Could Miss Revenue Estimates By $20 Billion
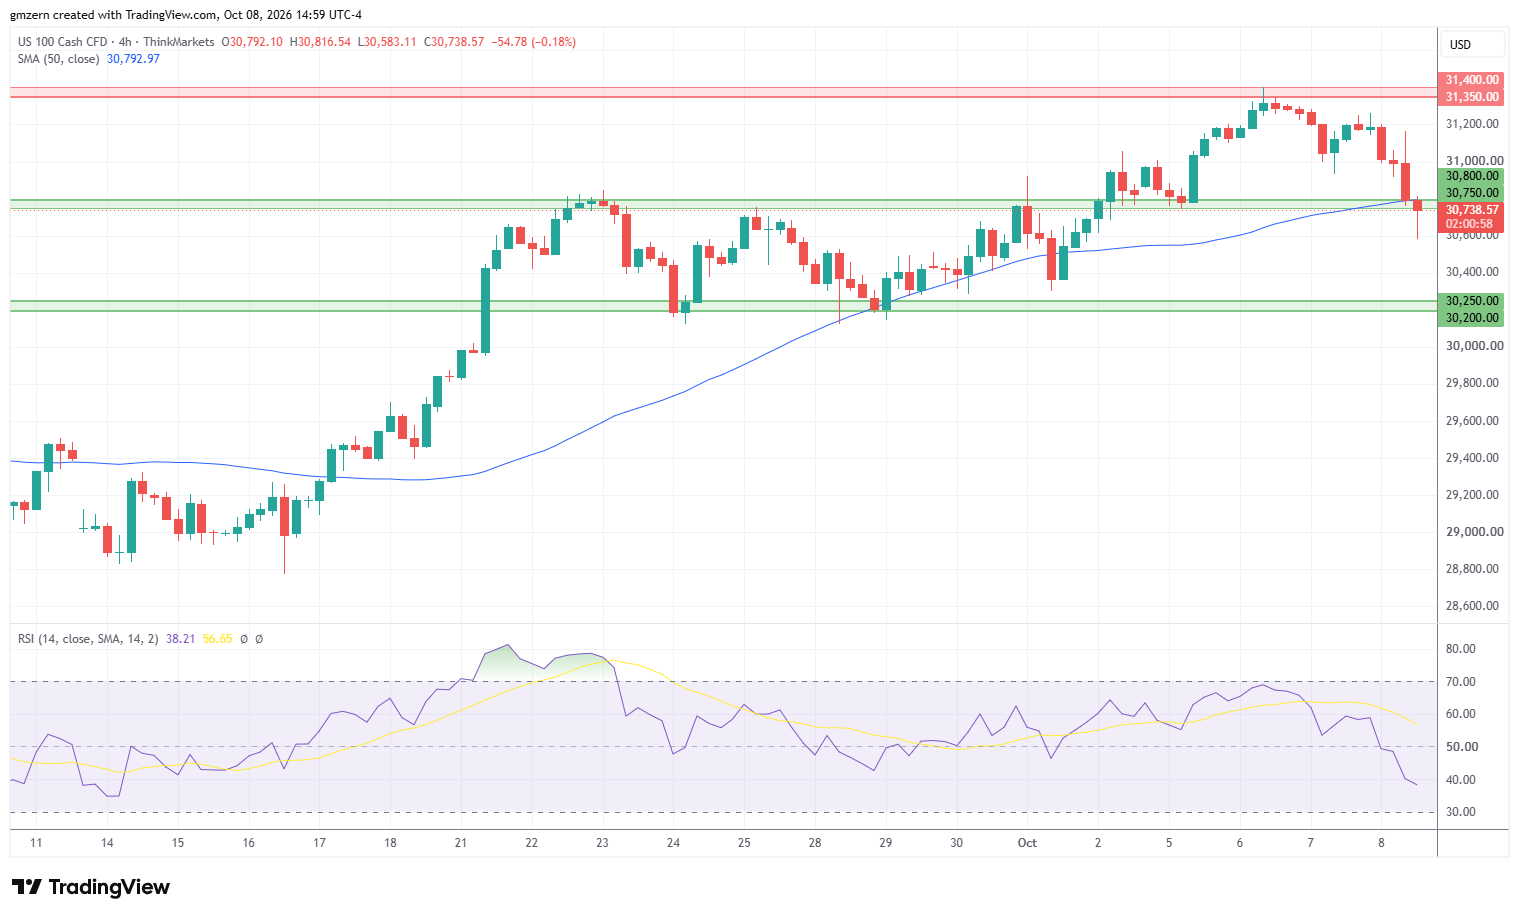
NASDAQ suffered a sell-off as traders rushed to sell AI-related stocks after the release of Financial Times report. Intel, which was down by -6.2%, was among the biggest losers in the NASDAQ index today.
Currently, NASDAQ is trying to settle below the support level at 30,750 – 30,800. If NASDAQ manages to settle below the 30,750 level, it will head towards the next support, which is located in the 30,200 – 30,250 range.
On the upside, a move above the 30,800 level will push NASDAQ towards the 31,000 level. If NASDAQ settles above 31,000, it will head towards the resistance at 31,350 – 31,400.
Dow Jones Price Forecast
Every new Dow Jones analysis as it publishes, today's technical signal and key levels, live price — on one page.
See all Dow Jones forecastsDow Jones Is Flat As Chevron Gains 3.5%
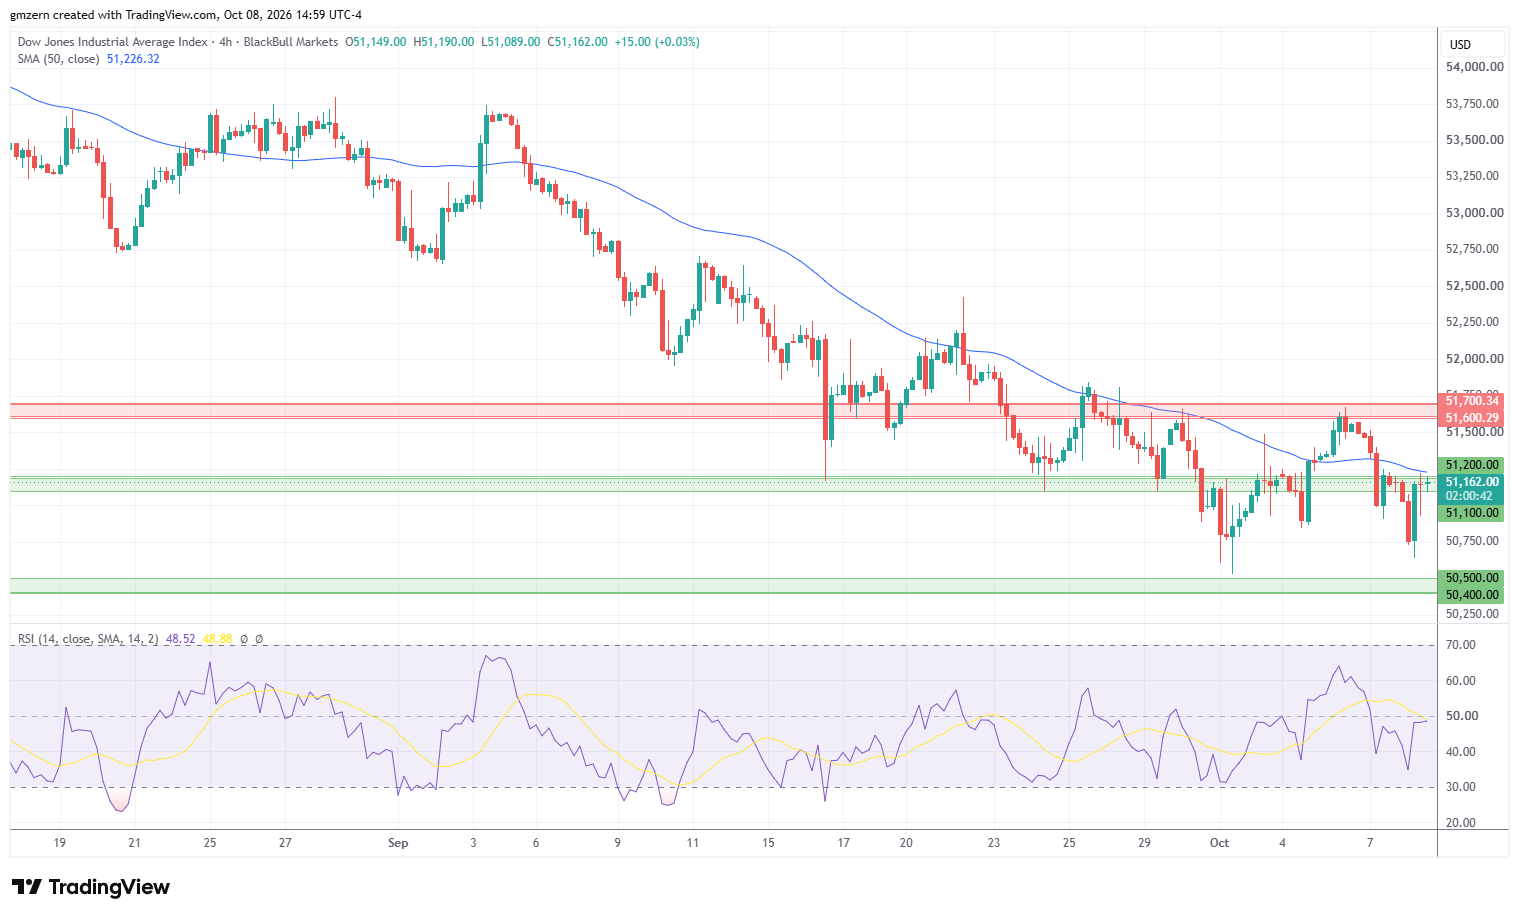
Dow Jones was mostly flat amid rising demand for energy and consumer defensive stocks. Chevron, which was up by +3.5%, was the biggest gainer in the Dow Jones index today. The stock gained upside momentum as traders reacted to the strong rally in the oil markets.
If Dow Jones manages to settle above the 50 MA at 51,226, it will move towards the resistance level, which is located in the 51,600 – 51,700 range. On the support side, a successful test of the support at 51,100 – 51,200 will open the way to the test of the next support level, which is located in the 50,400 – 50,500 range.
For a look at all of today’s economic events, check out our economic calendar.