


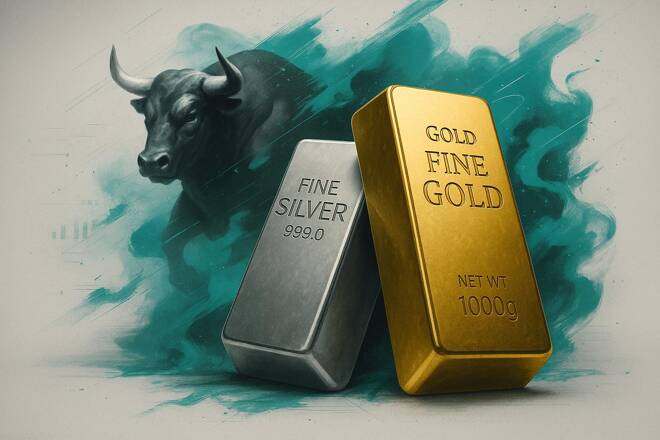
Gold (XAU) and silver (XAG) prices rose in early Asian trading on Friday as the US dollar dropped to 102 and Treasury yields eased. Gold gained over 0.9% to around $4,175 an ounce while silver climbed over 1% to $60. A soft US dollar makes both metals cheaper for overseas buyers.
However, the market still expects the 82% chance of a rate hike by the Fed in December. This keeps the recovery in gold and silver vulnerable to fresh inflation concerns.
St. Louis Fed President Alberto Musalem said on Thursday that further hikes in interest rates would be needed to bring inflation back to 2%. He left the October decision open. His comments suggest that the pause in the interest rates in October would not remove the risk of further tightening.
Meanwhile, President Trump described the talks with Iran as productive and ruled out US attacks before the elections in November. In my view, the drop in tensions between the US and Iran could ease energy inflation and reduce pressure for higher rates. But they could also weaken demand for gold as a safe haven and leave the outlook mixed in the near term.

Gold Price Forecast: $4,330 Breakout Could Target $4,530
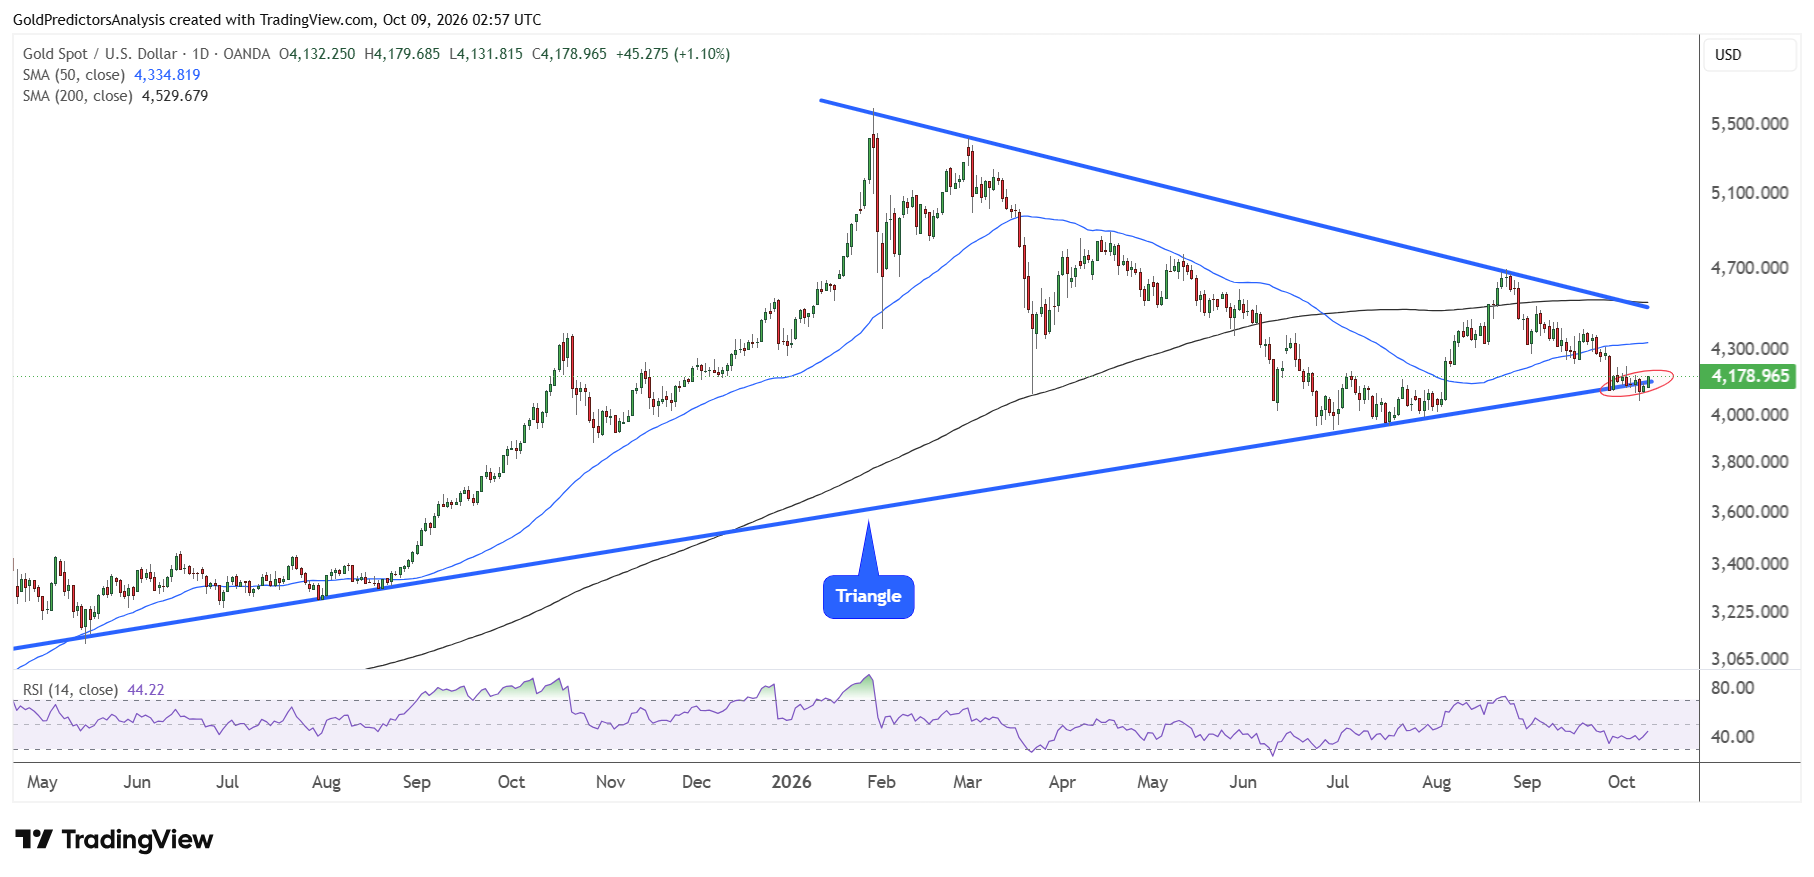
The daily chart for spot gold shows that the price has been trading within a triangle pattern in 2026. The price formed a low at $4,066 on October 7, 2026, and initiated a rebound toward the $4,175 area.
The price must break at least the $4,330 level to open the way for a rally towards the $4,530 area. A break above $4,530 will likely confirm a breakout and push gold prices towards the $5,000 area. As long as the gold price remains between $4,000 and $4,500, the possibility of consolidation remains high.
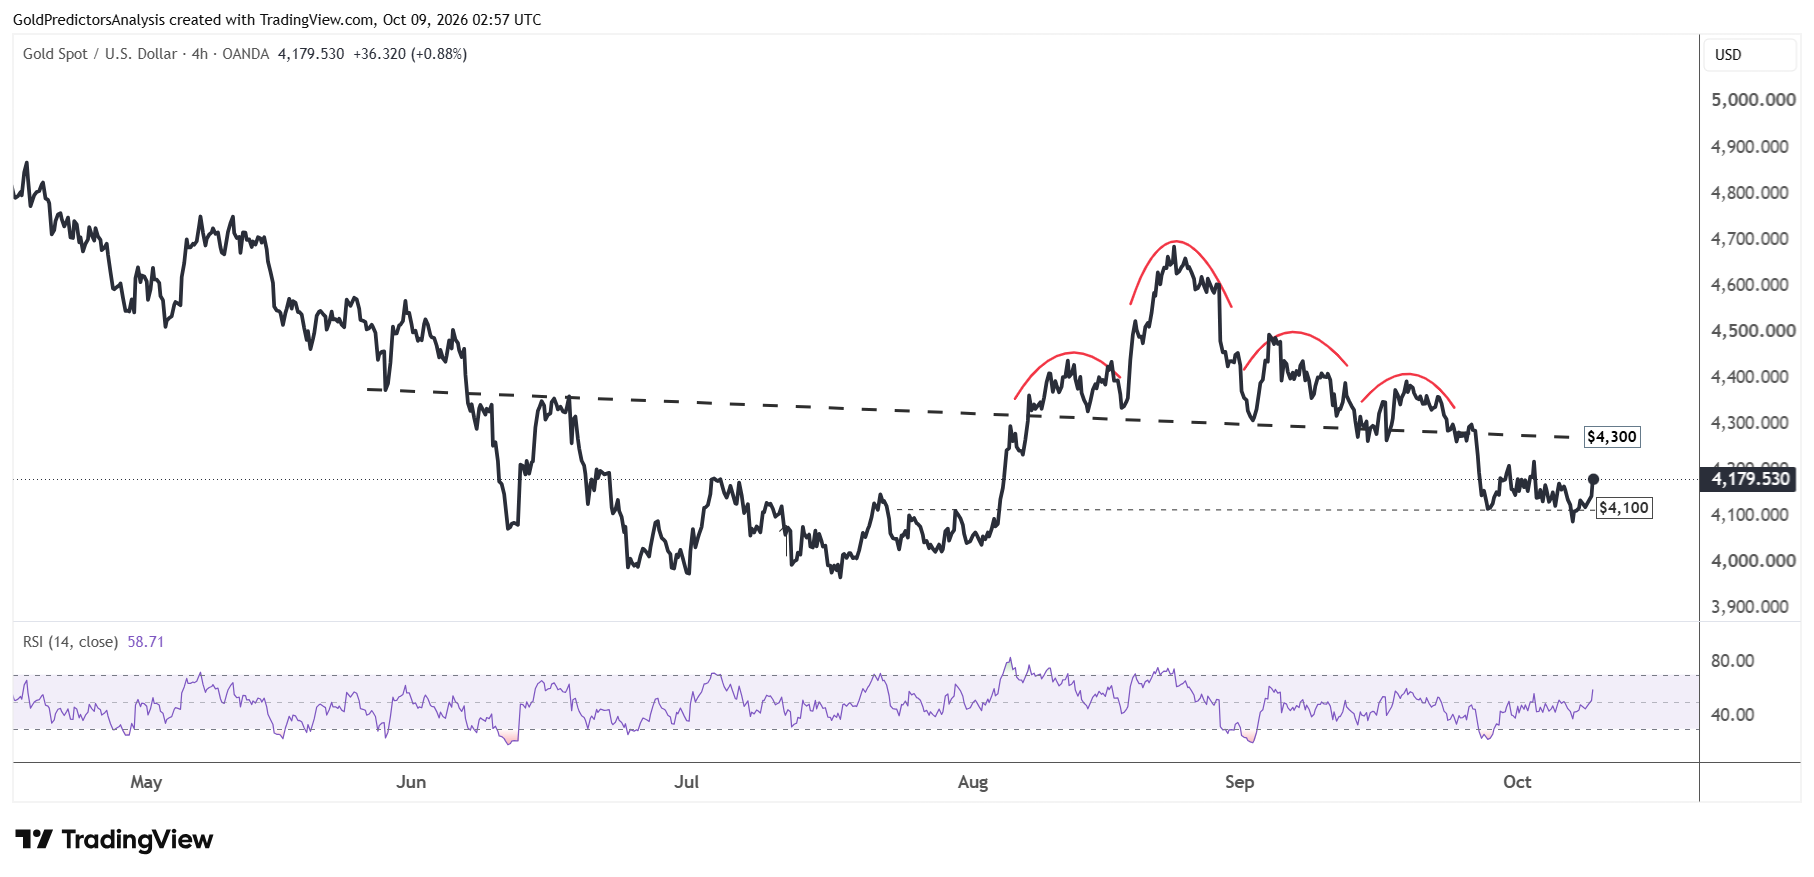
The 4-hour chart for spot gold also shows strong consolidation between $4,100 and $4,300. A break of either of these levels will likely define the next move in the gold market. However, if the price remains below $4,300, the formation of bearish price patterns may limit the rallies in the gold market.
Gold Price Forecast
Every new Gold analysis as it publishes, today's technical signal and key levels, live price — on one page.
See all Gold forecastsSilver Price Forecast: $65 Breakout Could Put $72 in View
The daily chart for spot silver also shows strong consolidation in the short term within the triangle pattern. The support of the triangle lies between $55 and $56, while the resistance remains at the $65 area. A break above $65 will likely open the way for a rally towards the 200-day SMA at the $72 level.
A break above $72 is required to open the way for a strong rally in the silver market. However, a break below $55 will likely push the price towards $50.
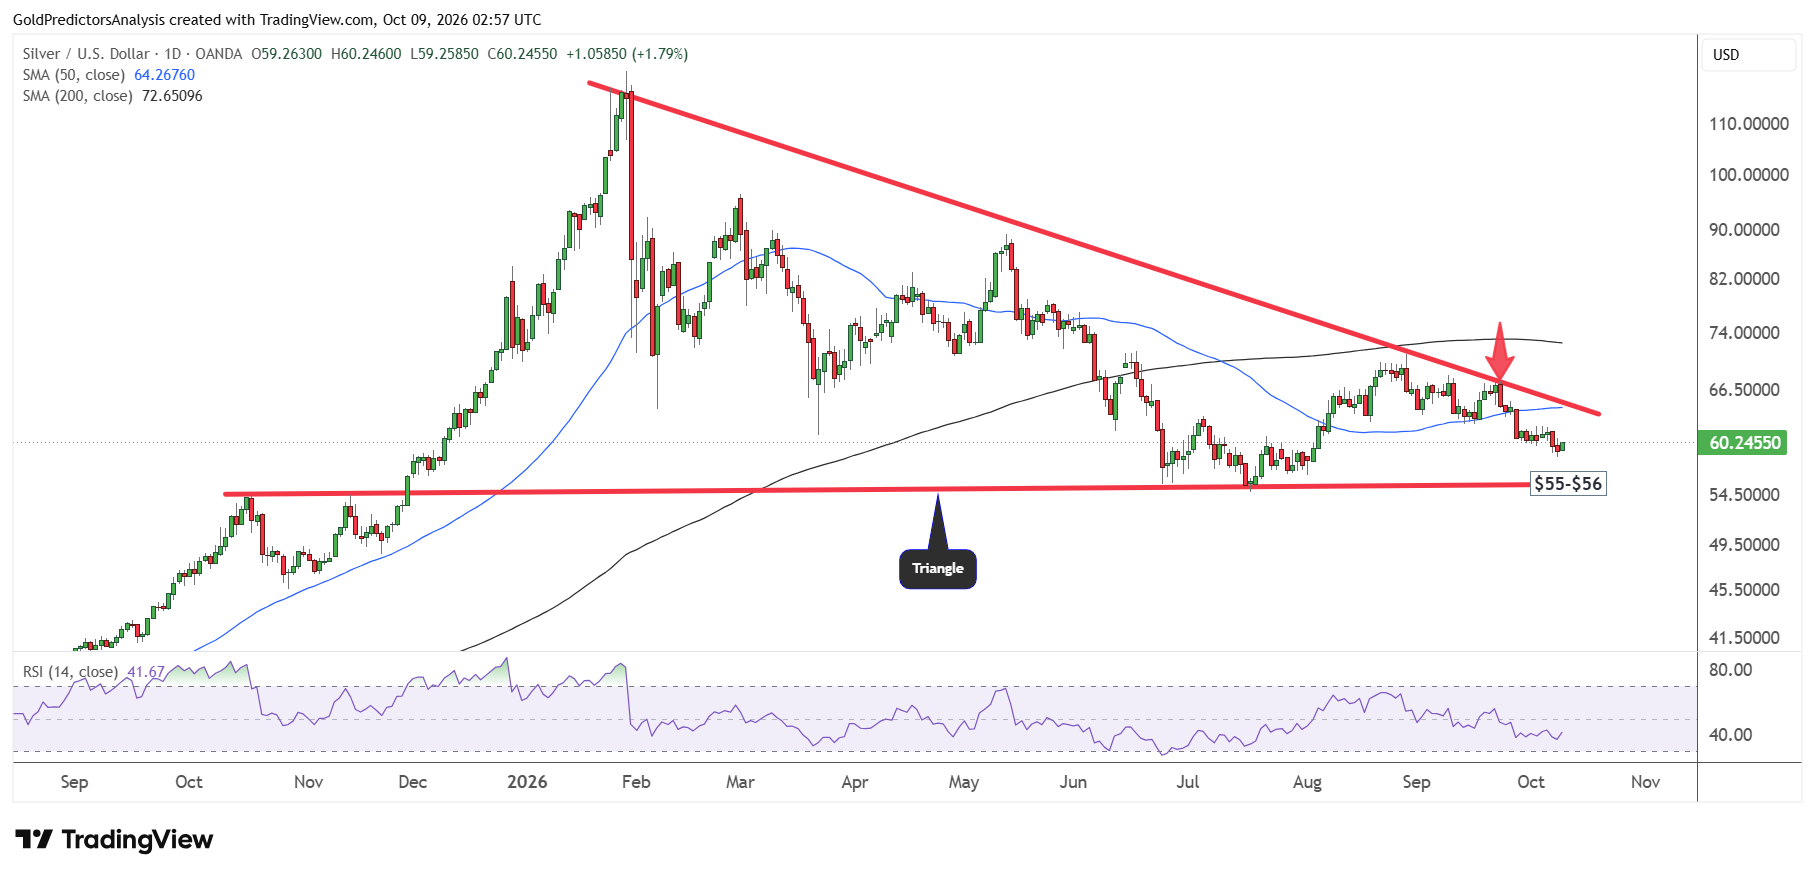
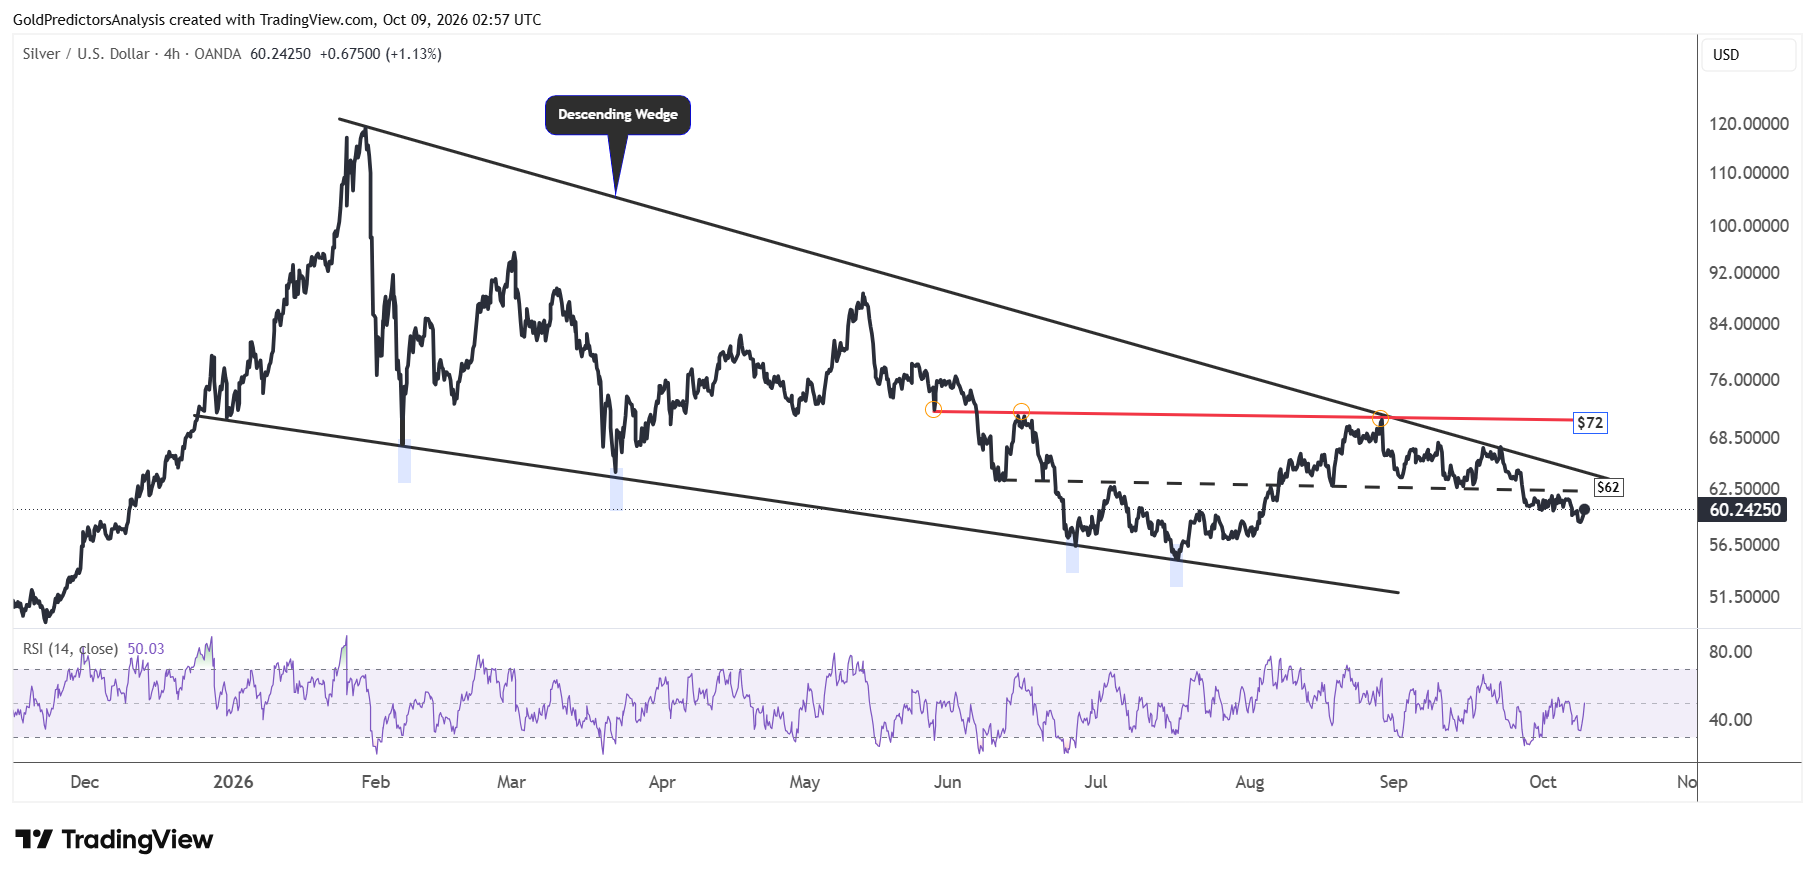
The 4-hour chart for spot silver also shows strong consolidation within the wedge pattern. The immediate resistance remains at $62. A break above $62 will likely open the way for a rally towards the $72 area. The short-term price action shows that a break below $55 will likely open the way for a drop towards the $50 area.
What to Watch Next
Traders will watch the US dollar, Treasury yields and fresh comments by the Fed for the next move in gold and silver prices. A further drop in the dollar and yields could support a recovery in both metals. But renewed concerns about inflation may strengthen the expectations for another rate hike.
The developments in the relationship between the US and Iran may shift the oil prices and demand for gold as a safe haven. Gold needs to break above $4,330 to target $4,530. Silver must clear $65 to bring $72 into view. On the other hand, the key support for gold remains at $4,000, while a break below $55 in silver could trigger a drop towards $50.
If you’d like to know more about how to trade gold and silver, please visit our educational area.


