Buyers Challenge Short-Term Resistance
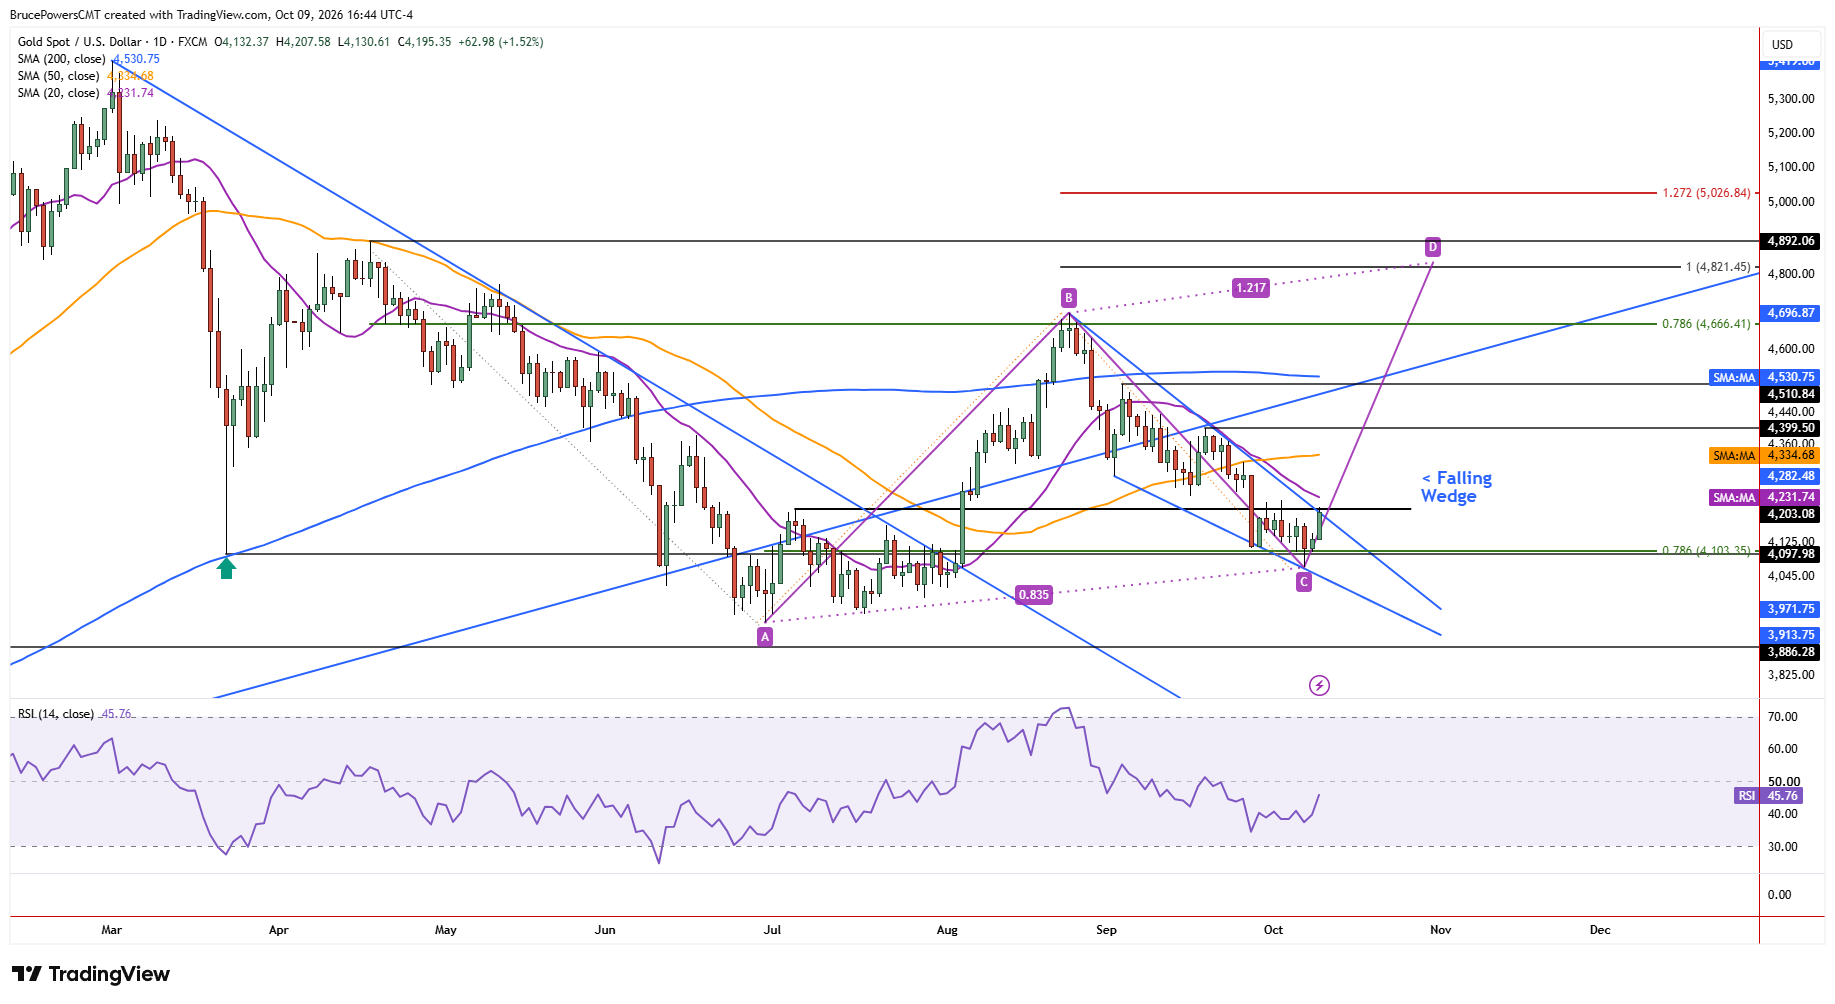
Gold showed short-term strength on Friday, advancing to a six-day high of $4,208, and testing resistance at the lower swing high of $4,203 from early July. An advance above that level would further confirm strength, suggesting that buyers are starting to regain control.
Nonetheless, the downtrend structure remains dominant unless gold triggers a bullish reversal signal above the recent minor swing high of $4,226. The falling 20-day moving average near $4,232 reinforces resistance, but a sustained move above these levels would provide further evidence of improving demand and a potential shift in short-term momentum.

Correction Nears a Potential Turning Point
During the decline from the August peak of $4,697 (B), gold tested resistance near the 20-day moving average on several occasions, with sellers successfully defending it each time. Consequently, reclaiming the average would signal a potential change in character and strengthen the case that the bearish correction has ended. That correction completed a 78.6% Fibonacci retracement of the prior advance and established a higher swing low at $4,066 (C), a potentially important foundation for a recovery.
Falling Wedge Defines Breakout Levels
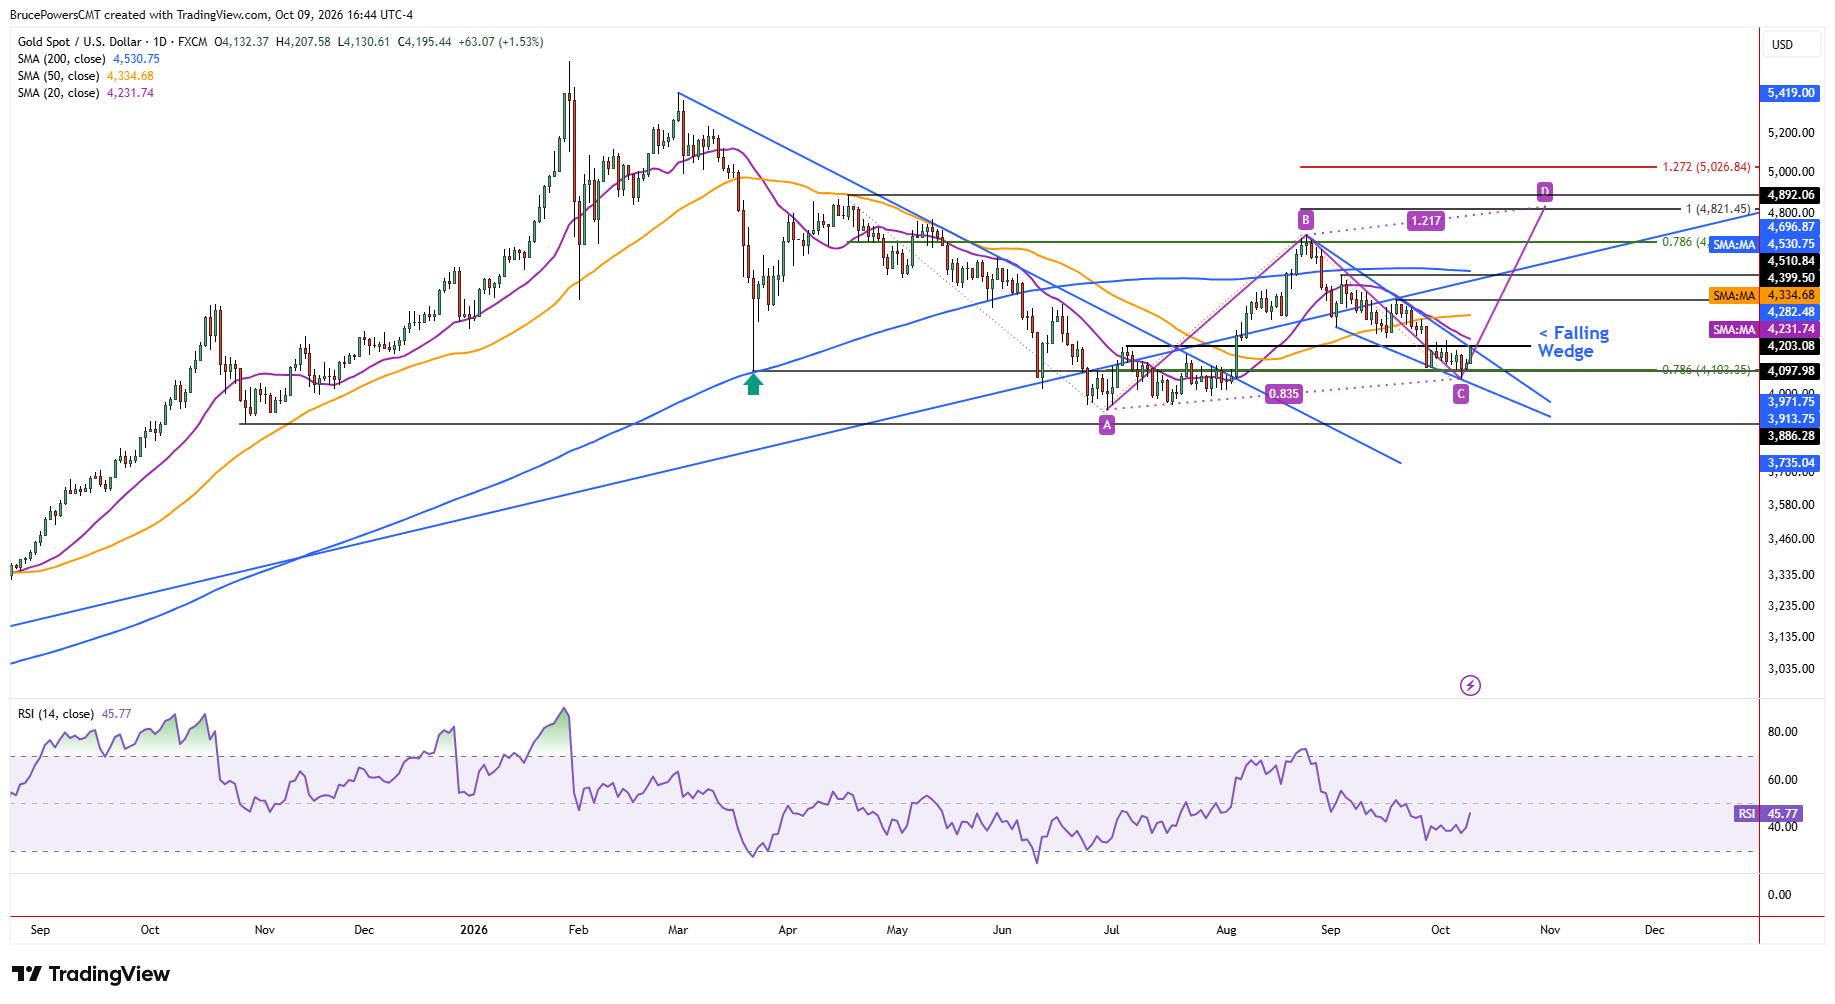
Notably, the correction has taken the form of a falling bullish wedge, with a breakout signal triggered by a move above $4,226. This pattern adds to the potential for a bullish reversal, although follow-through buying would help confirm the signal. Upon a successful breakout, the first upside reference is the lower swing high of $4,400, followed by the lower swing high at $4,511. The latter level is reinforced by the 200-day moving average, currently near $4,531. Beyond this resistance zone, the August high of $4,697 would become a major test of the recovery.
$4,821 ABCD Target Hinges on a Confirmed Recovery
A sustained reversal from the higher swing low could set the stage for a second decisive rally from the summer lows. Although the swing high of August is noted as a key upside target if buyers regain and maintain control, a measured move projected by the rising ABCD pattern points to a potential minimum target near $4,821 (D). Reaching the August high would put gold back at a critical resistance threshold, while a subsequent breakout above $4.697 would trigger a bullish continuation signal and strengthen the case for the higher ABCD target.
If you’d like to know more about how to trade gold and silver, please visit our educational area.