



USOIL: Inventory Draw and Hurricane Outages Tighten U.S. Supply
Crude oil fundamentals in the U.S. are looking better after the EIA reported a drawdown in commercial crude oil inventories by 3.2 million barrels for the week ended October 2, compared to a forecasted build of 1.7 million barrels. Crude oil exports jumped by 1.2 million barrels per day to 4.77 million barrels per day, while the refinery utilization rate rose to 92.7% as refinery activity and crude exports increased.
Hurricane Isaias brought a temporary shock to crude oil supply. As of Thursday, roughly 1.3 million barrels per day of crude production (63% of total production) had been shut-in in the Gulf of Mexico as producers evacuated offshore facilities.

UKOil: Iran Diplomacy Eases Risk, but Hormuz Remains Fragile
On Friday, the release of tension between the U.S. and Iran eased some of the threat to Brent crude oil. President Trump stated the U.S. would not attack Iran before the midterm elections and said talks with Iran were productive. Iran has previously proposed reopening the Strait of Hormuz within seven days if the U.S. accepts its conditions. However, the U.S. recently imposed fresh sanctions on Iranian shipping networks.
China will restart its refined fuel exports. During its recent holiday, authorities approved about 3.7 million metric tons of gasoline, diesel and jet fuel exports for October. That’s down slightly from the 4 million tons approved in September.
Natural Gas: Storage Cushion Grows as Hurricane Cuts Gulf Output
U.S. natural gas storage rose 85 Bcf to 3,500 Bcf during the week ended Oct. 2. Storage is 2% above the five-year average and 3.6% below last year. Isaias took 57% of Gulf gas production, tightening the supply, but firm export demand is expected ahead of the winter as September LNG exports totaled 10.9 million metric tons, of which 54% was sent to Europe.
Natural Gas Technical Analysis: NG Pulls Back From $3.23 as $3.12 Support Becomes Critical
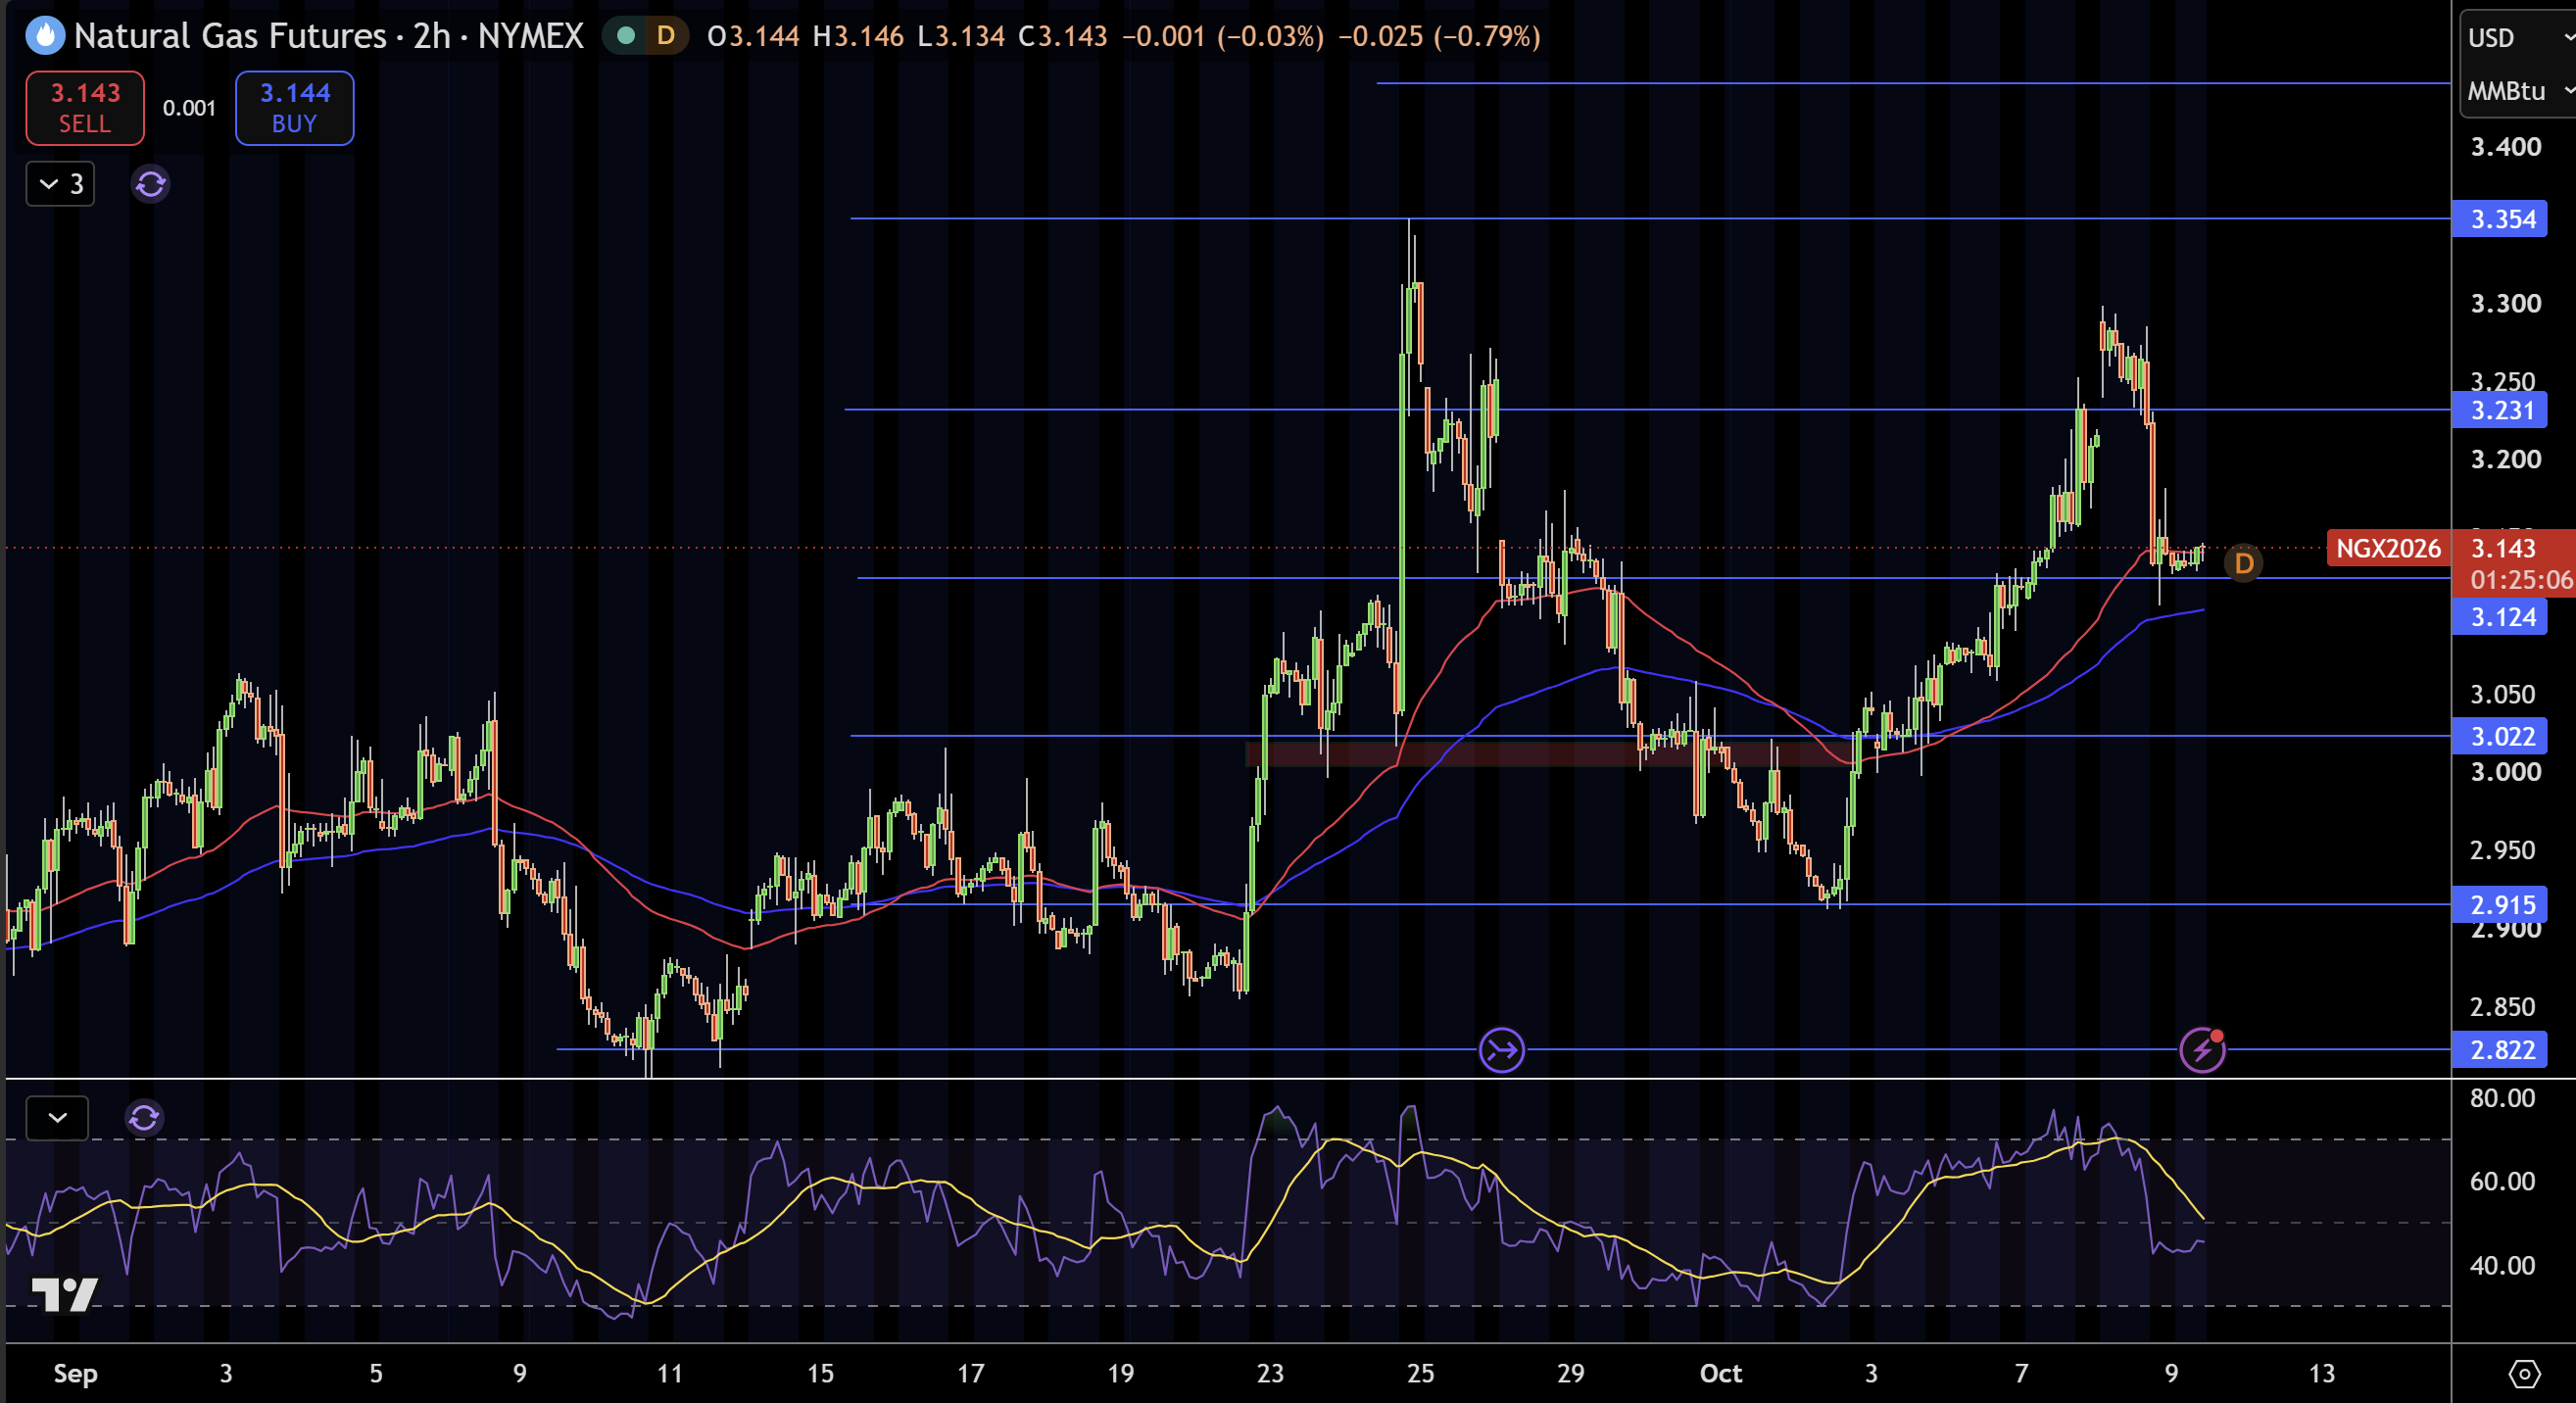
Natural gas is trading around $3.14 on the 2-hour chart after pulling back from its recent rally to $3.30. Natural gas is currently testing $3.12, and as long as it holds above the rest of the moving averages, the longer-term uptrend is still in effect. Momentum has, however, cooled significantly at the moment.
Natural Gas Price Forecast
Every new Natural Gas analysis as it publishes, today's technical signal and key levels, live price — on one page.
See all Natural Gas forecastsI am looking for support at $3.12. A break below there would bring support into play at $3.02 and then $2.92 and $2.82. On the upside, $3.23 would be the first level of resistance and $3.35 the next.
RSI has moved back towards the midline, signaling that a test of the uptrend was just a breather and not a complete reversal. Natural gas is currently just above $3.12, so for now I am neutral with a slight bias long. If the uptrend holds and prices move above $3.23, I would become more bullish, and a move below $3.12 would be more bearish.
WTI Crude Oil Technical Analysis: USOIL Tests $90.80 as $91.40 Caps the Recovery
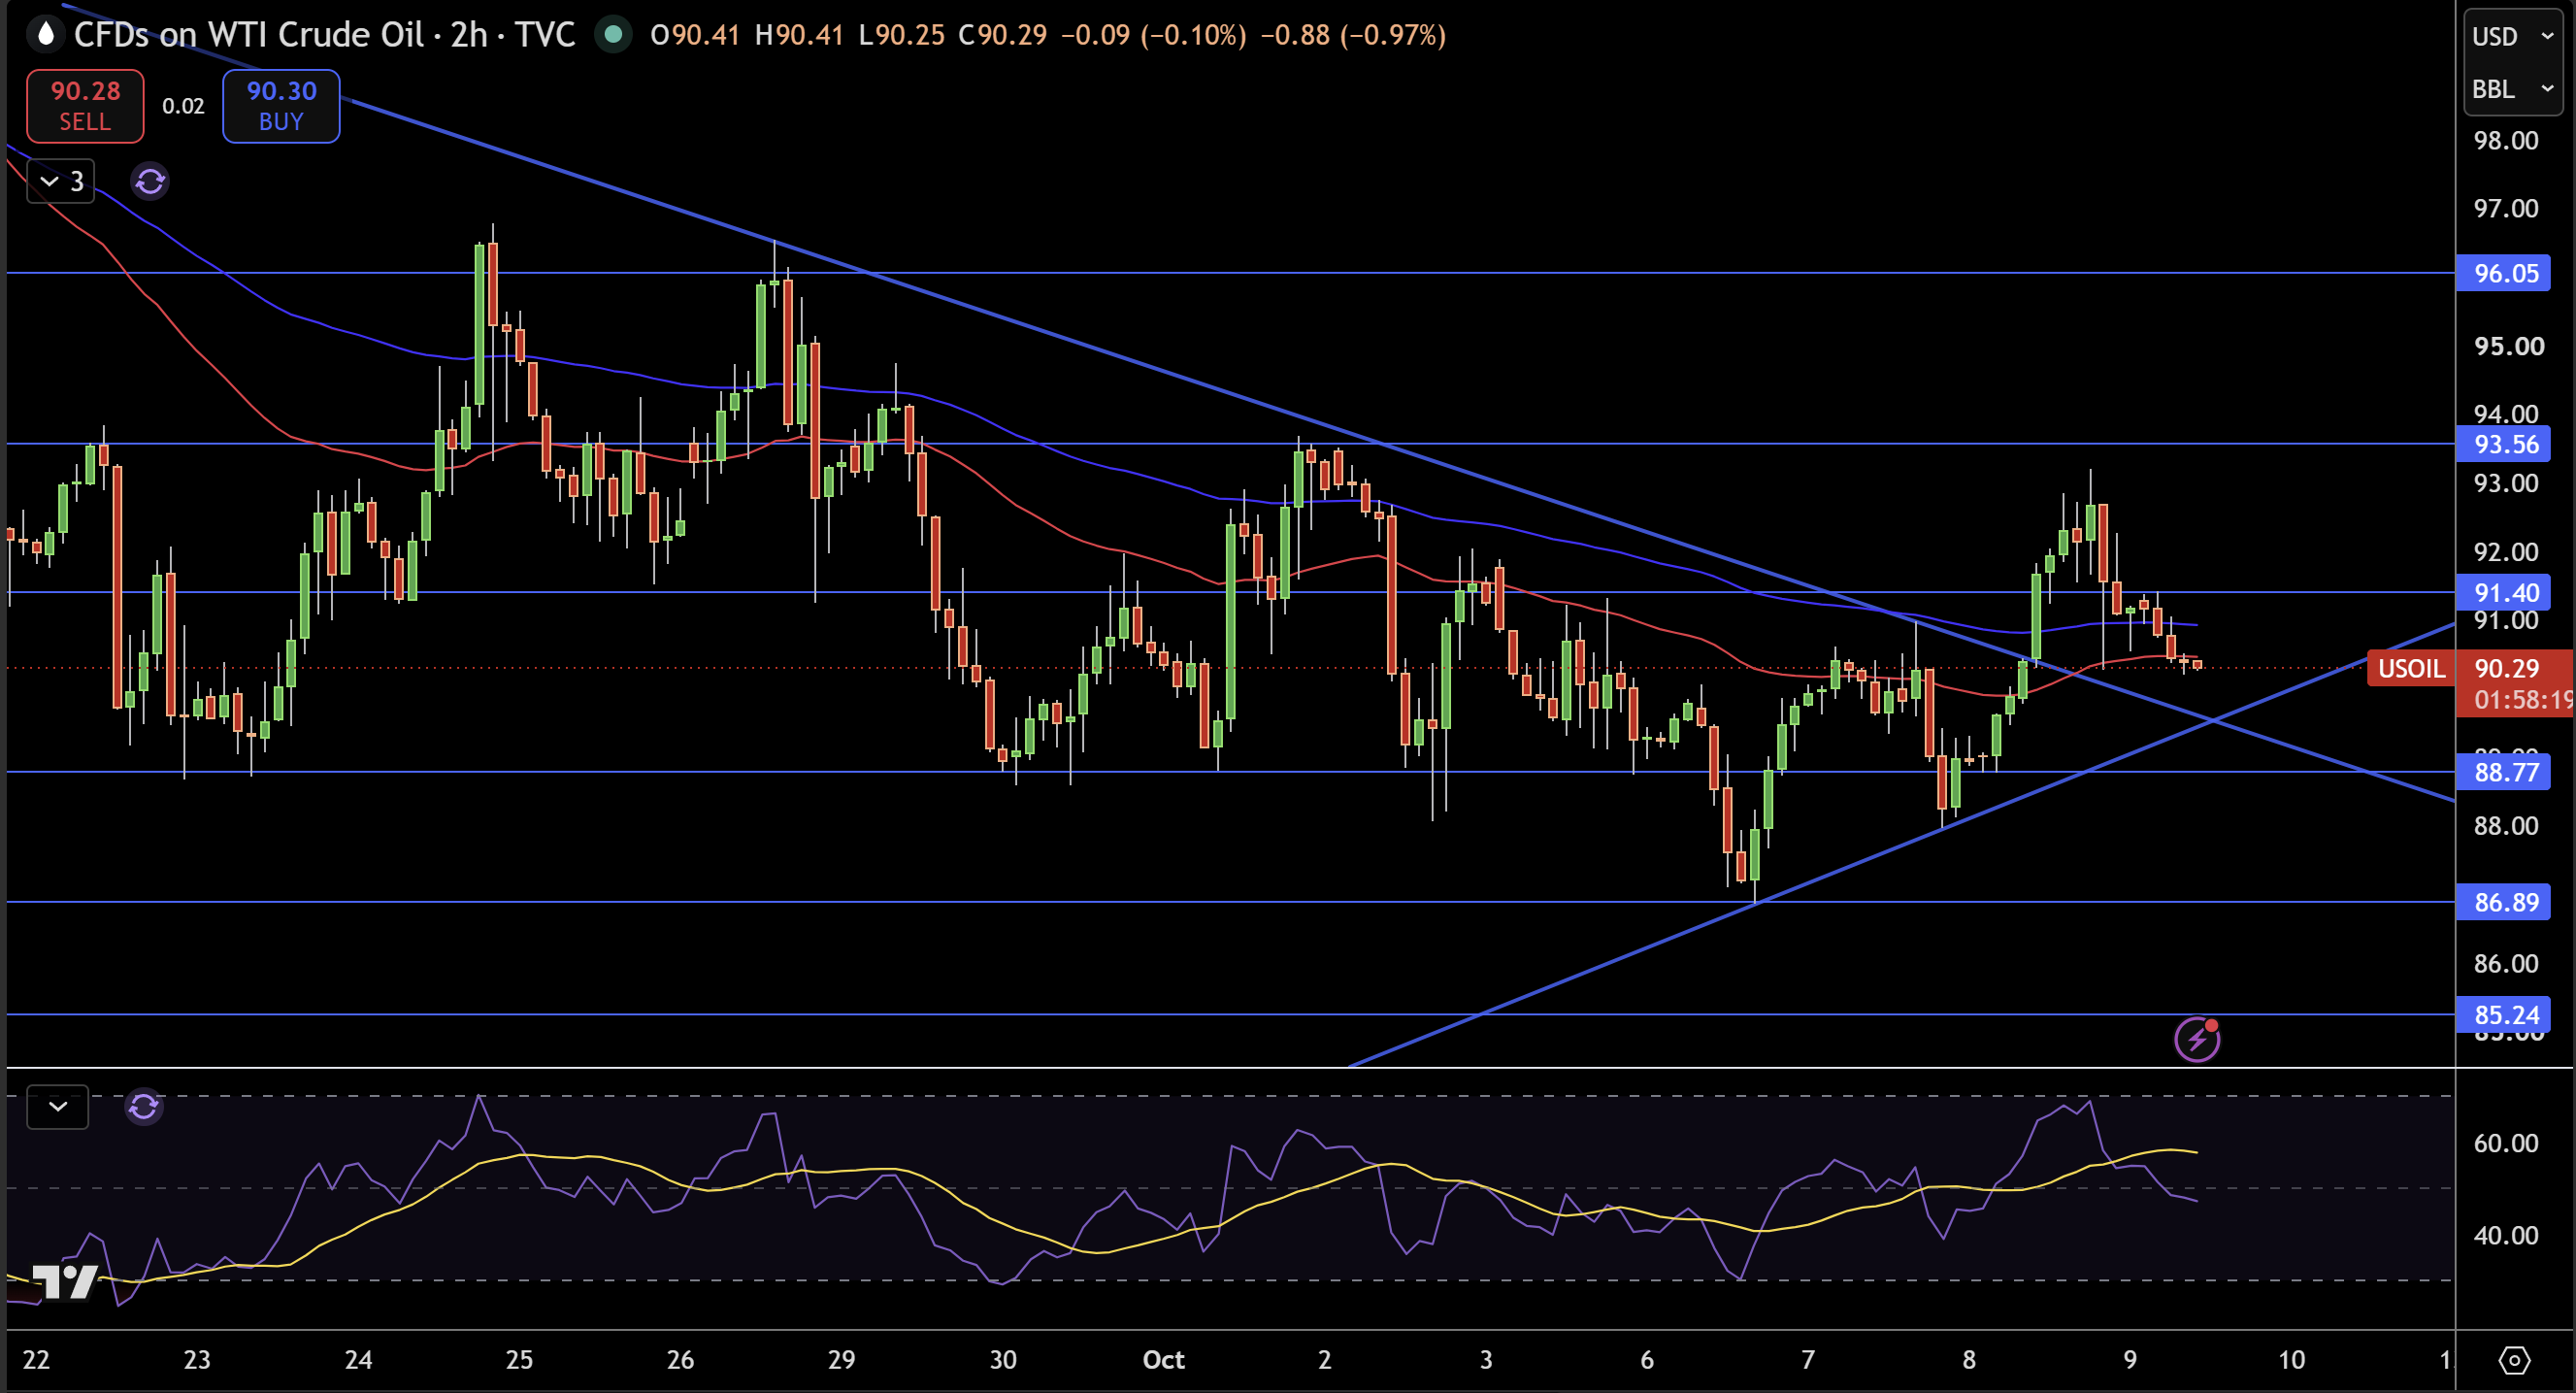
On the 2-hour chart of WTI crude oil, I see that price is rebounding from the $86.89 area and is attempting a recovery toward a descending resistance trendline and moving averages. The recovery is positive but as long as the trendline stays in the picture, lower highs still dominate the picture and a clear break above it is required to change the overall trend.
I see first resistance at $91.40. Above that level is a swing area at $93.56, which is also underneath the upper trendline of the Channel. $96.05 is underneath a swing high at $98.83. First support is at $88.77. Below that is $86.89 and $85.24.
RSI is in the positive region so momentum is with the upswing but not overbought. I see a neutral bias with slight bullish bias as long as WTI holds above $88.77. A clean break above $91.40 would shift my bias more positively while a breakdown and close below $88.77 would shift my focus to $86.89.
Brent Crude Oil Technical Analysis: UKOIL Holds $102.78 as $103.89 Remains the Key Breakout Test
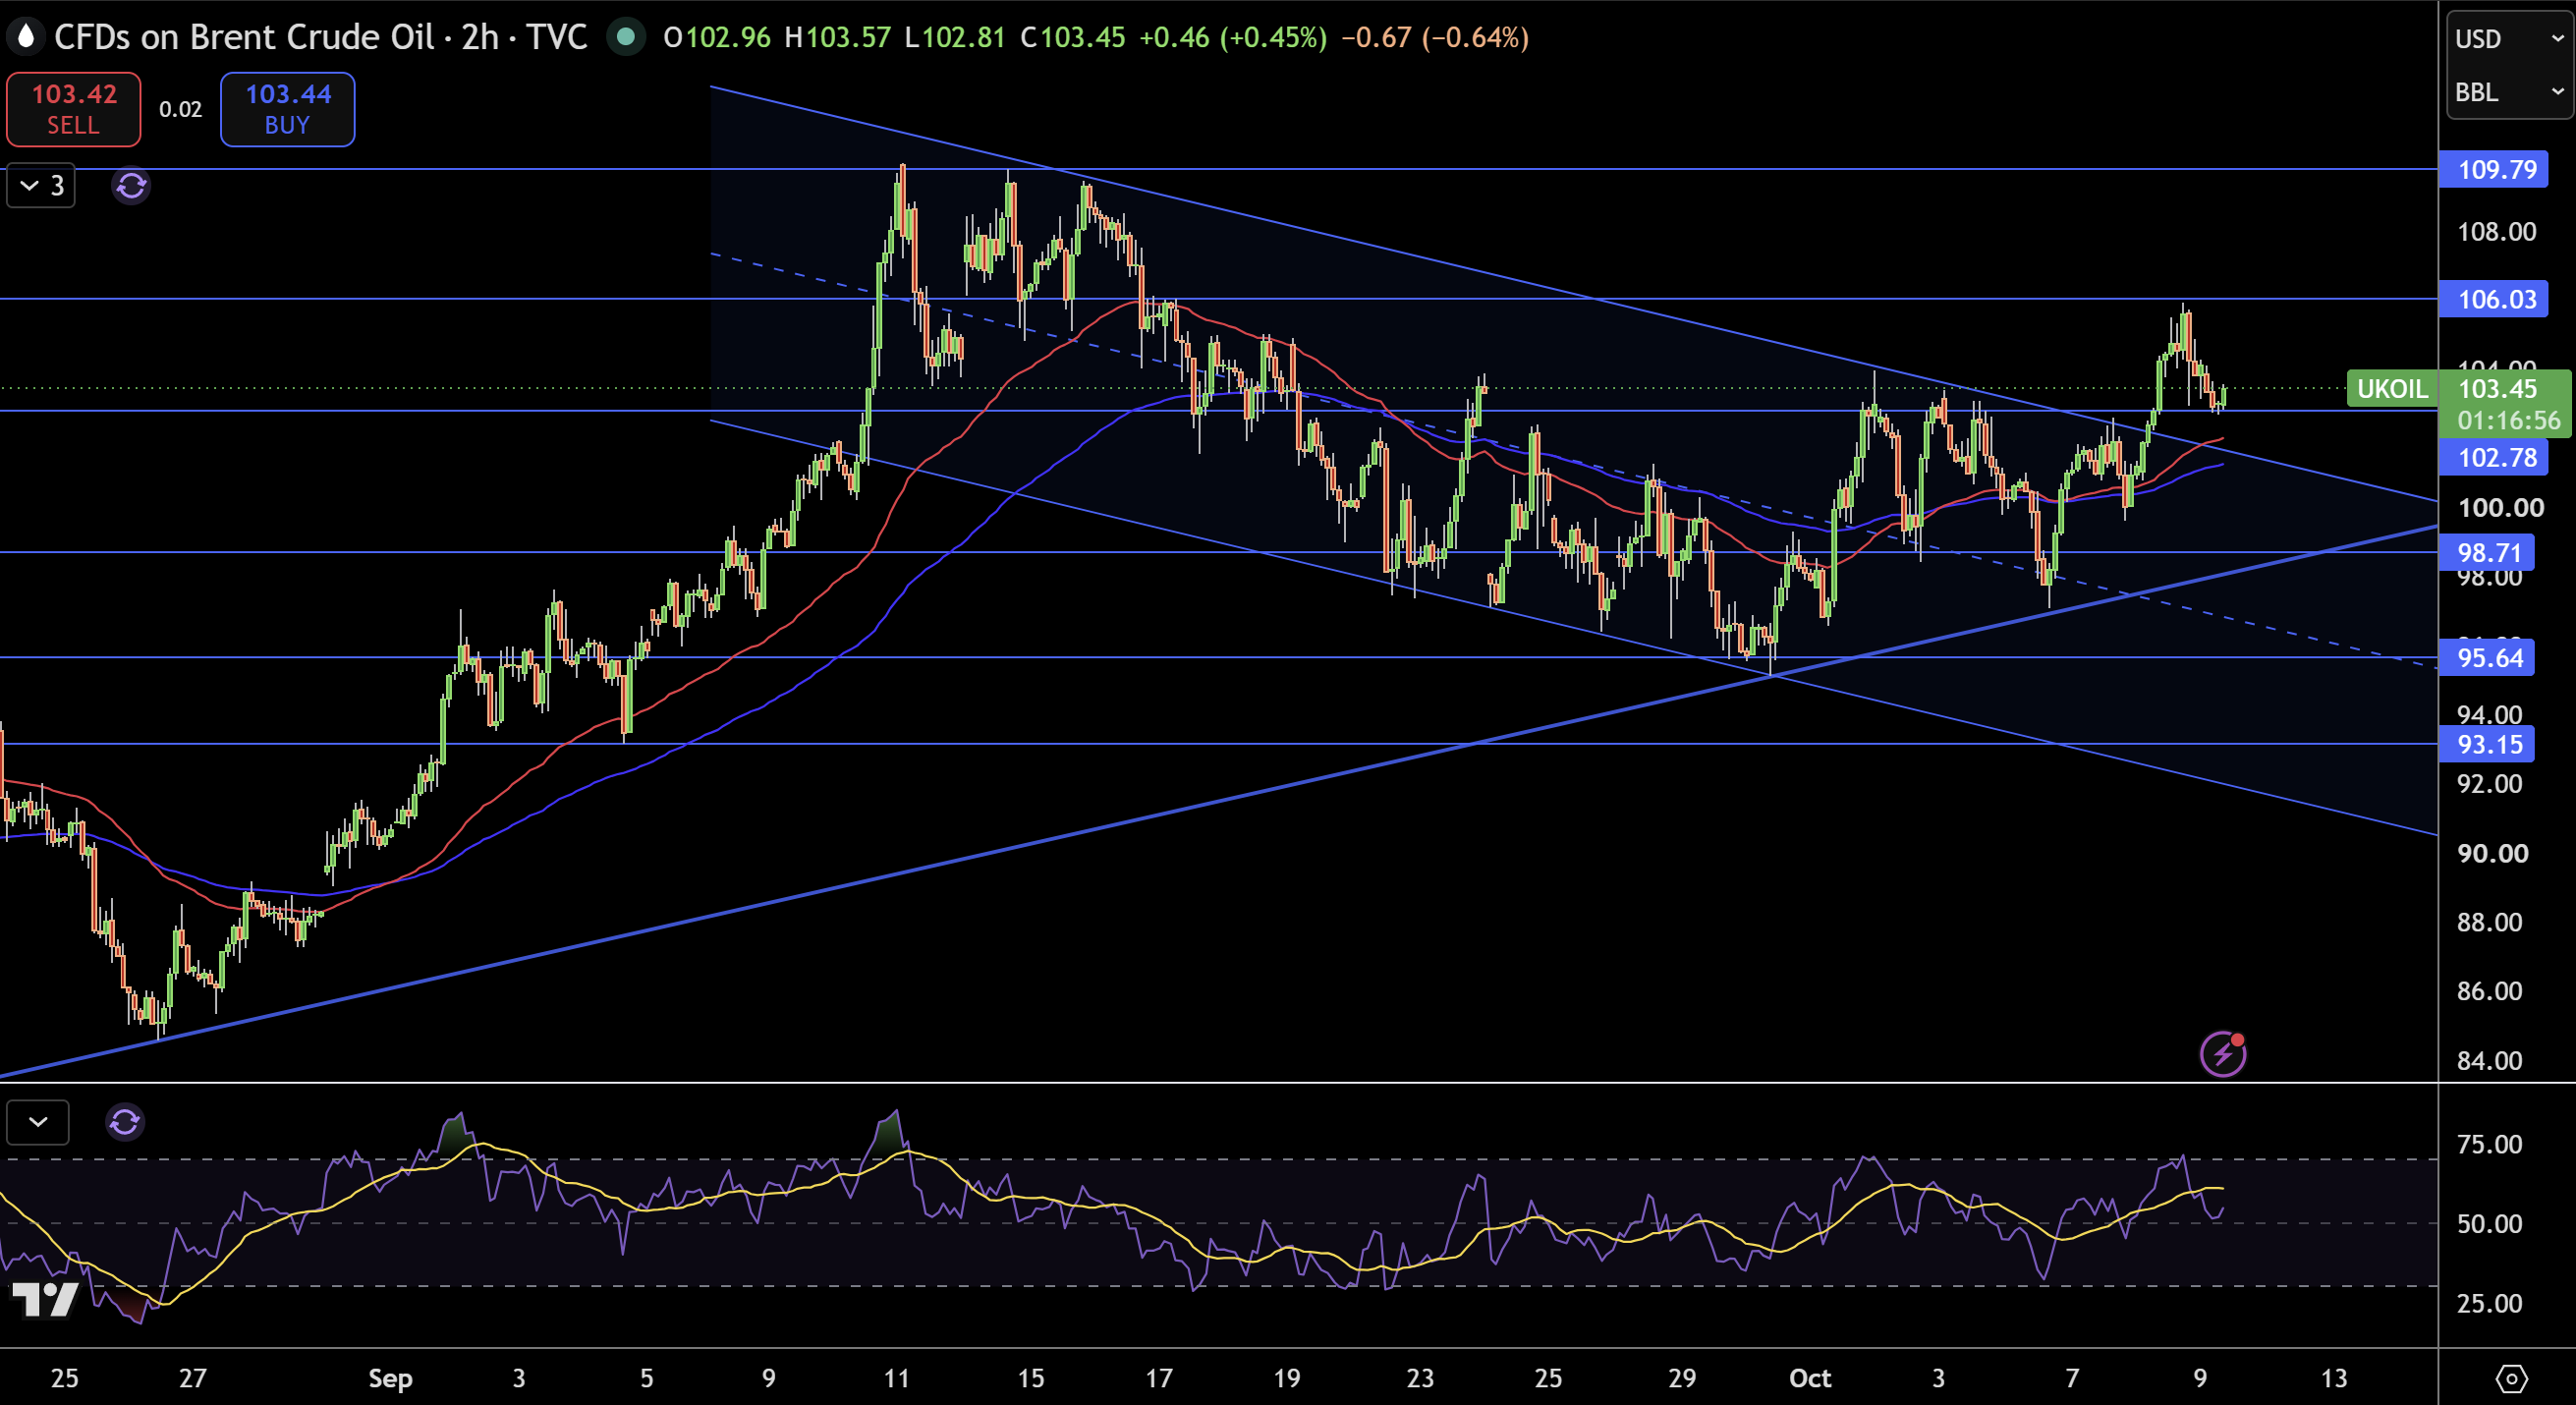
Brent is up to $103.45. It has recovered very nicely off the $98.71 level. As it stands above both the MAs and in the upper channel it keeps the broad picture positive. However, $103.89 remains the key breakout level and buyers still need a clear break above it to strengthen the uptrend.
$103.89 is the first resistance. A clear break above this would target $106.03 and then $109.79. For support, $102.78 is the first. Under this, $98.71, $95.64, and $93.15 come into play.
RSI has improved recently and is above the 50 level. This means the momentum is positive, but is not overextended. With Brent above $102.78, I like longs. A close above $103.89 further strengthens the uptrend and targets the $106.03 area. A move through $98.71 invalidates the current pattern.


