
Gold: Softer Yields Offer Relief as Institutional Buying Deepens
Gold’s basic backdrop improved Friday with a weaker U.S. dollar and lower Treasury yields. Non-yielding bullion had recently faced headwinds from a strong dollar and rising yields. Softer labor-market data mean there is a 17% probability of a Fed rate hike in October and an 83% probability of a hike in December, keeping the end-of-year outlook restrictive. Other Fed officials, like Governor Waller, said, “additional” rate hikes will likely be needed to get inflation to the 2% target, and that they had the flexibility to determine the timing.
Strong investment demand is helping to offset the restrictive rate environment. Global gold ETFs added another 67 metric tons in September, bringing holdings to a record 4,256 tons. Strong third quarter inflows also set a record at $31 billion, according to the World Gold Council.
China is also strengthening the institutional bid. For the 23rd consecutive month, the PBOC added to its gold reserves in September, bringing the total to 77.47 million ounces from 76.73 million in August.

Silver: Investment Demand Confronts Weakening Solar Consumption
Just like gold, silver benefits from the Fed shift. But while gold has transitioned to a more store of value role, silver has not, and its fundamental story remains more industrial. The Silver Institute expects 2026 to be the sixth consecutive year of a market deficit, with the estimated deficit for the year at 46.3 million ounces. The cumulative stock draw since 2021 is around 762 million ounces.
Industrial fabrication is estimated at 639.6 million ounces for 2026, impacted by silver thrifting and the substitution of silver in the manufacture of solar panels. However, AI infrastructure and automotive electronics, and the strengthening of the power grid remain positive demand drivers.
Coin and bar demand is expected to increase by 18% in 2026, while U.S. retail investment is expected to increase by 88% after several years of low demand.
Both metals are expected to have positive demand from investment, but silver has a more structural supply constraint than gold.
Gold Price Forecast
Every new Gold analysis as it publishes, today's technical signal and key levels, live price — on one page.
See all Gold forecastsGold Technical Analysis: XAU/USD Breaks Above $4,184 as $4,226 Becomes the Next Upside Test
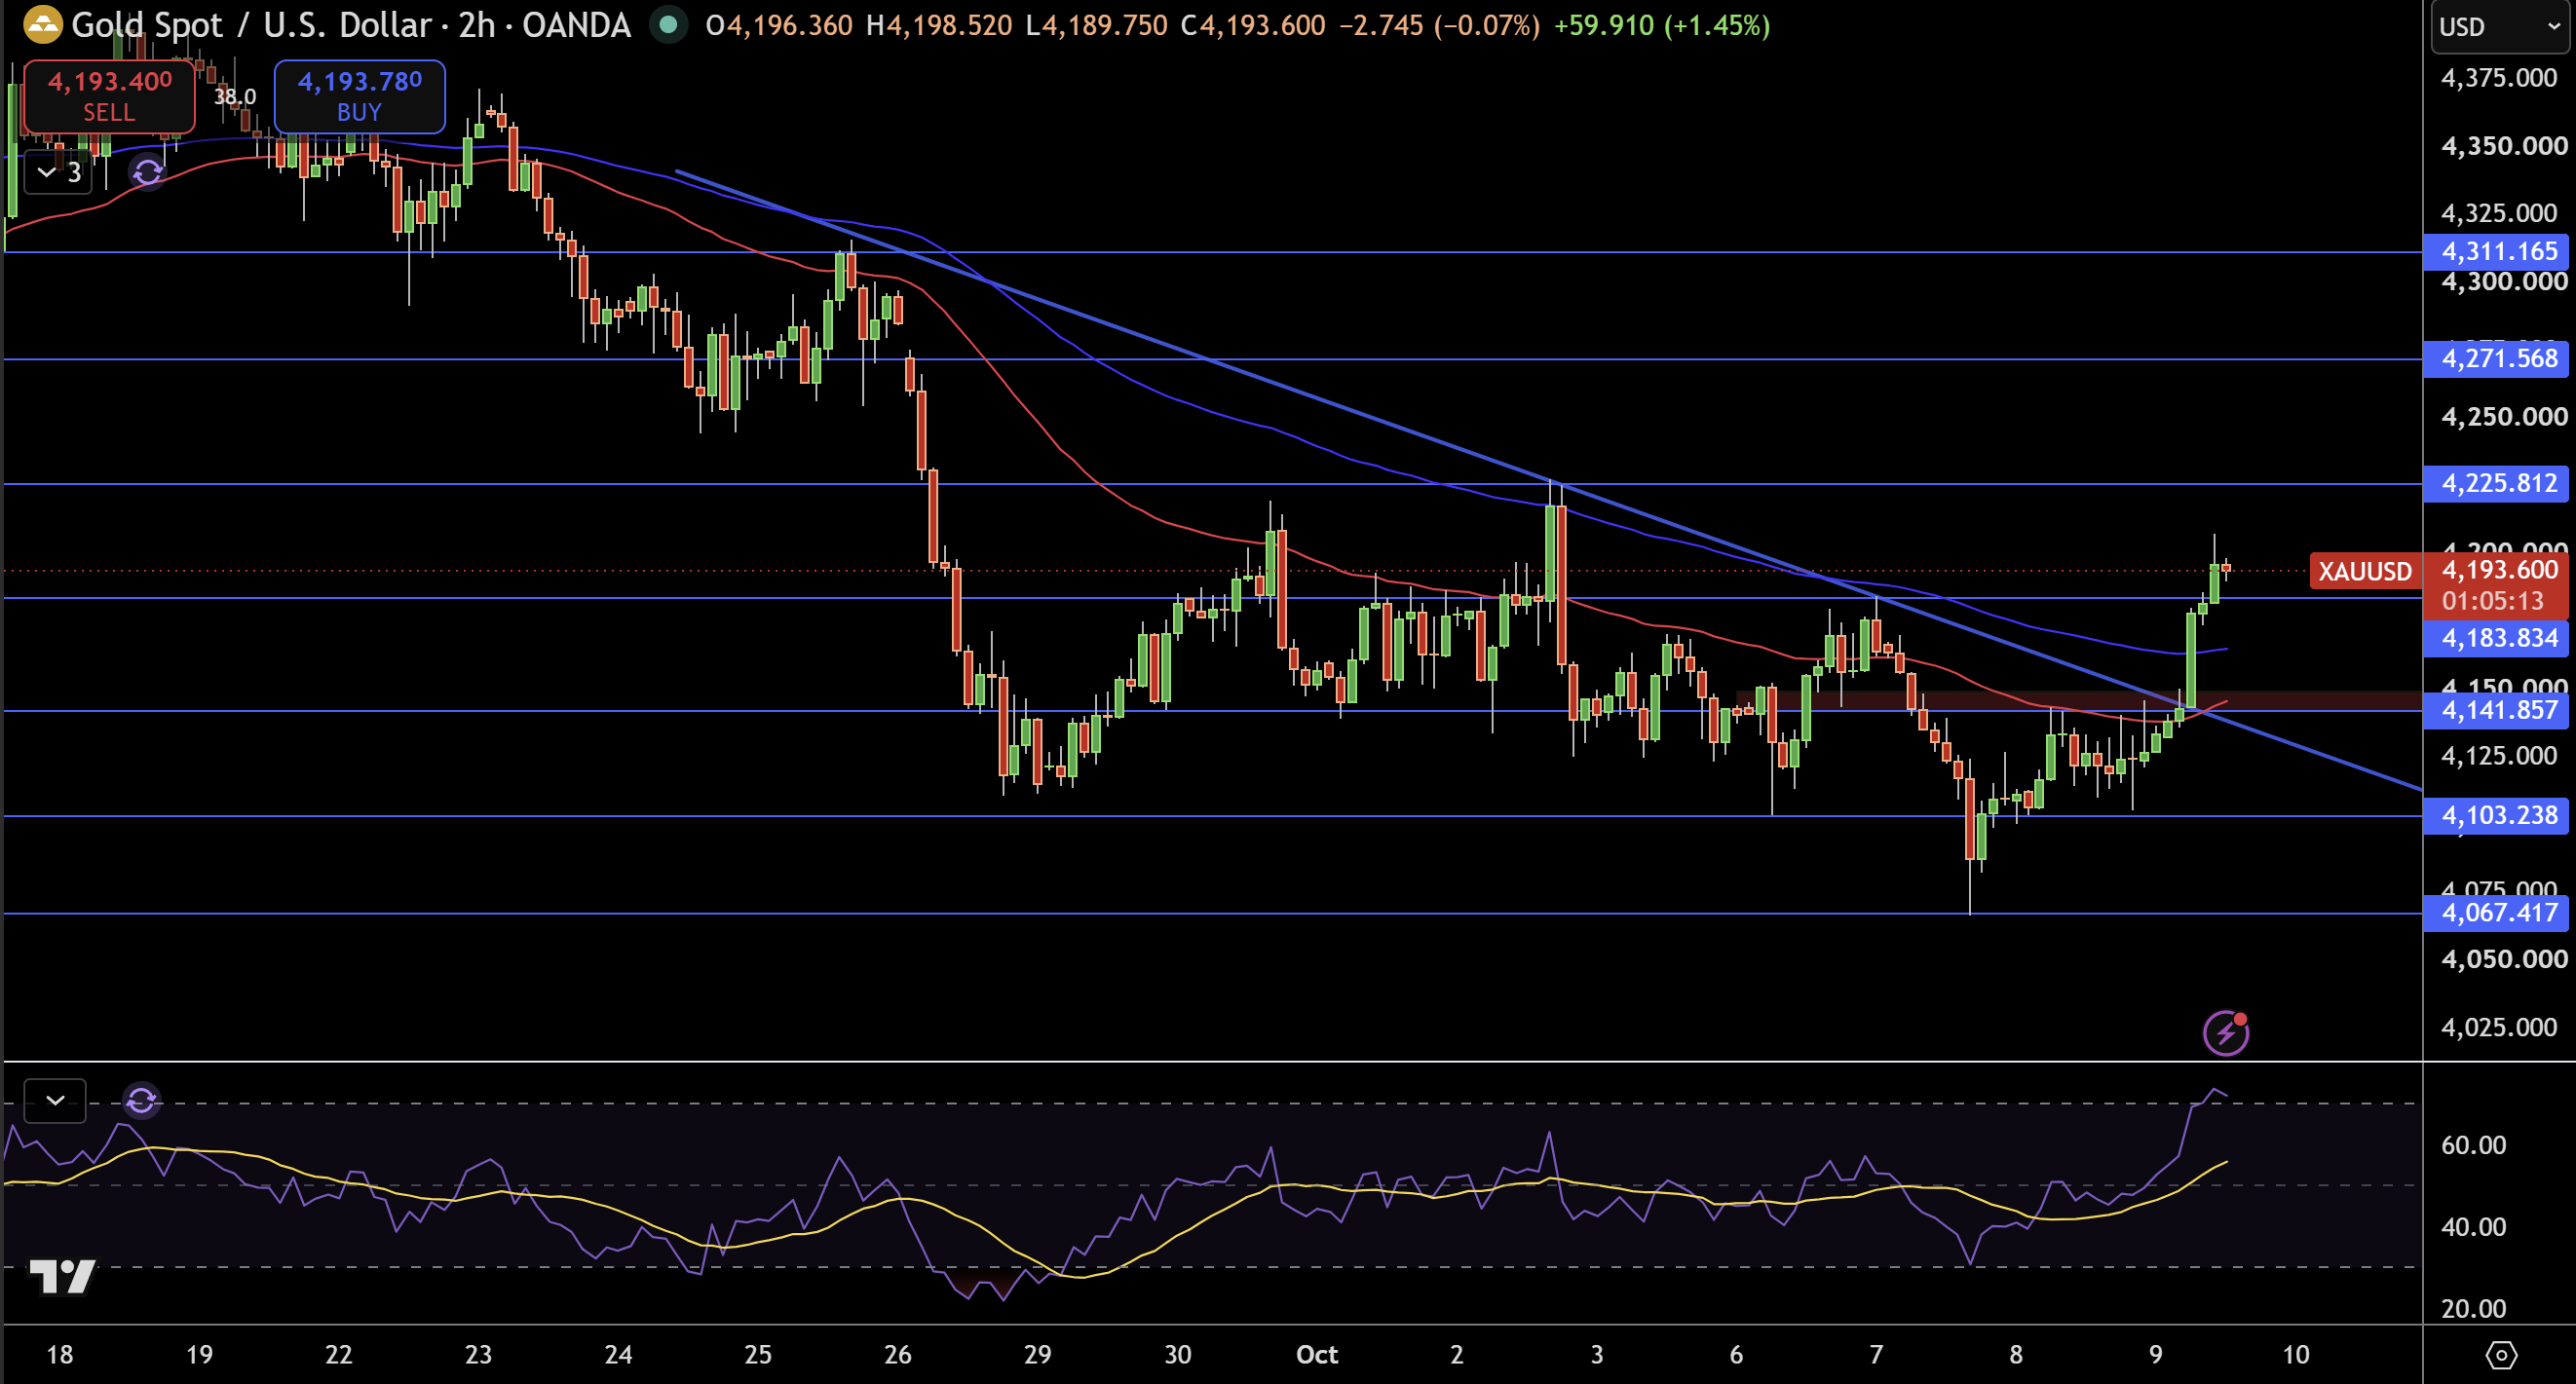
Gold is trading at $4,193.60 on the 2-hour chart, and what draws my attention is the convincing break above the descending trendline and the resistance level at $4,183.83. Additionally, price is trading above the short-term moving averages, which is an improvement in the structure after several weeks of lower highs.
The first resistance that I am focusing on is at $4,225.81. Once above that, the next resistances come in at $4,271.57 and $4,311.17. On the other hand, if the breakout fails, the support comes in at $4,183.83, then $4,141.86 and $4,103.24.
RSI has moved into the upper range, which indicates bullish momentum, but has stretched a bit too far, which indicates that a pullback could be on the cards. Overall, I’m bullish as long as gold stays above $4,183.83 and the descending trendline. A clear break above $4,225.81 would target the next resistance at $4,271.57. A break below $4,141.86 would negate the breakout.
Silver Technical Analysis: XAG/USD Reclaims $59.96 as $61.72 Becomes the Next Major Test
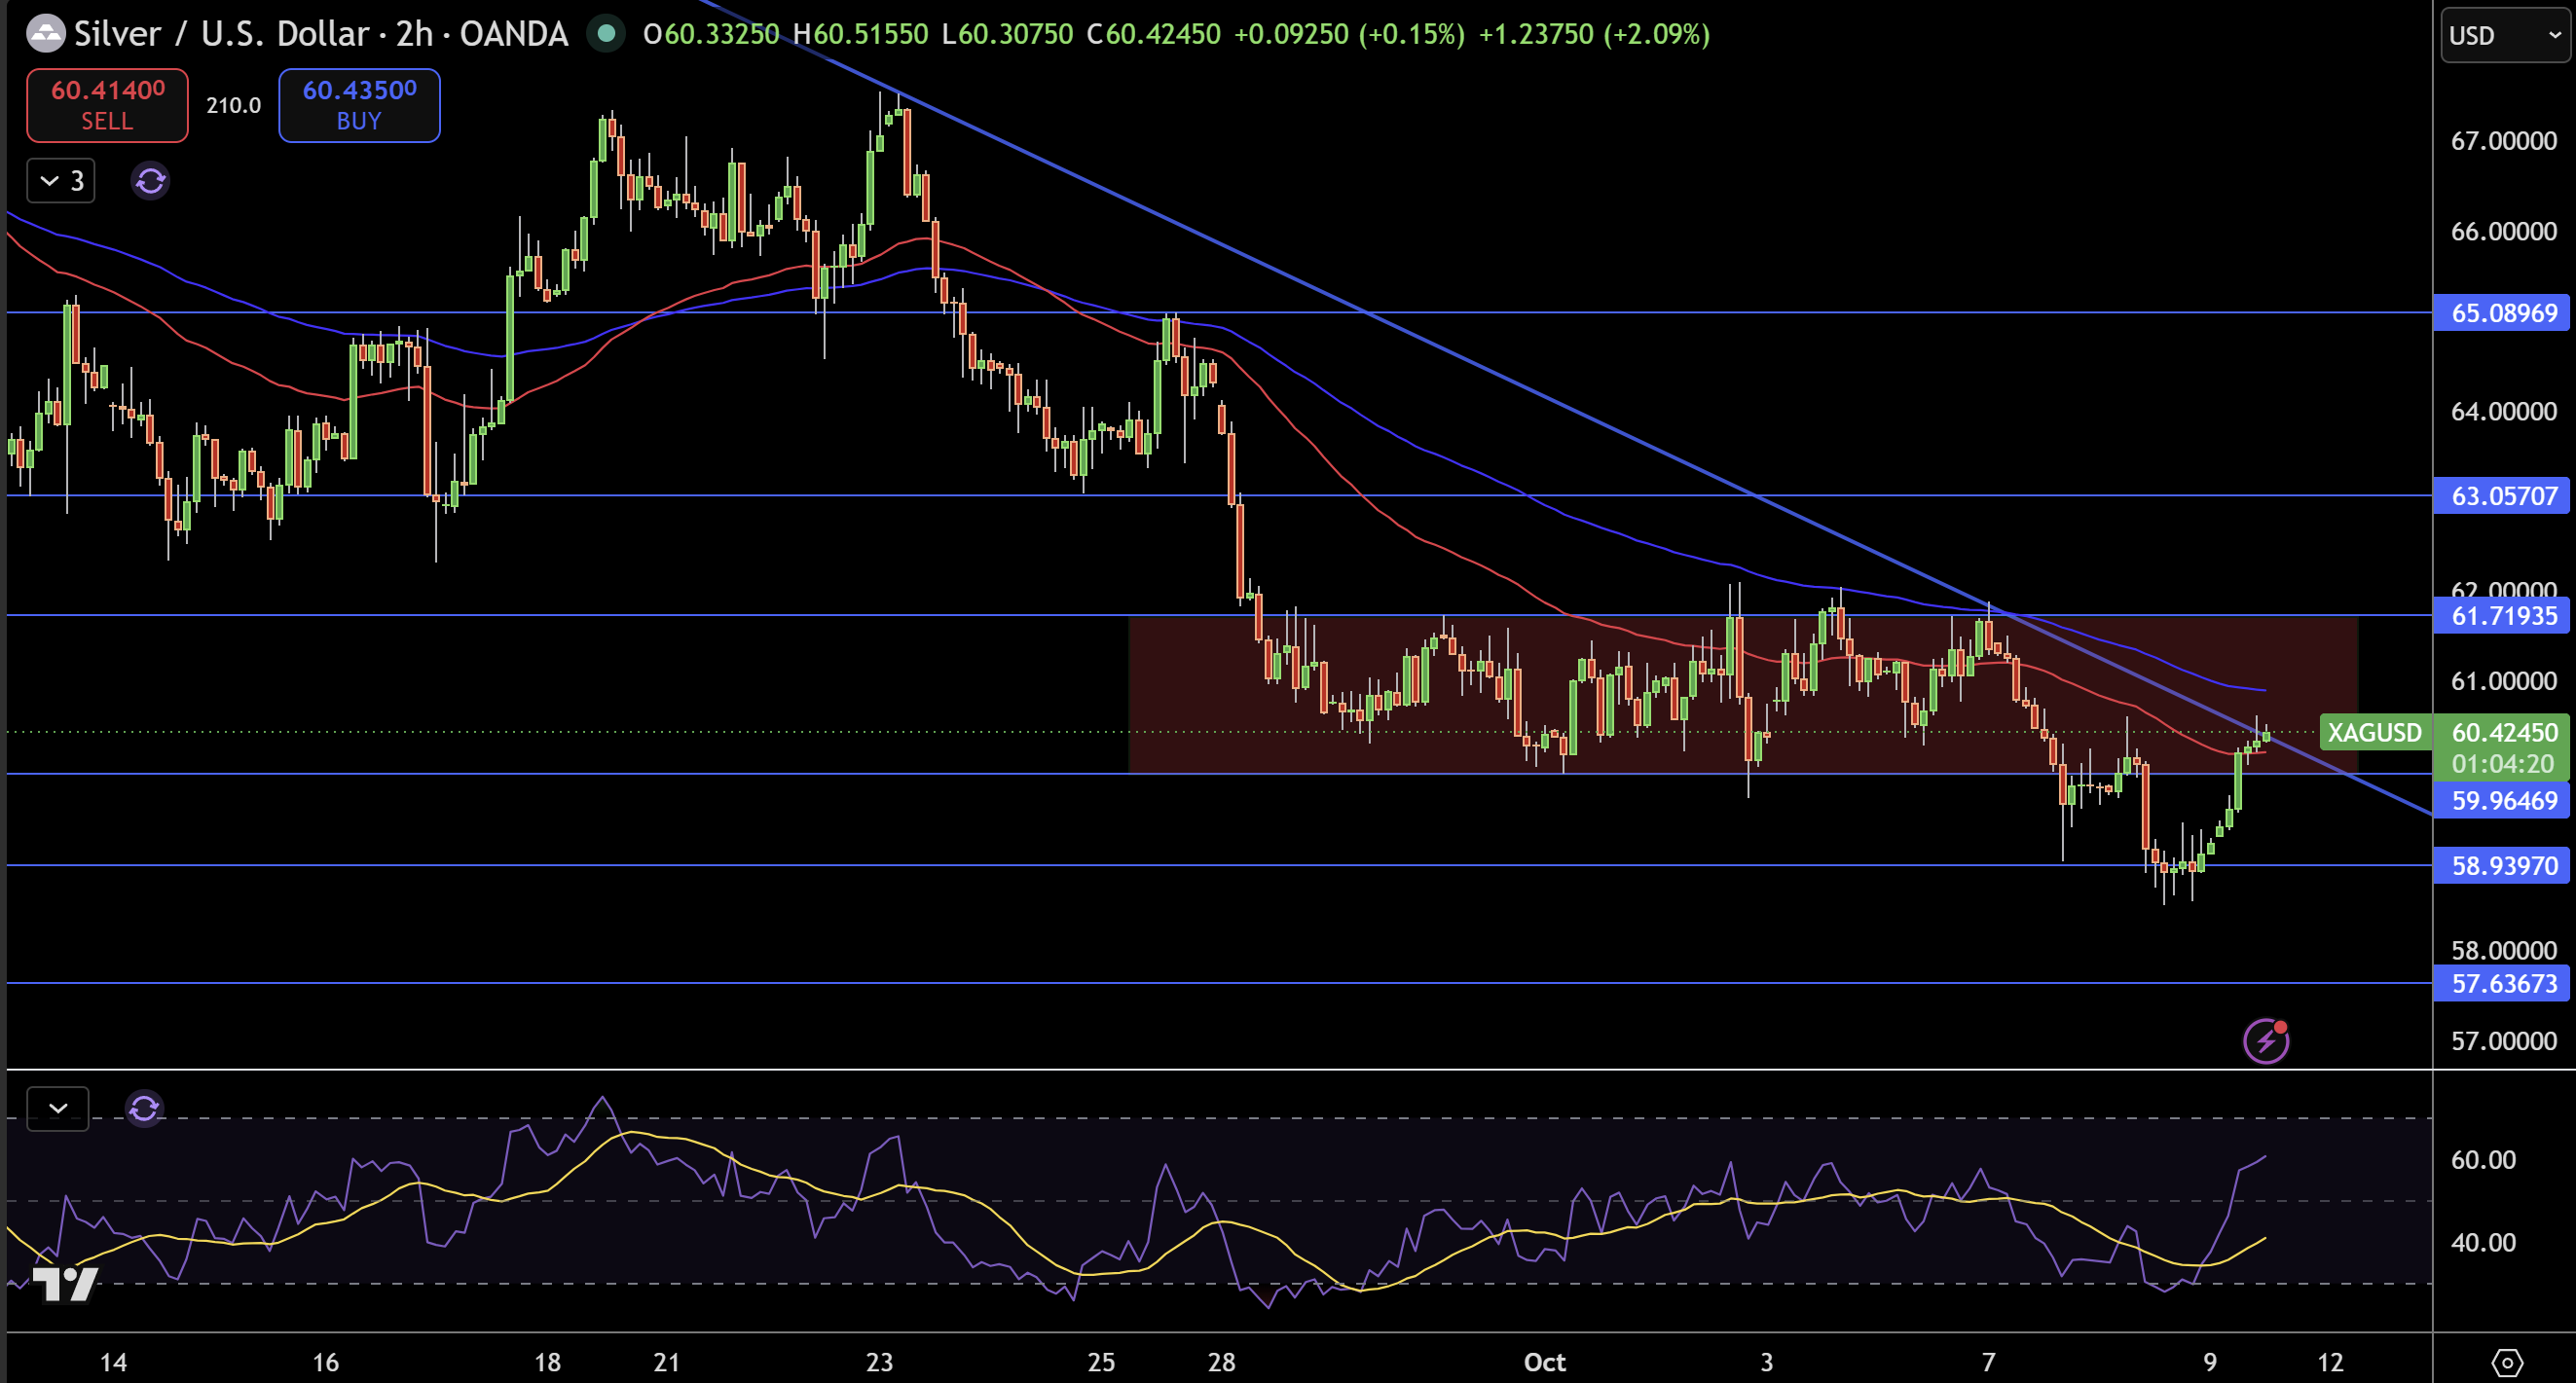
Silver is near $60.42 on the 2 hour chart, having bounced sharply from the $58.94 area. Price has reclaimed $59.96, and is now testing the downward sloping trendline. It’s a bullish sign that price has recovered to this area, but as long as silver is trading below the moving-average cluster, the structure remains bearish.
The first area of resistance is at $61.72. A close above this level would open up $63.06, followed by the $65.09 area. If the recovery loses steam, $59.96 would be the first area of support, with $58.94, and $57.64 following suit.
The Relative Strength Index (RSI) has recovered to the upper portion of its range, which means momentum is improving. I am currently neutral to slightly bullish, and would become more bullish with a 2-hour close above $61.72, with a break of $63.06 next. A move back below $58.94 would bring the trendline back into play and give the sellers control once again.