Double Bottom Breakout Signals Potential Trend Reversal
Amazon.com, Inc. (AMZN) confirmed a bullish reversal signal with a breakout from a double bottom pattern this week, advancing to a five-week high of $262.80. The advance suggests the bearish correction may have ended, with additional strength reflected in the reclaim of the 20-week moving average, as well as both the 20- and 50-period averages on the daily chart.
The recent higher swing low of $244.30 found support near the midline of a rising channel, and the subsequent recovery has left the upper boundary of the channel as a potential upside target. The rising 200-day moving average was also identified as support during the correction, although price did not reach it.

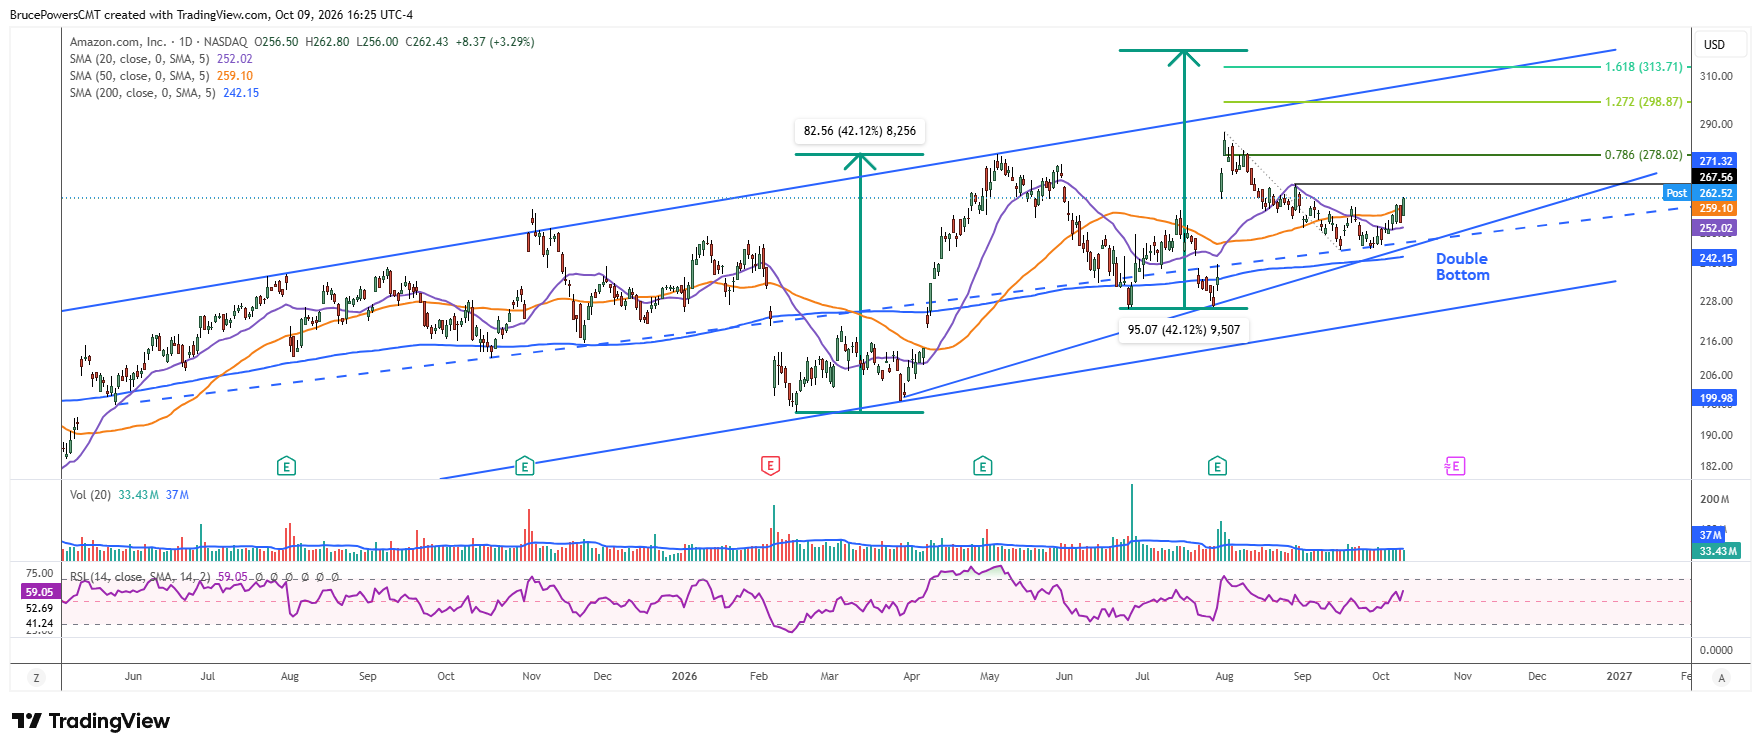
$267.56 Resistance Sets Next Test
The next decision point is the lower swing high at $267.56, which would be the next hurdle for the recovery. A sustained move above that level would put the peak of $287.20 in view as the next upside target zone. If buyers maintain control and price advances toward the upper boundary of the rising channel, the potential for higher targets would increase. As always, targets are potential reference points, not guarantees, and can help guide decisions as price develops.
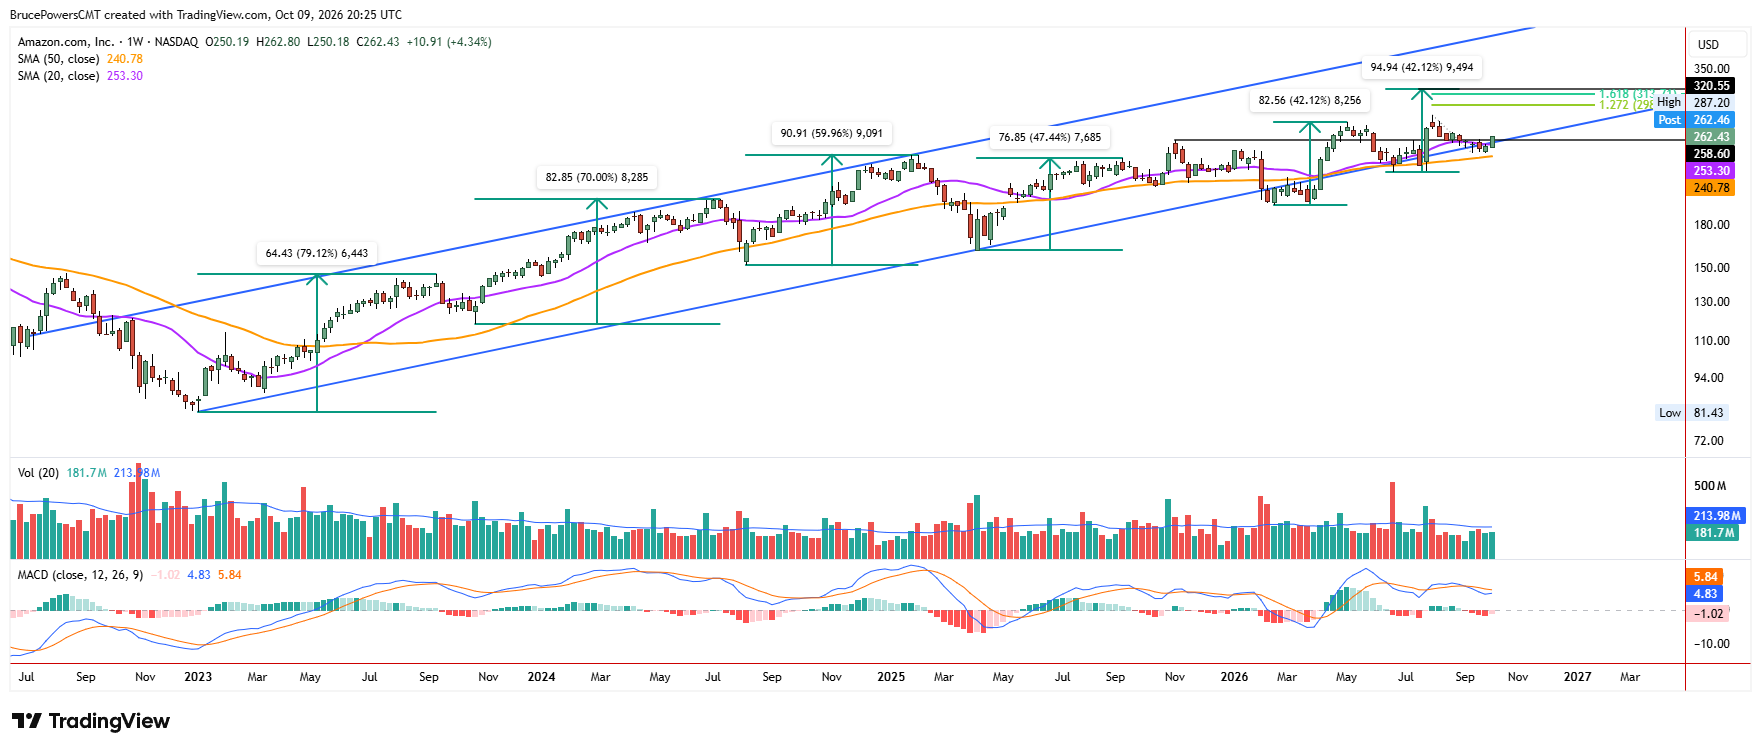
Weekly Channel Keeps Broader Uptrend in Focus
The rising channel on the weekly chart highlights the constructive long-term trend, characterized by higher swing lows and higher swing highs. Given this week’s bullish signal, a new leg higher may have begun, potentially leading to a retest of the record-high $287.20 area. However, key support needs to continue to hold at this week’s higher weekly low of $250.18, and further signs of strength are needed to reinforce the bullish outlook.
Historical Advances Point Toward $320
One way to estimate a potential upside target is to compare the current advance with prior rallies within the larger uptrend, beginning from the January 2023 low of $81.43. Since that low, five distinct larger advances have occurred, ranging from approximately 42% to 79%. The most recent advance measured from the February higher swing low was approximately 42%.
If the current advance matches that gain, AMZN would reach a potential target near $320.55. That projection offers a longer-term upside reference, while the $267.56 swing high and $287.20 peak remain nearer-term hurdles. The ability to overcome those levels while holding support near $250.18 will help determine whether the breakout can develop into another sustained advance.
If you’d like to know more about technical analysis and how traders use it, please visit our educational area.