Short-Term Support Holds as Resistance Nears
Natural gas held above a key short-term support zone for the third consecutive day on Friday, suggesting buyers retain underlying control following Thursday’s advance to a new high of $3.298. However, this sign of strength faces a resistance zone extending from Thursday’s high to the September high of $3.317, reinforced by the upper boundary of a rising trend channel. Support was established at Friday’s three-day low of $3.106, completing a 50% retracement of the preceding advance while testing the 200-day moving average.

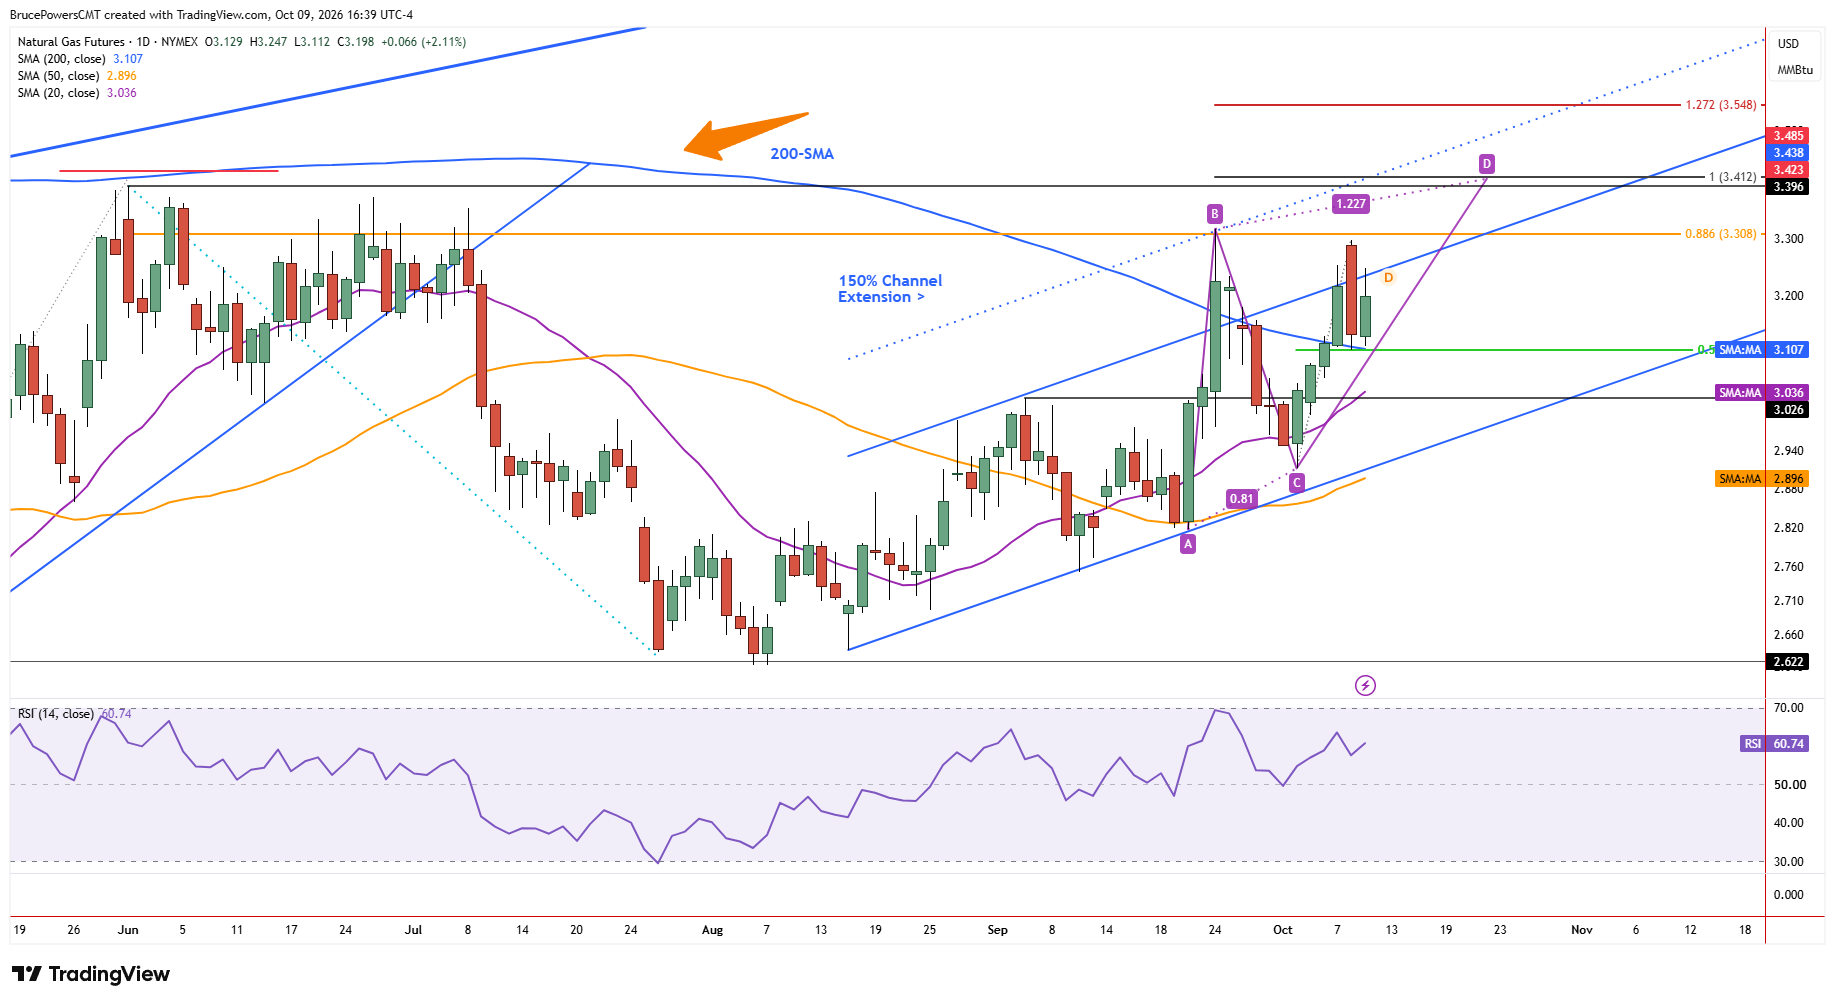
$3.11 Support Remains Critical to Bullish Outlook
This short-term bullish behavior may or may not lead to further gains, but the recovery and subsequent hold above a key long-term dynamic support line keep the door open to further upside. The moving average was recently reclaimed for a second time, strengthening its significance as a technical pivot. Further consolidation above the 200-day moving average, currently near $3.11, would preserve a bullish outlook. If this support fails, the rising 20-day moving average, now near $3.04, becomes the next key support test, alongside the earlier swing high of $3.026.
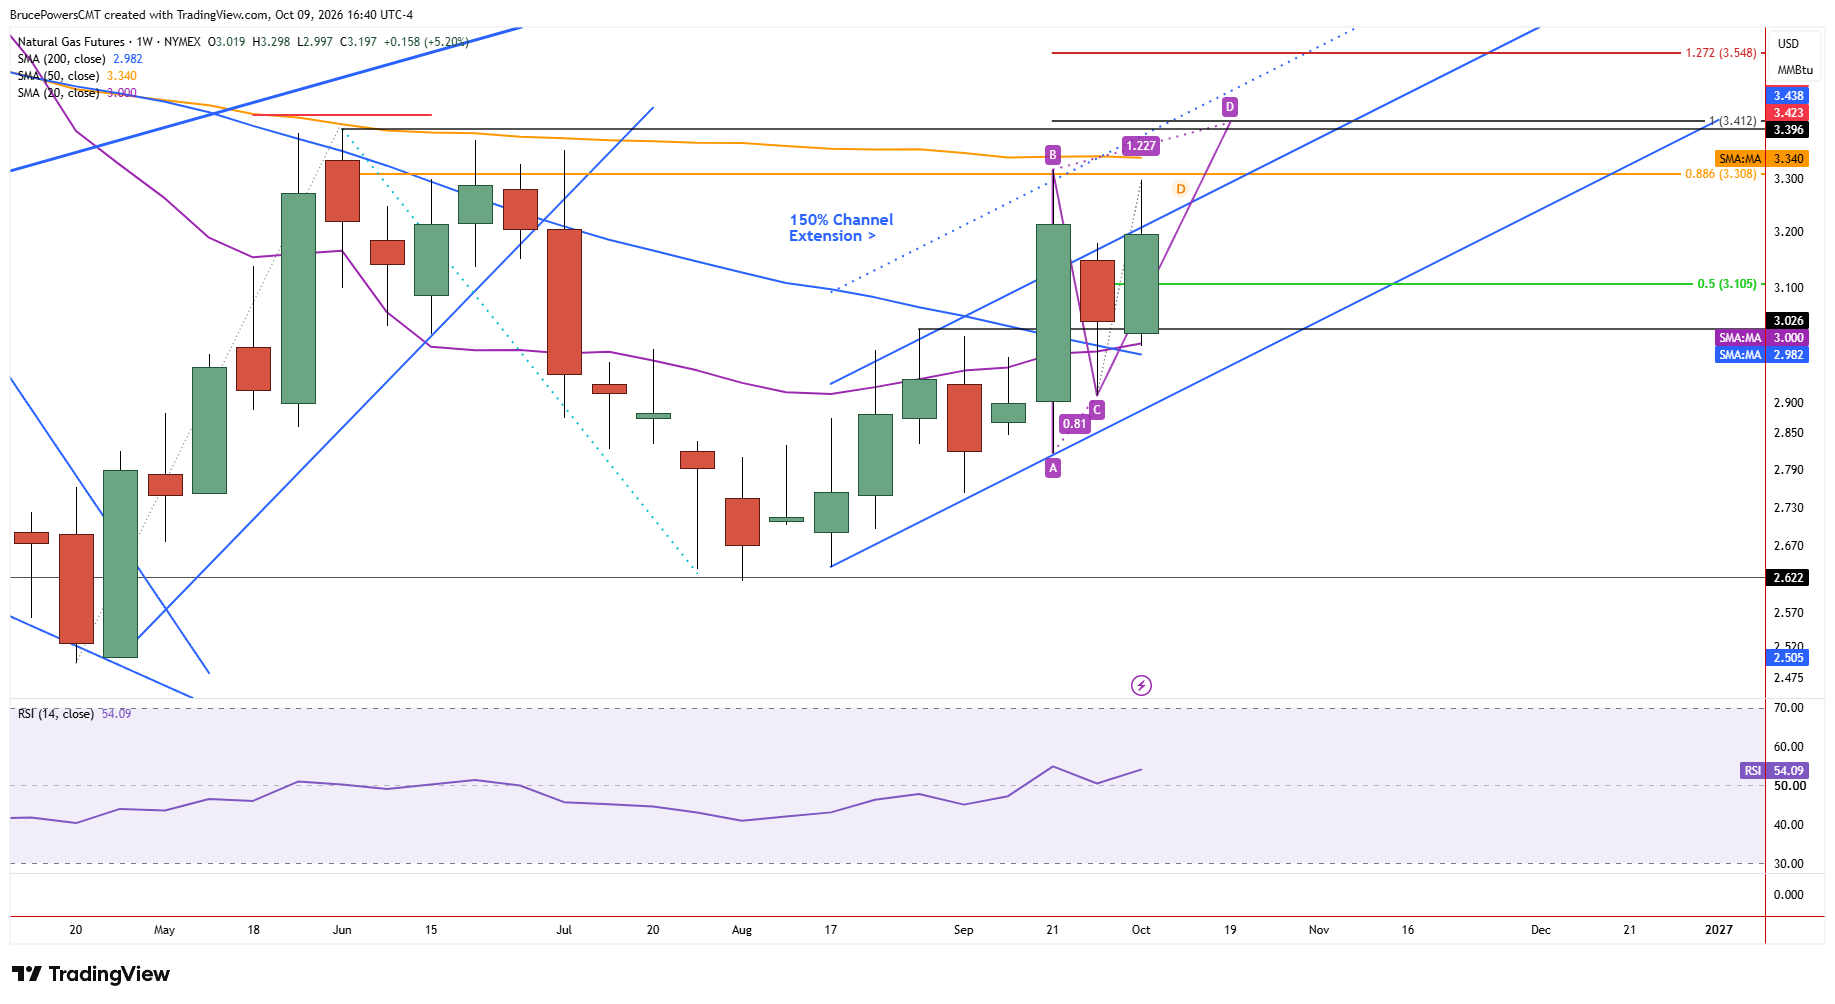
Weekly Chart Strengthens Bullish Case
The weekly chart also favors a bullish resolution to the pullback from Thursday’s high. A weekly continuation signal triggered this week when price rose above last week’s high of $3.18, with a weekly close above that level needed to confirm the signal. In addition, a bullish outlook is supported by this week’s higher low of $2.997, which marked a test of the 20-week moving average. This is the first full weekly range entirely above that moving average since late June, providing further evidence of improving strength.
$3.317 Resistance Is Next Upside Test
Additional confirmation would come from a weekly close above the closing price of $3.214 from two weeks ago, signaling further improvement in momentum. The 200-week moving average was also reclaimed this week, providing additional bullish technical evidence. Together, these developments suggest that natural gas may be positioning for another attempt at resistance between $3.298 and $3.317, although sustained support above the 200-day moving average remains important to the bullish outlook.
If you’d like to know more about how to trade natural gas, please visit our educational area.