
SP500 Moves Higher Despite Weaker-Than-Expected Consumer Sentiment Data
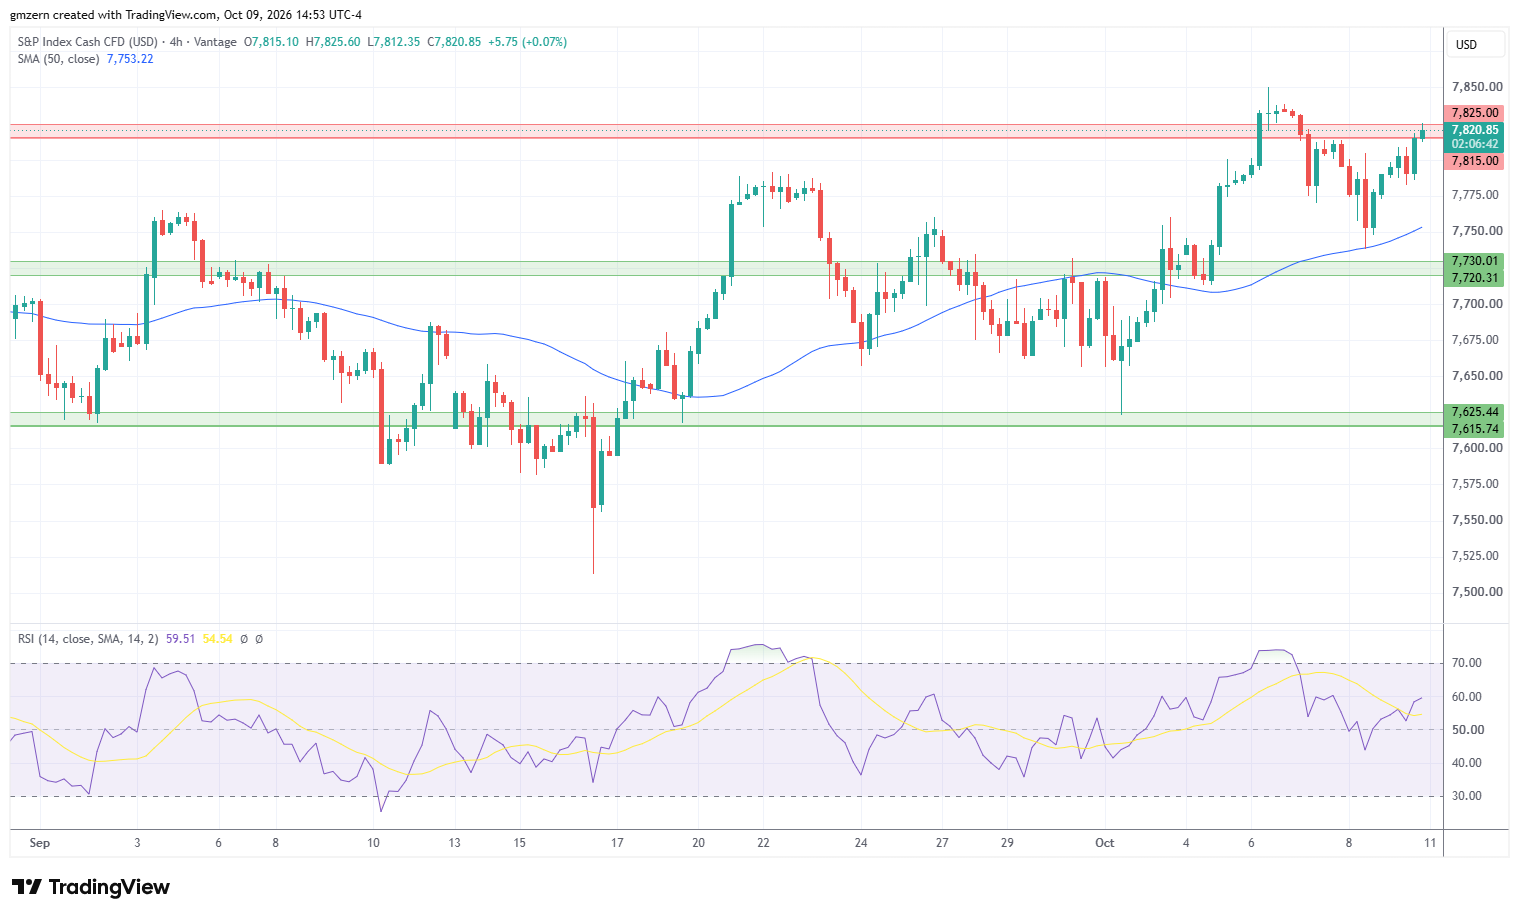
SP500 gains ground as traders focus on the Michigan Consumer Sentiment report and focus on the rebound in the AI sector.
Michigan Consumer Sentiment decreased from 48.1 in September to 46.3 in October, compared to analyst forecast of 47.6. Current Economic Conditions declined from 50.9 to 44.7, while Index of Consumer Expectations improved from 46.3 to 47.3.
Year-ahead inflation expectations increased from 4.6% in September to 4.7% in October. Long-run inflation expectations grew from 3.4% to 3.5%. According to the report, consumers were worried about the cost of living.
Oil prices were mostly flat as President Trump announced that Russia will immediately supply over 300,000 tons of diesel to U.S. and global markets. According to Trump, Russia will supply 500,000 tons in November and 1,000,000 tons thereafter. The deal with Russia was made during a call with Russia’s President Putin.
Treasury yields gained some ground as traders remained worried about inflation. The yield of 2-year Treasuries climbed towards the 4.79% level, while the yield of 10-year Treasuries settled near 5.25%.
Consumer cyclical and healthcare stocks were among the biggest gainers today. Communication services stocks found themselves under pressure.
Currently, SP500 is trying to settle above the resistance at 7815 – 7825. In case this attempt is successful, SP500 will move towards recent highs near the 7850 level. If SP500 climbs above 7850, it will head towards the 7900 level. RSI is in the moderate territory, so there is plenty of room to gain momentum in the near term.

NASDAQ Gains Ground As Traders Buy Tech Stocks After Yesterday’s Pullback
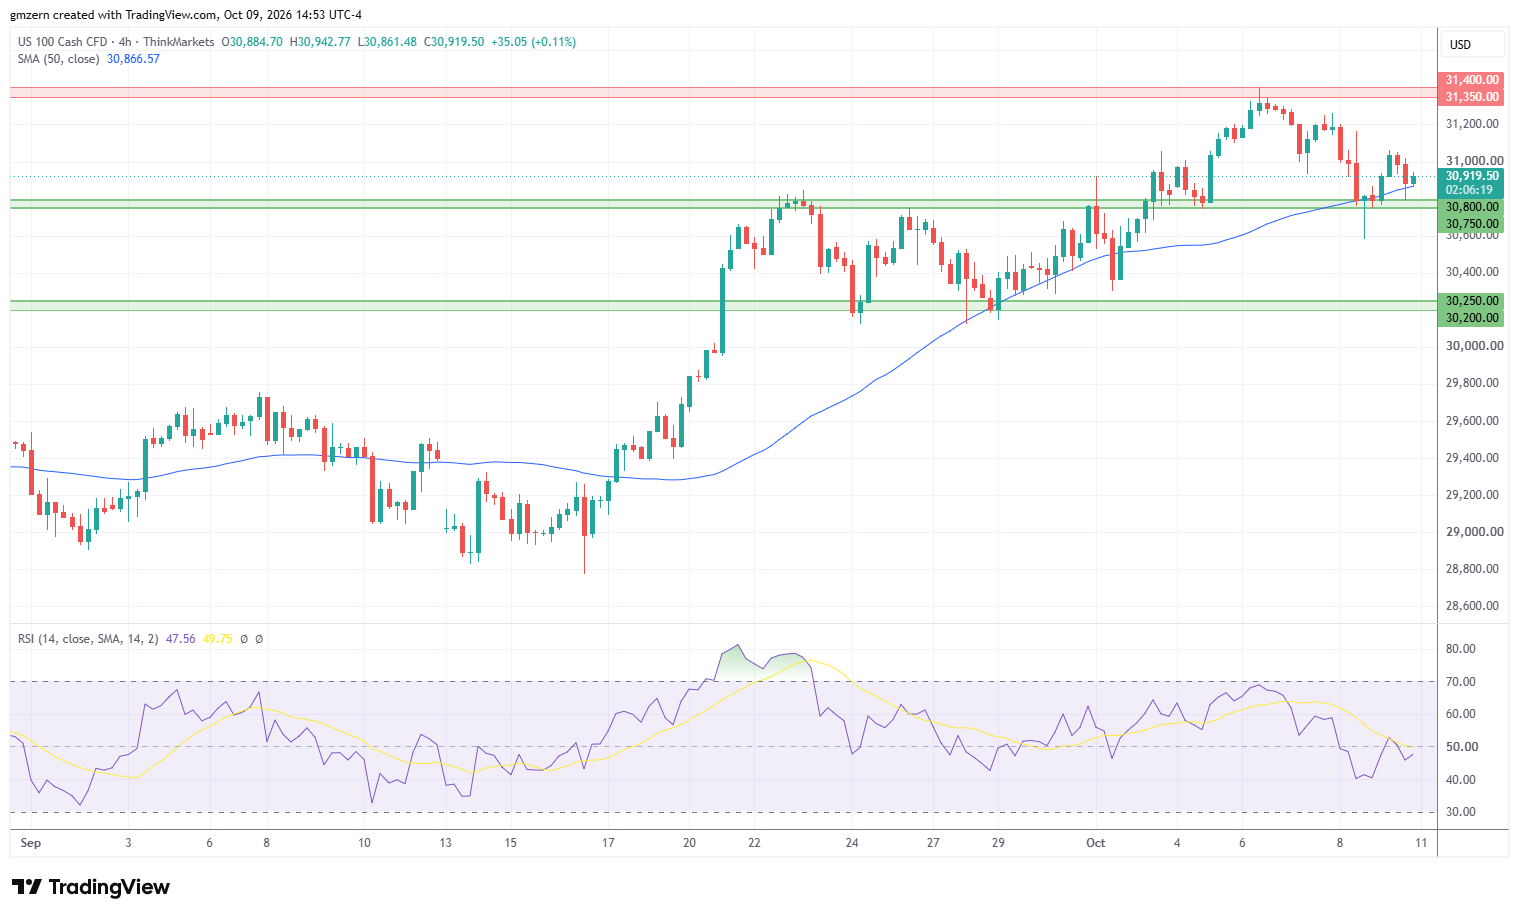
If NASDAQ stays above the 50 MA at 30,866, it will head towards the 31,000 level. A move above 31,000 will open the way to the test of the next resistance, which is located in the 31,350 – 31,400 range.
On the support side, the nearest support level for NASDAQ is located in the 30,750 – 30,800 range. If NASDAQ manages to settle below the 30,750 level, it will head towards the next support at 30,200 – 30,250.
Dow Jones Price Forecast
Every new Dow Jones analysis as it publishes, today's technical signal and key levels, live price — on one page.
See all Dow Jones forecastsDow Jones Tests Resistance At 51,600 – 51,700
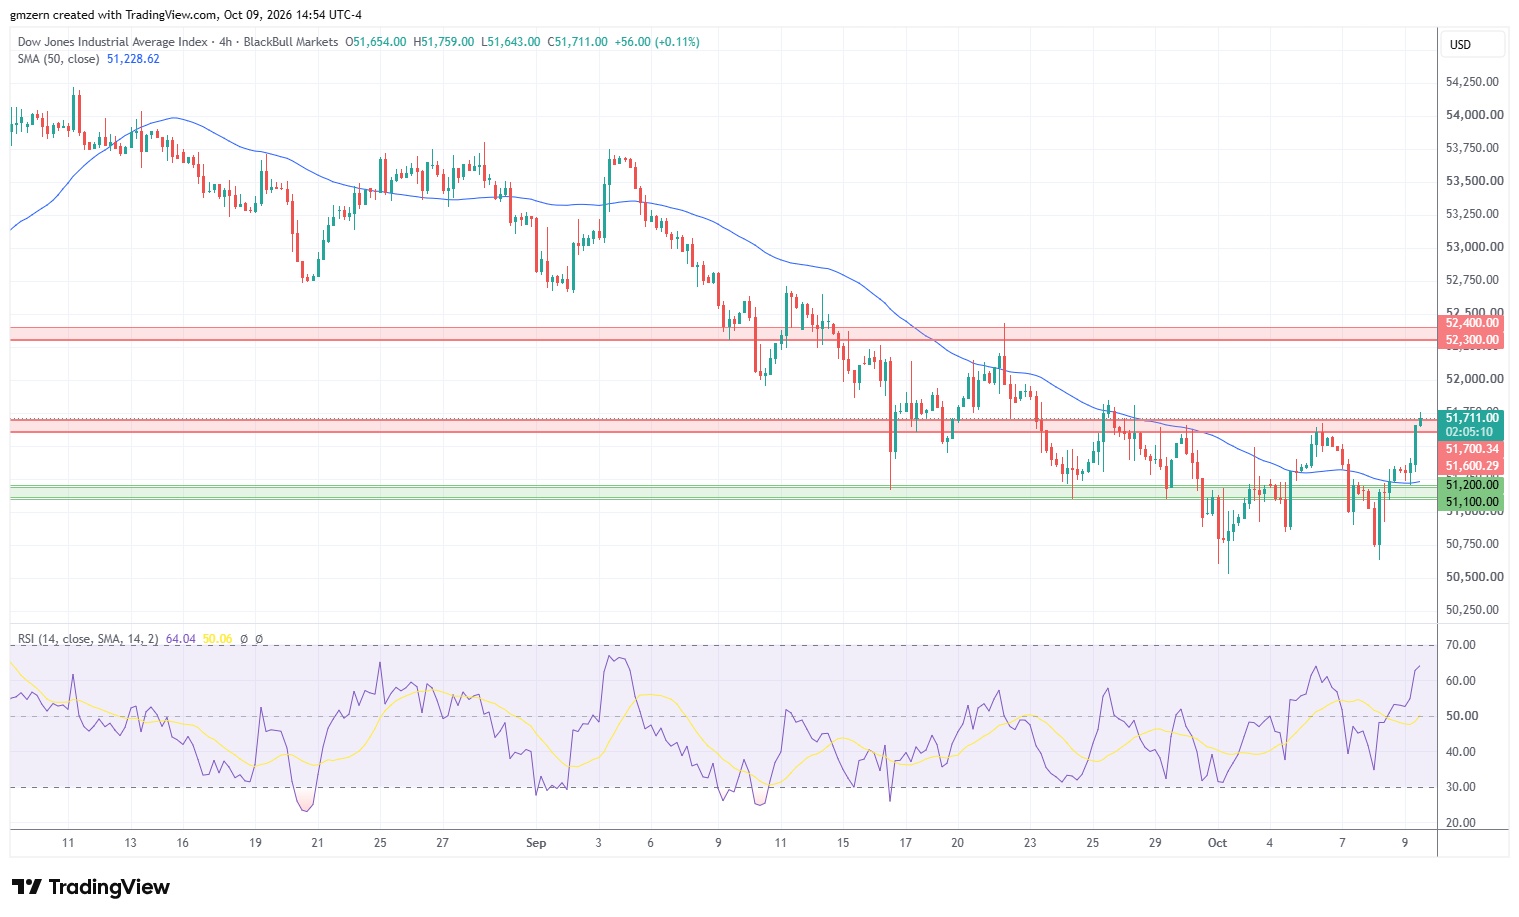
Dow Jones gained ground amid rising demand for healthcare and financial stocks. Amazon, which was up by +3.3%, was the best performer in the Dow Jones index today.
From the technical point of view, Dow Jones attempts to settle above the resistance level at 51,600 – 51,700. If Dow Jones manages to settle above the 51,700 level, it will head towards the next resistance, which is located in the 52,300 – 52,400 range.
On the support side, a move below the 51,500 level will push Dow Jones towards the support level at 51,100 – 51,200. If Dow Jones declines below the 51,100 level, it will head towards recent lows near the 50,500 level.
For a look at all of today’s economic events, check out our economic calendar.