The S&P 500 closed lower on Friday after strong U.S. job growth increased expectations of a rate hike in September. The latest trade and semiconductor tariff threats by Trump added more uncertainty, while investors turned their attention to the upcoming inflation data. The gains in semiconductor and energy stocks helped limit the broader losses. In my view, the outlook for US stocks remains uncertain in the short term. But the broader technical structure stays bullish as long as the index holds above 7,620. This article presents the main tariff risks, economic catalysts, sector movements and technical levels that could shape the move in S&P 500.

Trump Tariffs and Semiconductor Duties Raise S&P 500 Risks
President Donald Trump said on Friday that he could stop trading with countries where the United States runs a trade deficit unless the Federal Reserve lowers interest rates. He said that high rates put the U.S. at an unfair disadvantage. The sentiment came after the solid jobs report pushed the market toward expectations of higher interest rates. The tensions between trade and monetary policy could increase volatility in U.S. stocks.
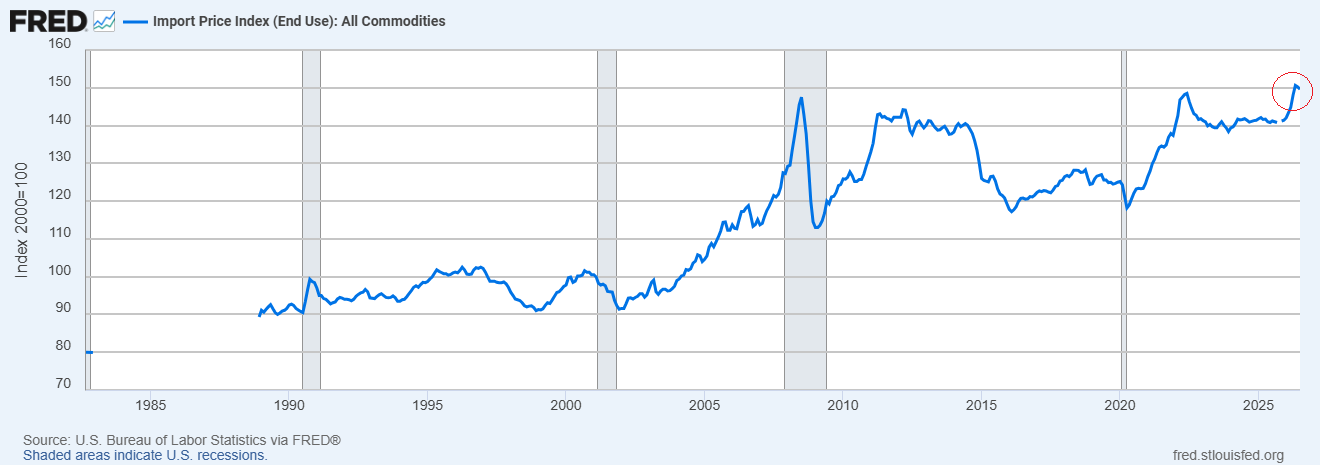
The threat puts the S&P 500 in a difficult situation. New tariffs or more extensive trade restrictions could increase the price of imports. These costs can be borne by the companies through reduced profit margins or by consumers through higher prices. This would contribute to inflation in the future and make it difficult for the Fed to cut rates. In my view, the market will remain sensitive until investors know whether Trump’s remarks will actually result in some type of policy changes. The chart below shows that businesses already face elevated import costs while new tariffs could add further pressure
Trump administration also has a new tariff course of action ready for semiconductor imports. Commerce Secretary Howard Lutnick said that the chip makers based in the U.S. may be able to avoid the duties. Companies that involve production overseas may face tariffs to make their products available in the United States. These measures may also include laptops, gaming consoles and data center servers.
On Friday, South Korea said that the current talks with Washington include investment in semiconductors. The chip manufacturers are crucial for expanding U.S. artificial intelligence infrastructure. Tariff relief might lead to greater domestic production. But new factories may not be in place in time to prevent duties on foreign chips from driving up costs for technology and data center firms.
S&P 500 Price Forecast
Every new S&P 500 analysis as it publishes, today's technical signal and key levels, live price — on one page.
See all S&P 500 forecastsStrong US Jobs Report Raises September Fed Rate Hike Odds
The U.S. economy created 162,000 jobs in August. The market had been expecting only 56,000 jobs. The unemployment rate stayed at 4.1% as expected. The robust report gives the Fed more room to focus on inflation. Fed Chair Kevin Warsh already has price stability as his primary goal. The report was the most volatile of the month but it still shifted the Fed’s focus to inflation.
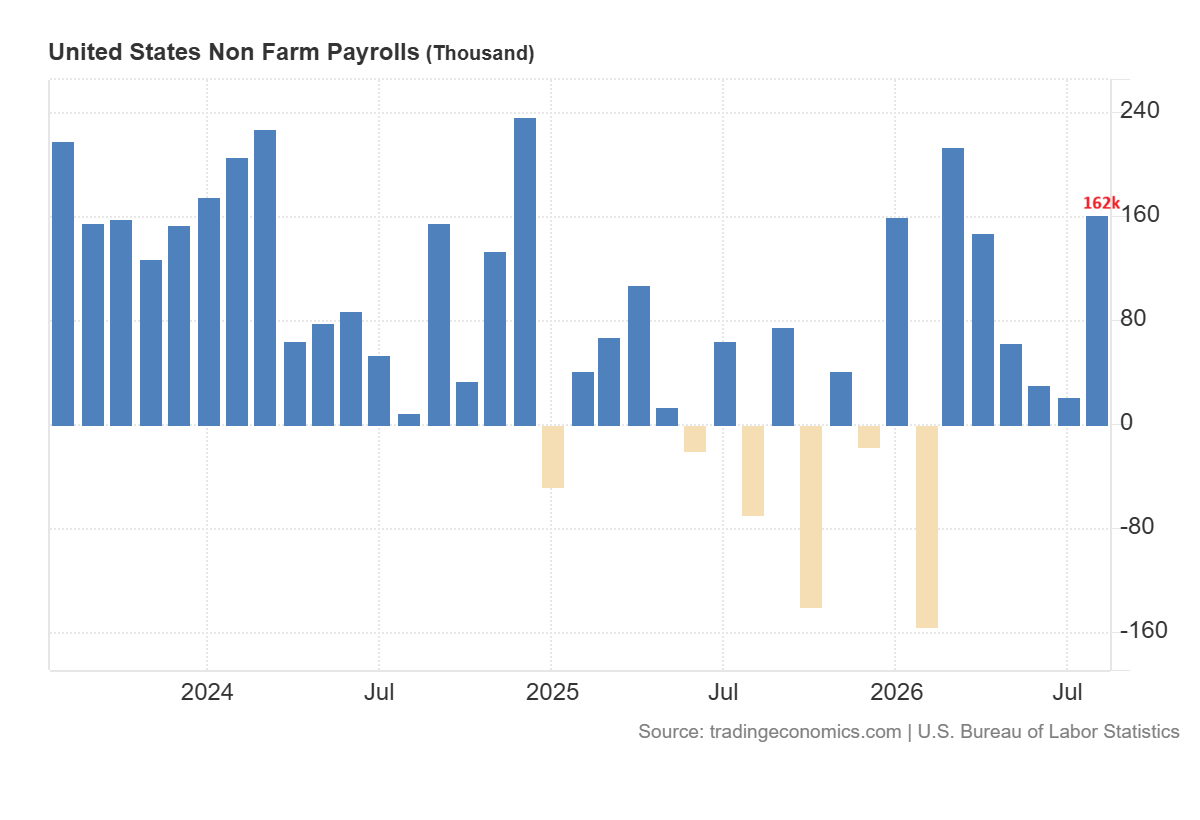
The odds of a rate increase at the Sept. 15-16 meeting are 60% as per the FedWatch tool. The Dow Jones dropped over 400 points on Friday and closed at 45,208. The S&P 500 lost 0.38% to 7,713. In my view, the drop in US stocks after the US jobs data was a knee-jerk reaction and not a final opinion. The week was volatile with economic data, earnings and Fed Governor Christopher Waller’s remarks swinging back and forth on rate expectations.
Energy and Semiconductor Stocks Support the S&P 500
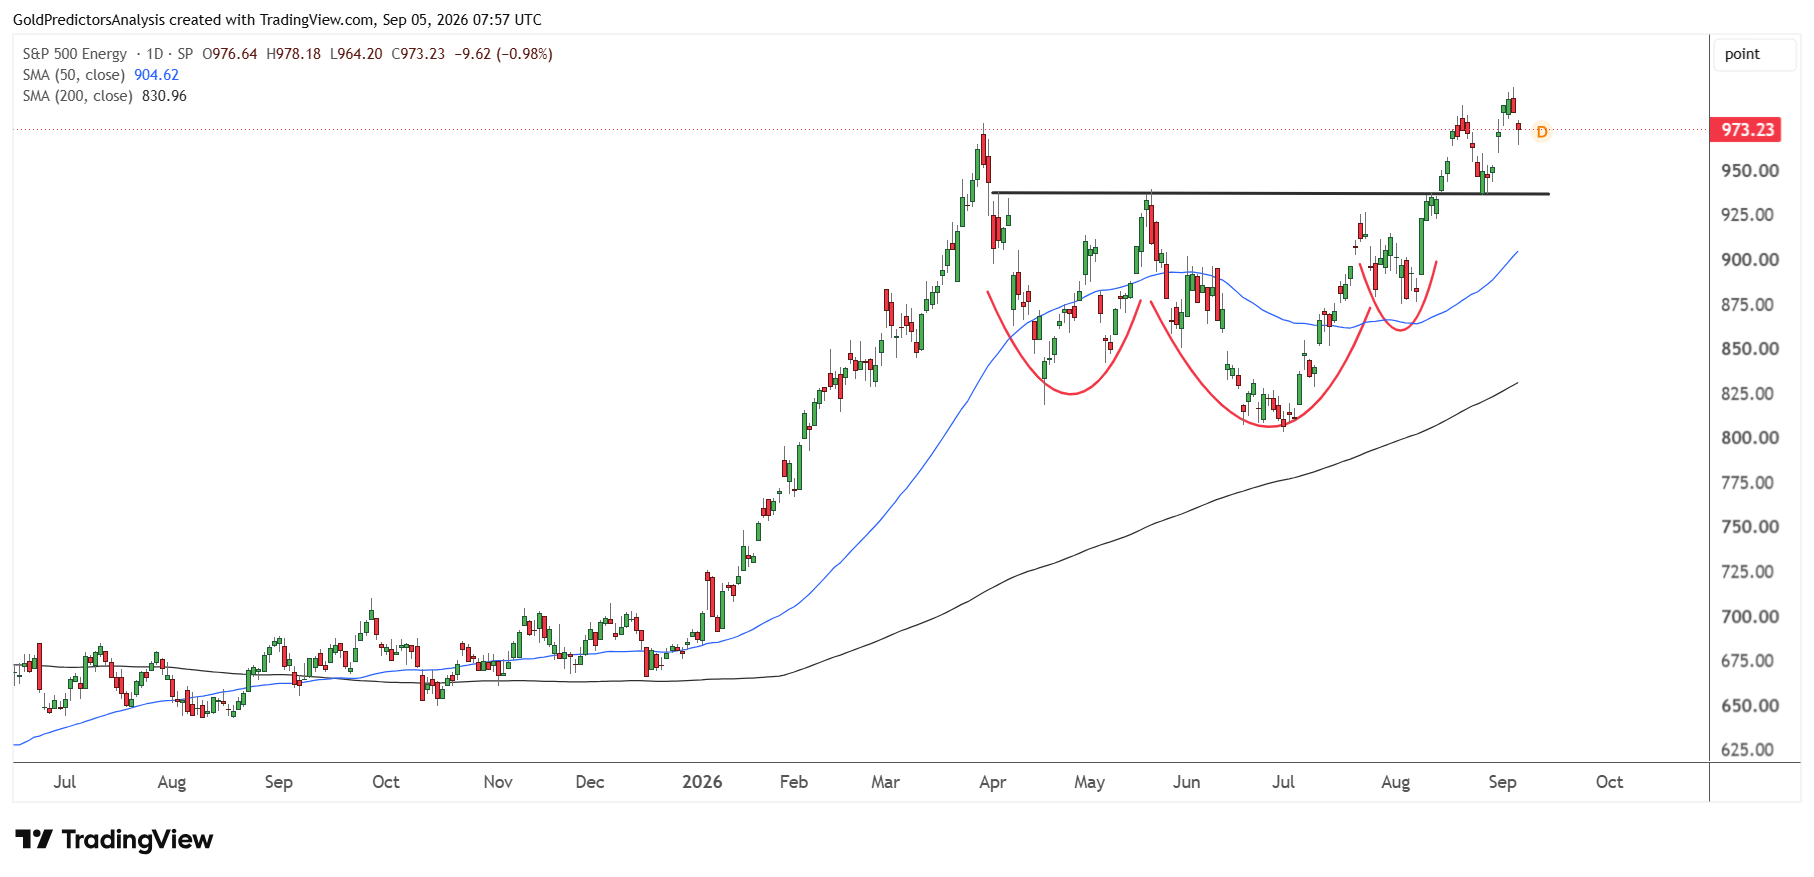
Energy and utilities stocks climbed, while consumer discretionary stocks dropped. This pushed the S&P 500 lower. However, utility stocks remain slightly weak as the S&P 500 utility index remains in a negative trend in the short term. But the S&P 500 energy index remains in a strong bullish trend and forms a positive price structure using the inverted head and shoulders as seen in the chart below.
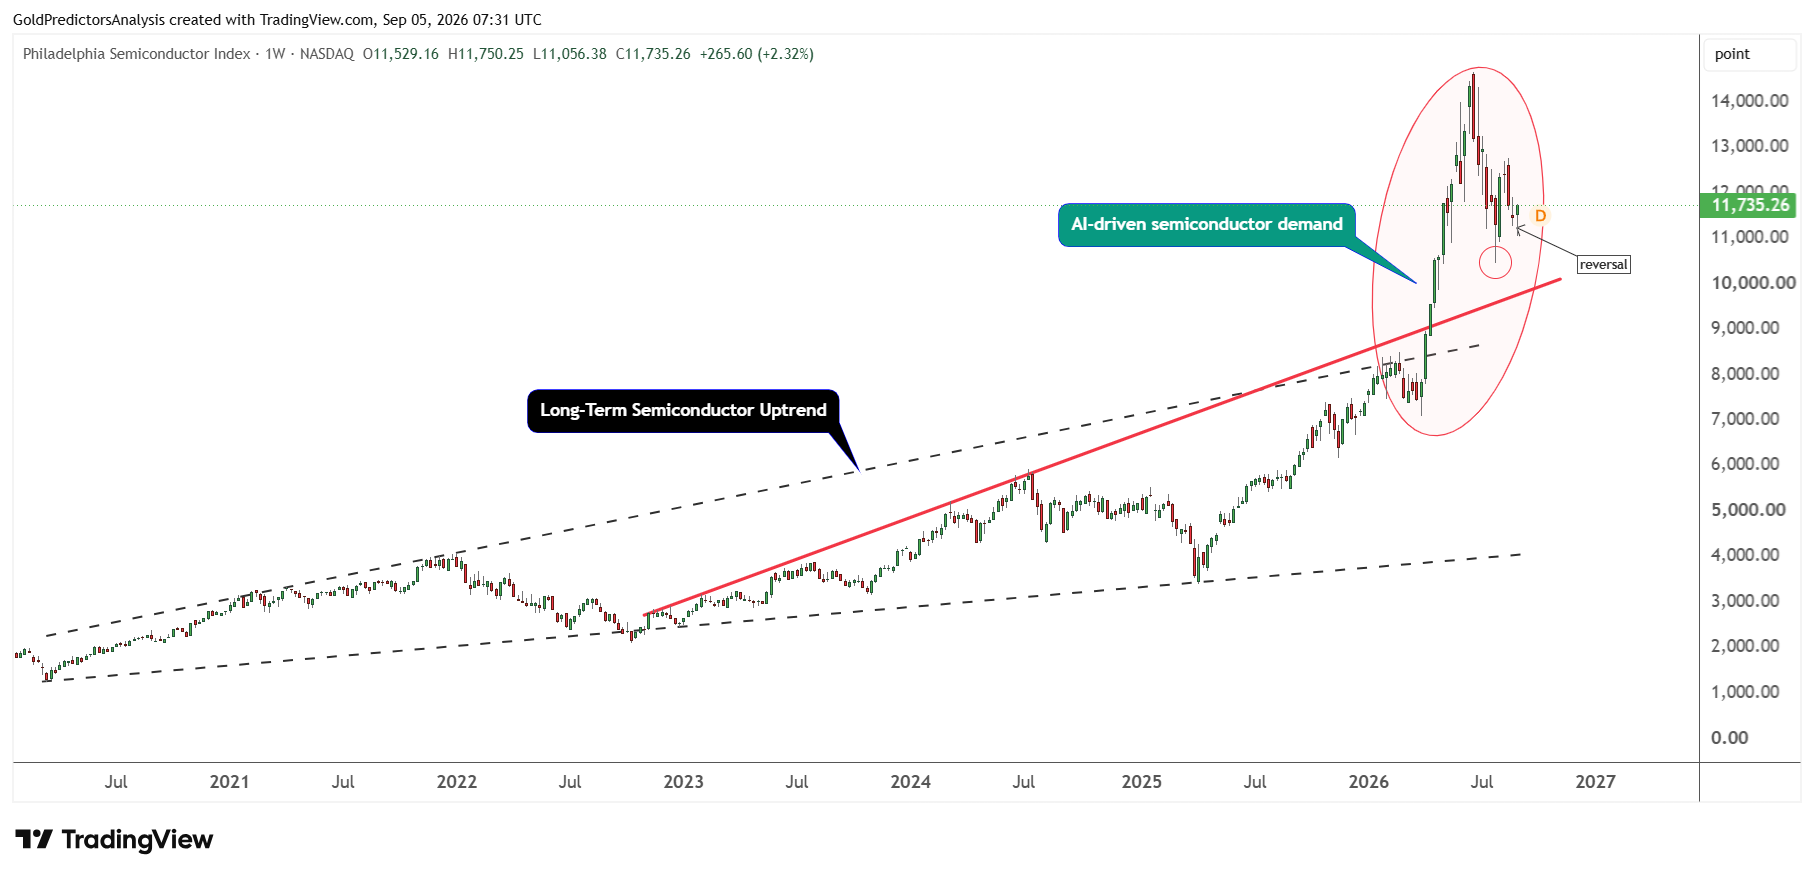
The PHLX Semiconductor Index gained 2.32% last week and produced a key reversal candle. This reversal within the strong positive structure indicates a strong surge in semiconductor stocks in the short term.
Company Losses and Inflation Data Keep Investors Cautious
Lululemon dropped over 16% on Friday following a drop in the revenue and profit outlook for the full year. The stock price of Adobe also dropped over 6% after longtime CEO Shantanu Narayen announced that company insider Anil Chakravarthy would replace him. The mortgage companies, which were established by Congress, help the U.S. housing market. Fair Isaac dropped over 15%, TransUnion dropped over 6% and Equifax was down over 6%.
Investors are also getting ready for Labor Day weekend with September’s poor seasonal performance looming. The market now focuses on the CPI and PPI readings. The softer readings could reduce the rate hike prospects and bring the index back up. Hot inflation readings would strengthen the bearish case and increase the risk of further losses.
S&P 500 Technical Analysis: 7,620 Support Keeps 8,000 in Focus
From a technical perspective, the S&P 500 remains in a strong bullish trend as seen in the daily chart below. The chart shows the formation of an inverted head and shoulders pattern in Q1 2025 and then the emergence of an ascending broadening wedge pattern from July 2025. The price also formed V-shaped recovery pattern in March 2026, followed by a price compression pattern in June and July 2026.
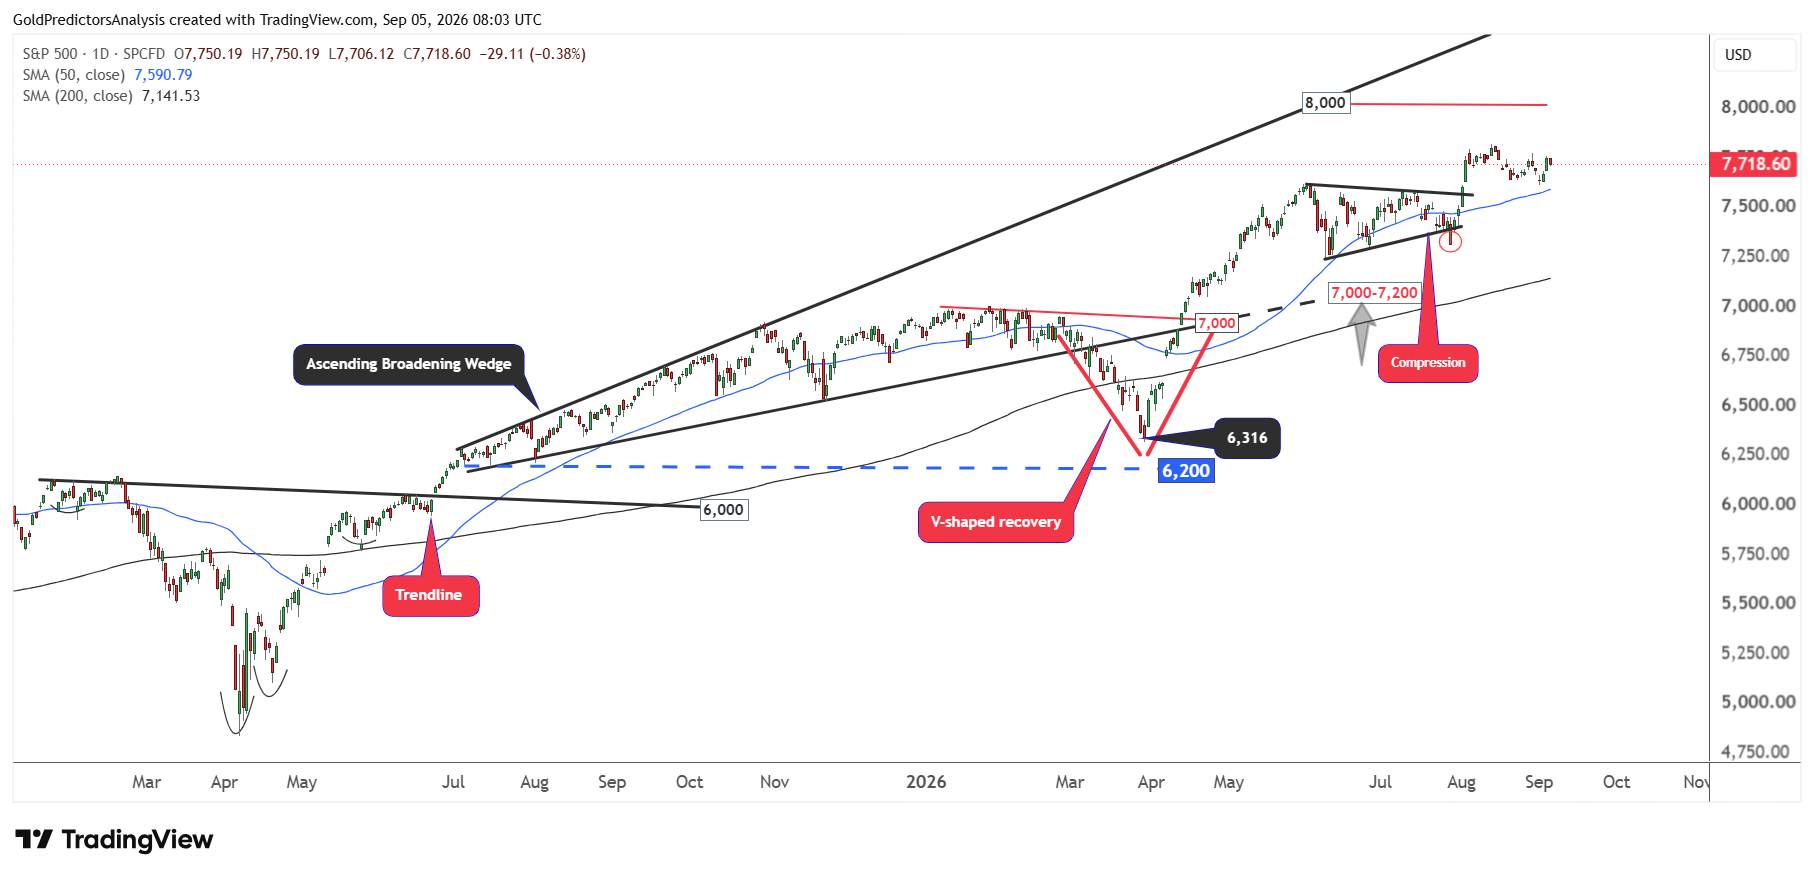
This price structure since 2025 indicates sustained and positive price action and targets higher levels. The index has been consolidating above the 50- and 200-day SMAs and continues to show positive momentum. This positive momentum may push the S&P 500 toward the immediate resistance at the 8,000 level in the short term. A break above the 8,000 level will open the way for further upside toward the 8,500 level.
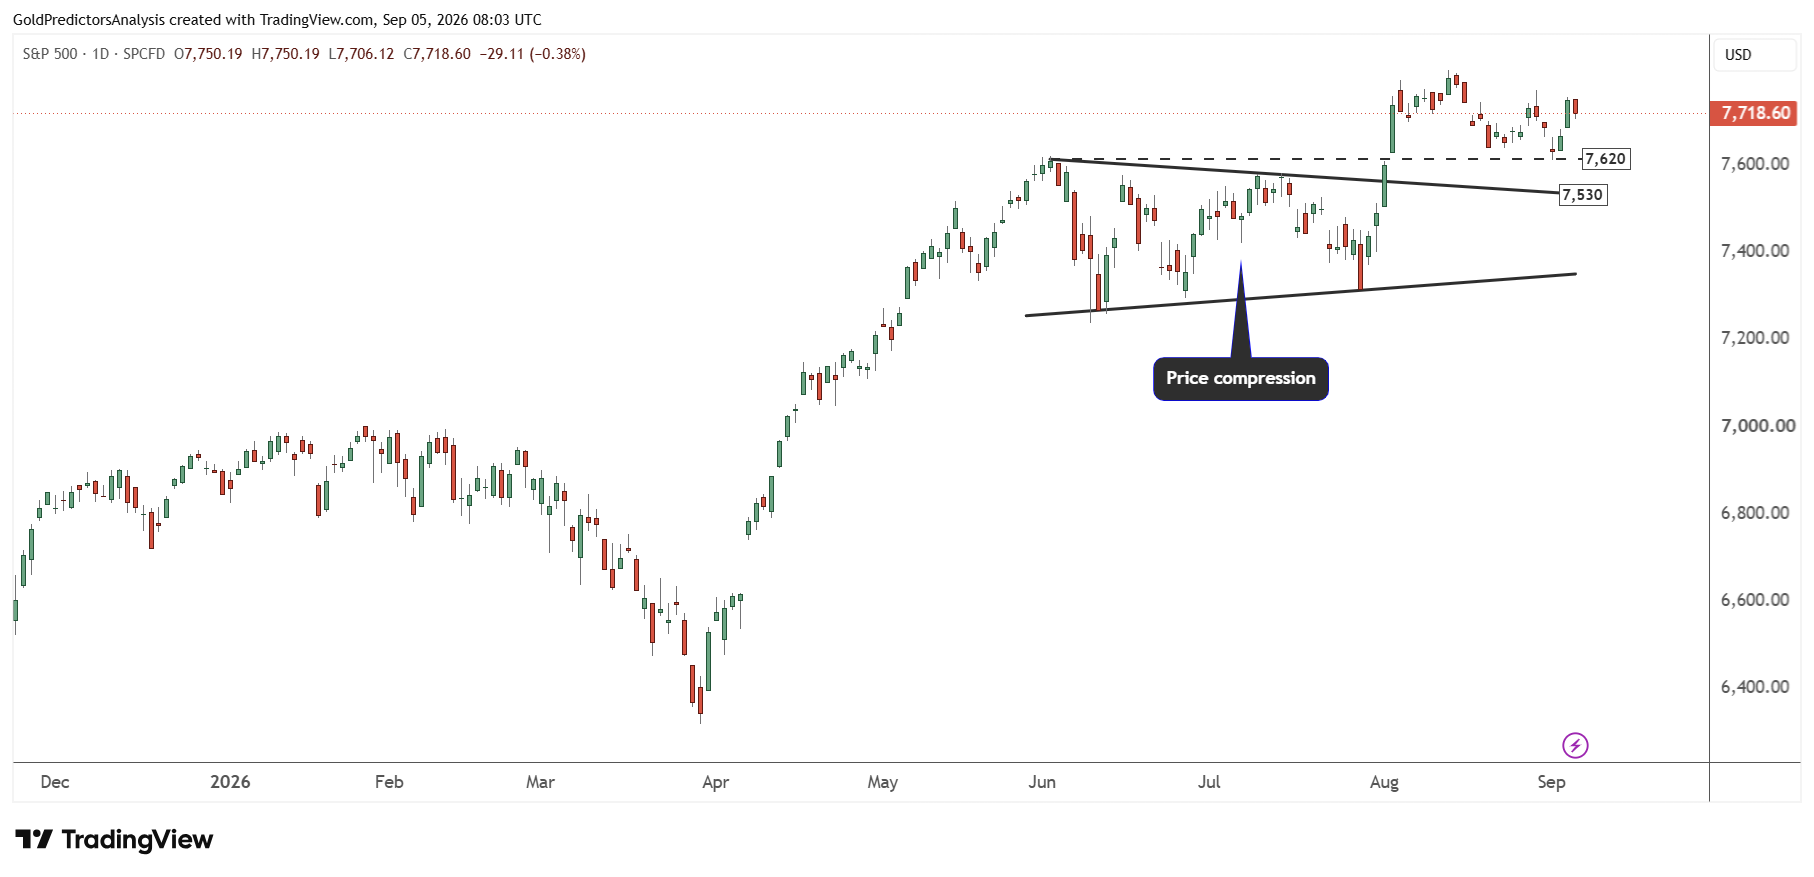
The chart below shows that the price formed a triangle pattern from the June 2, 2026 high toward the July 29, 2026 low. The price consolidated during these two months and then broke higher on August 3, 2026 at 7,560. The breakout above this level pushed the index higher. As expected, the S&P 500 found support at the first level of 7,620 and pushed higher. As long as 7,620 holds in the short term, the index will likely trend toward 8,000. But a break below 7,620 may push the index toward 7,530 as the next key support.
Key Levels to Watch for S&P 500
The S&P 500 may remain uncertain in the short term as strong job growth has increased the risk of a rate hike in September. The tariff threats by Trump could also raise import costs and increase inflation. The market is now watching for the upcoming inflation data. The hot CPI and PPI readings may lift yields and push stocks lower. But if the inflation data are softer, it could ease rate hike fears and support a market recovery.
But the broader technical outlook remains bullish despite the risk of a rate hike. The index holds above the key moving averages and the recent breakout remains intact. As long as 7,620 holds in the short term, the S&P 500 may rise toward 8,000. A break above 8,000 could open the way toward 8,500. But a move below 7,620 may trigger a pullback toward the next support at 7,530. A break below 7,530 will suggest deeper decline to 7,200. In my view, the outlook is uncertain rather than bearish because the index looks overextended but remains in a broader uptrend.
Read more: Jackson Hole Rate Hike Risk Tests 55,000 in Dow Jones