
Advertisement
Advertisement
Crude Oil Forecast May 30, 2016, Technical Analysis
Updated: May 30, 2016, 09:28 GMT+00:00
WTI Crude Oil The WTI Crude Oil market fell slightly during the course of the day on Friday, but found enough support to turn things around and form a
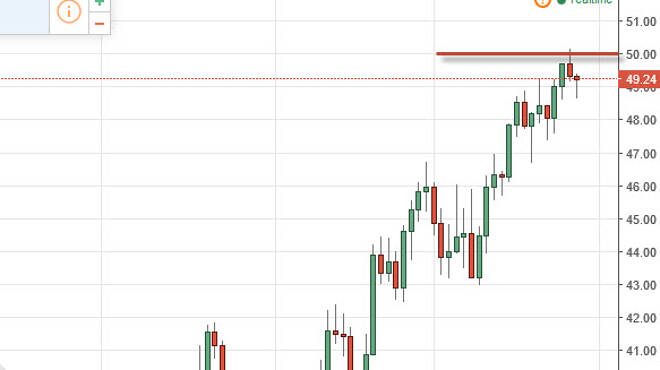
WTI Crude Oil
The WTI Crude Oil market fell slightly during the course of the day on Friday, but found enough support to turn things around and form a hammer. As we have been struggling to get above the $50 level, I believe that this hammer is a very positive sign, and that there is plenty of support below that should continue to pressure the market to the upside. Once we get above the $50 level on a daily close, I feel at that point in time we will continue to go much higher and it will be more or less a “buy-and-hold” type of scenario. We have no interest in selling, at least not until we break down below at the very least the $46 level, and quite frankly it’s probably even all the way down to the $43 level. We are cautiously optimistic about the bullish prospects of this market.
Brent
Brent markets fell initially during the course of the day on Friday as well, but turned around to form a bit of a hammer. The hammer of course is a very bullish sign but we also had a shooting star from the previous session, so looks as if we are going to get a lot of choppiness and volatility in this general vicinity. Because of this, it’s likely that we will continue to struggle in this area, but if we can break above the top of the shooting star from the Thursday session, it’s likely that the market will then reach towards the $54 level above. A break above there becomes more or less a longer-term “buy-and-hold” scenario just as it is in the WTI Crude Oil market.
At this point in time, the one thing you can count on is volatility, but it does seem to be a consistent upward pressure in this market over the longer term, so therefore it’s more than likely going to have an upward bias no matter what happens, at least in the meantime. With this, we play pullbacks as potential value on signs of strength.
About the Author
Christopher Lewisauthor
Chris is a proprietary trader with more than 20 years of experience across various markets, including currencies, indices and commodities. As a senior analyst at FXEmpire since the website’s early days, he offers readers advanced market perspectives to navigate today’s financial landscape with confidence.


Advertisement