
Advertisement
Advertisement
Crude Oil forecast for the week of August 29, 2016, Technical Analysis
Updated: Aug 27, 2016, 04:47 GMT+00:00
WTI Crude Oil The WTI Crude Oil market initially fell during the course of the week but have seen quite a bit of strength return as we ended up forming a
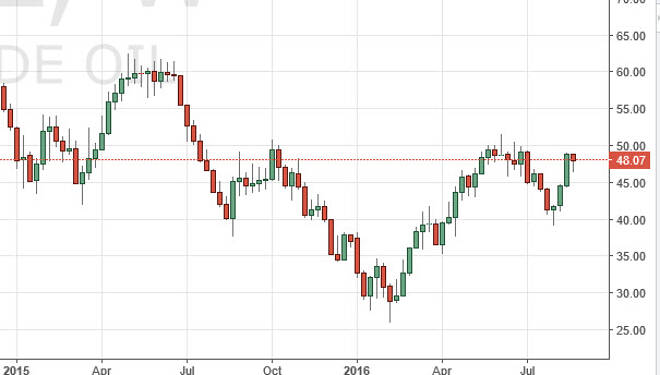
WTI Crude Oil
The WTI Crude Oil market initially fell during the course of the week but have seen quite a bit of strength return as we ended up forming a bit of a hammer. The hammer sits just below the $50 level, so I think that is a major barrier the way going to have to try to overcome in order to continue the upward momentum. However, based upon this candlestick I would say that there is a relatively decent chance that we eventually do. If we do, I feel that $55 will probably be the next move. Pullbacks at this point in time will be difficult to sell, lease from the longer-term perspective. Quite frankly, the oil markets are extraordinarily dangerous at the moment as we have seen such volatility over the last several months.
Brent
Brent markets look even stronger, as we have formed a hammer at the extreme highs. I believe that sooner or later we will break out and if we do the market should continue to go higher at that point. I realize that a lot of the strengthen oil is due to a lack of drilling next year, but we have to wonder whether or not demand is going to be there. At this point in time, I feel that the market could very well correct itself violently so I am very cautious when it comes to this particular market. I think that $55 will be the next target speaking logically and thinking of longer and whole numbers, but at this point in time even if we pull back I think I would be hesitant to sell simply because there has been such an impulsive move higher. Quite frankly, this looks like a market that is ready to break out with just the slightest bit of good news and let’s face it, it really wouldn’t take much at this point in time as we have seen such a strong turn around. With this, I believe that $55 will probably be targeted.
About the Author
Christopher Lewisauthor
Chris is a proprietary trader with more than 20 years of experience across various markets, including currencies, indices and commodities. As a senior analyst at FXEmpire since the website’s early days, he offers readers advanced market perspectives to navigate today’s financial landscape with confidence.


Advertisement