


NASDAQ 100 Technical Analysis
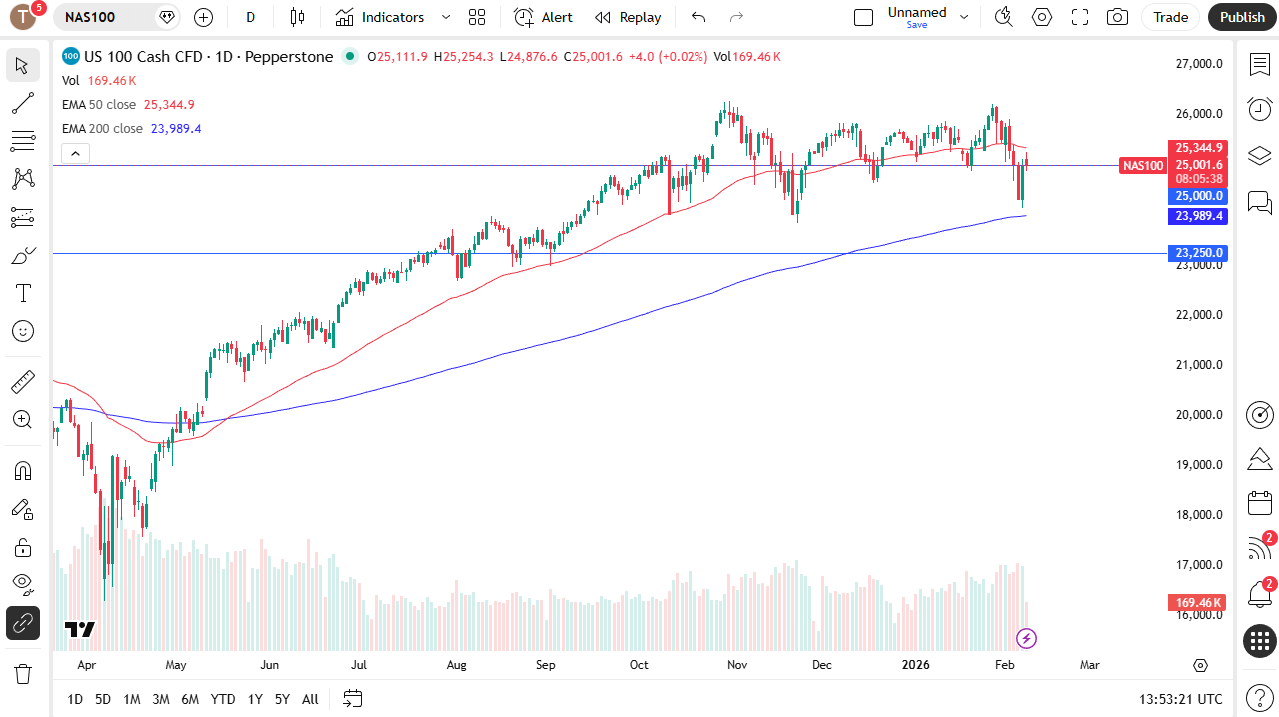
The Nasdaq 100 is slightly negative at the early hours here on Monday, with the 50-day EMA offering a bit of a barrier.
Ultimately, if we can break above there, then I think it opens up the possibility of a move to the 26,000 level. Short-term pullbacks for me, at least, are still buying opportunities, but keep in mind we are in the midst of earnings season, and that will continue to cause a lot of chaos. In fact, one major player this week would be Tesla with its earnings call, but I think really a dip offers an opportunity with that 200-day EMA sitting just below 24,000, solidifying that support level.
Dow Jones 30 Technical Analysis
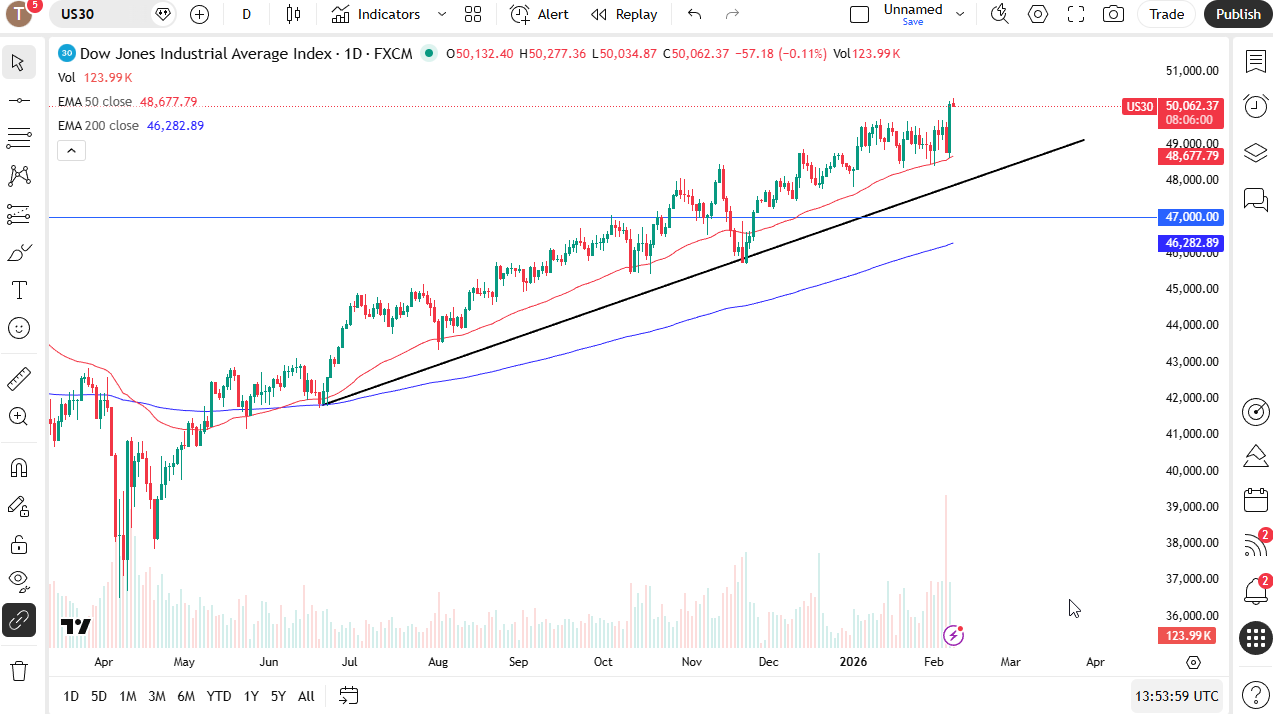
The Dow Jones 30 is a little bit soft in the early hours, but overall, industrials have been performing quite well, and we did just break to a fresh new high, clearing that 50,000 level on Friday on the daily close.
I do think that means something, and I do think that any pullback at this point in time will be thought of as a buying opportunity. I certainly will look at it as such, especially near the 49,500 level if we do in fact get a 500- or 600-point sell-off.
S&P 500 Technical Analysis
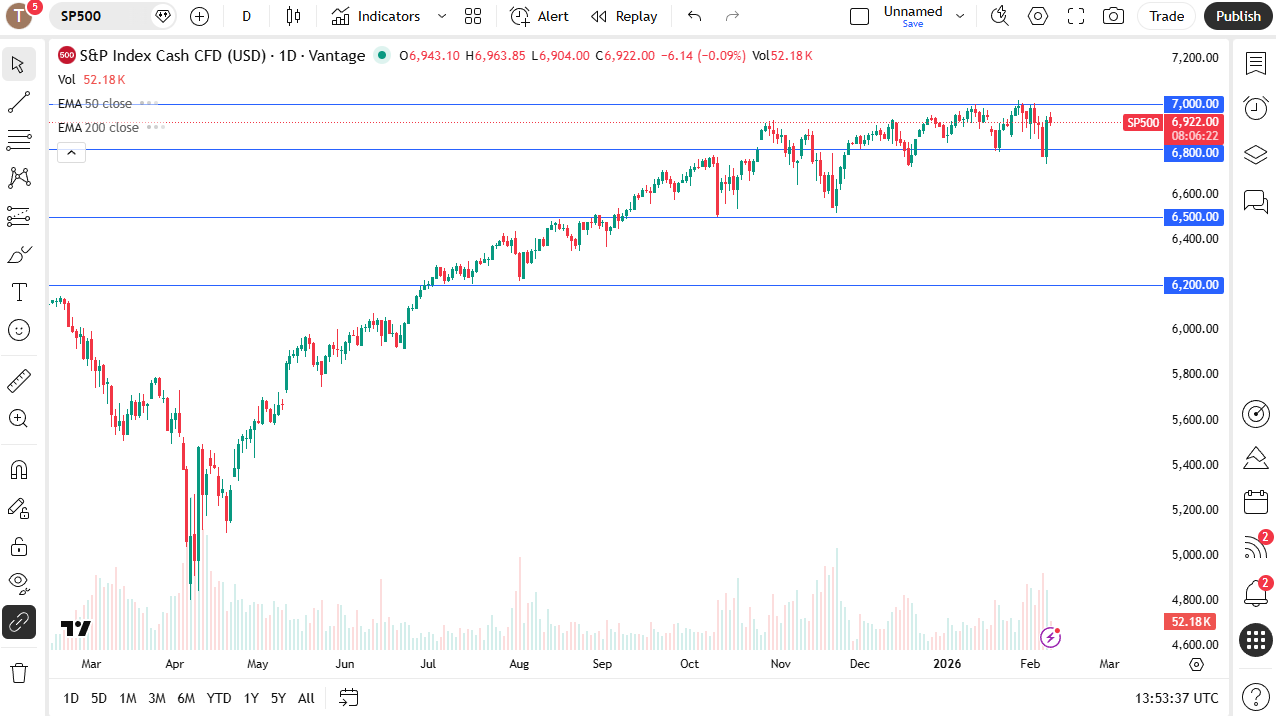
The S&P 500 continues the same story. We’re going sideways around the 50-day EMA, and of course, we continue to look at the 7,000 level as the line in the sand, as it were. If we can get a daily close above that level then I think the S&P 500 really takes off.
Between now and then, I look at this as a buy on the dip scenario with the 6,750 level offering support. If we break down below there, then a deeper correction is probably in the cards, where we go looking to the 200-day EMA, and again, this is earnings season, so we will see a lot of noise out there, so be prepared.