
Advertisement
Advertisement
Crude Oil forecast for the week of July 18, 2016, Technical Analysis
Published: Jul 16, 2016, 05:23 GMT+00:00
WTI Crude Oil The WTI Crude Oil market went back and forth during the course of the week, showing support at the $44 level, but the slightly positive
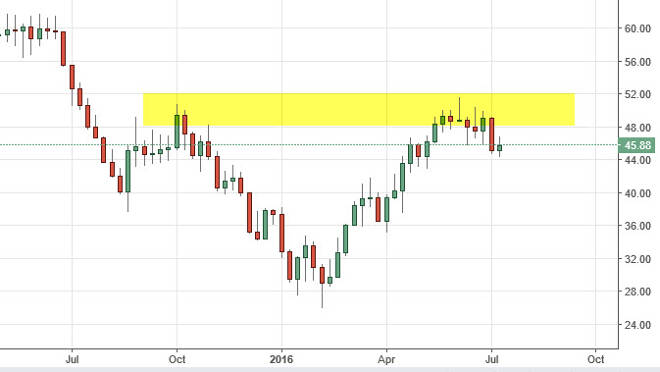
WTI Crude Oil
The WTI Crude Oil market went back and forth during the course of the week, showing support at the $44 level, but the slightly positive candle shows a real lack of conviction. At this point in time, a break down below the $44 level should send this market looking for the $40 level below there. That level of course been broken to the downside is negative as well. Even though this has been a very violent rally over the last couple weeks, when you look at the longer-term perspective, it’s not that impressive. With this, I still believe that we are going to see bearish pressure given enough time, and a break down and daily close below the $44 level is in fact the signal to start selling for the longer term from what I can tell at the moment.
Brent
Brent markets also rallied a bit during the course of the week, but marginally so. Because of this, I believe it’s only a matter of time before the sellers get involved in this market, perhaps on a break down below the $45 level. If we can break down below there, the $40 level will more than likely be targeted. Keep in mind that the strengthening US dollar will continue to work against the value of Brent markets and several commodity markets in general. I have no interest in buying this market until we break above the $52 level, as it would show a significant breakout above resistance. At that point in time, the market will probably try to reach towards the $60 level. However, I do not think that it’s going to be easy to do such a thing, and as a result I believe that supply increasing will continue to weigh upon the value of this commodity as well. Ultimately, I believe that selling is going to be the easiest thing to do but we need to see a break down from current levels in order to do so at this point in time.
About the Author
Christopher Lewisauthor
Chris is a proprietary trader with more than 20 years of experience across various markets, including currencies, indices and commodities. As a senior analyst at FXEmpire since the website’s early days, he offers readers advanced market perspectives to navigate today’s financial landscape with confidence.


Advertisement