The NASDAQ 100 initially fell during the course of the week, bouncing off of the 4200 level and then spiking all the way to the 4450 range. Ultimately, I
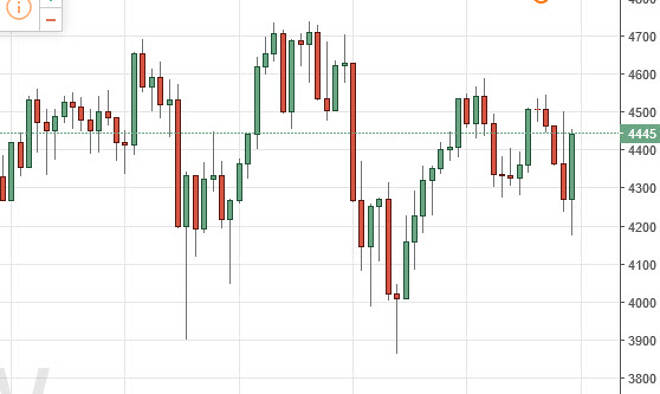
The NASDAQ 100 initially fell during the course of the week, bouncing off of the 4200 level and then spiking all the way to the 4450 range. Ultimately, I believe that this market goes higher but we may have to see short-term pullbacks in order to take advantage of value. The Monday session of course will feature a closed America, due to the Independence Day holiday. So having said that, I believe that we will be looking at moves later in the week. I believe that short-term charts are probably the better way to go.
Chris is a proprietary trader with more than 20 years of experience across various markets, including currencies, indices and commodities. As a senior analyst at FXEmpire since the website’s early days, he offers readers advanced market perspectives to navigate today’s financial landscape with confidence.